Chapter 6: The State of Revenue Generation in Cities - LGRC DILG 10
Chapter 6: The State of Revenue Generation in Cities - LGRC DILG 10
Chapter 6: The State of Revenue Generation in Cities - LGRC DILG 10

Create successful ePaper yourself
Turn your PDF publications into a flip-book with our unique Google optimized e-Paper software.
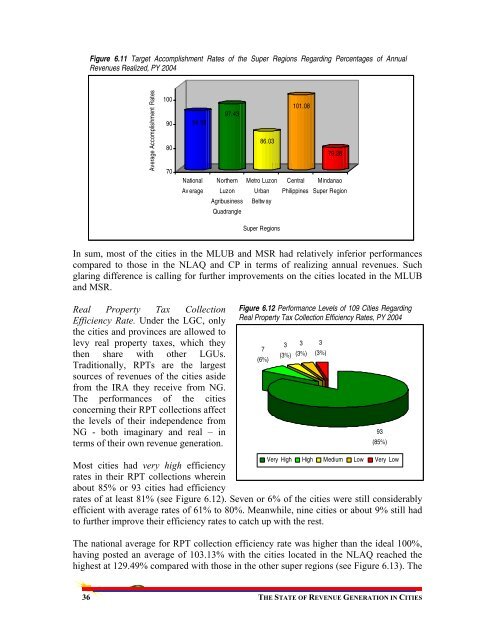
Figure 6.11 Target Accomplishment Rates <strong>of</strong> the Super Regions Regard<strong>in</strong>g Percentages <strong>of</strong> Annual<strong>Revenue</strong>s Realized, PY 2004Average Accomplishment Rates<strong>10</strong>090807094.55NationalAv erage97.43NorthernLuzonAgribus<strong>in</strong>essQuadrangle86.03Metro LuzonUrbanBeltw ay<strong>10</strong>1.0879.28CentralPhilipp<strong>in</strong>esM<strong>in</strong>danaoSuper RegionSuper RegionsIn sum, most <strong>of</strong> the cities <strong>in</strong> the MLUB and MSR had relatively <strong>in</strong>ferior performancescompared to those <strong>in</strong> the NLAQ and CP <strong>in</strong> terms <strong>of</strong> realiz<strong>in</strong>g annual revenues. Suchglar<strong>in</strong>g difference is call<strong>in</strong>g for further improvements on the cities located <strong>in</strong> the MLUBand MSR.Real Property Tax CollectionEfficiency Rate. Under the LGC, onlythe cities and prov<strong>in</strong>ces are allowed tolevy real property taxes, which theythen share with other LGUs.Traditionally, RPTs are the largestsources <strong>of</strong> revenues <strong>of</strong> the cities asidefrom the IRA they receive from NG.<strong>The</strong> performances <strong>of</strong> the citiesconcern<strong>in</strong>g their RPT collections affectthe levels <strong>of</strong> their <strong>in</strong>dependence fromNG - both imag<strong>in</strong>ary and real – <strong>in</strong>terms <strong>of</strong> their own revenue generation.Figure 6.12 Performance Levels <strong>of</strong> <strong>10</strong>9 <strong>Cities</strong> Regard<strong>in</strong>gReal Property Tax Collection Efficiency Rates, PY 200437(3%)(6%)3(3%)3(3%)93(85%)Very High High Medium Low Very LowMost cities had very high efficiencyrates <strong>in</strong> their RPT collections where<strong>in</strong>about 85% or 93 cities had efficiencyrates <strong>of</strong> at least 81% (see Figure 6.12). Seven or 6% <strong>of</strong> the cities were still considerablyefficient with average rates <strong>of</strong> 61% to 80%. Meanwhile, n<strong>in</strong>e cities or about 9% still hadto further improve their efficiency rates to catch up with the rest.<strong>The</strong> national average for RPT collection efficiency rate was higher than the ideal <strong>10</strong>0%,hav<strong>in</strong>g posted an average <strong>of</strong> <strong>10</strong>3.13% with the cities located <strong>in</strong> the NLAQ reached thehighest at 129.49% compared with those <strong>in</strong> the other super regions (see Figure 6.13). <strong>The</strong>36 THE STATE OF REVENUE GENERATION IN CITIES