Statistical skills example sheet: Spearman's Rank - Moors for the ...
Statistical skills example sheet: Spearman's Rank - Moors for the ...
Statistical skills example sheet: Spearman's Rank - Moors for the ...
You also want an ePaper? Increase the reach of your titles
YUMPU automatically turns print PDFs into web optimized ePapers that Google loves.
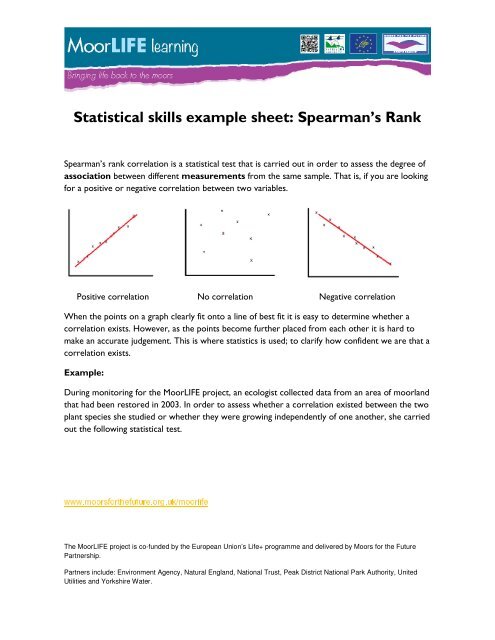
<strong>Statistical</strong> <strong>skills</strong> <strong>example</strong> <strong>sheet</strong>: Spearman’s <strong>Rank</strong>Spearman’s rank correlation is a statistical test that is carried out in order to assess <strong>the</strong> degree ofassociation between different measurements from <strong>the</strong> same sample. That is, if you are looking<strong>for</strong> a positive or negative correlation between two variables.Positive correlation No correlation Negative correlationWhen <strong>the</strong> points on a graph clearly fit onto a line of best fit it is easy to determine whe<strong>the</strong>r acorrelation exists. However, as <strong>the</strong> points become fur<strong>the</strong>r placed from each o<strong>the</strong>r it is hard tomake an accurate judgement. This is where statistics is used; to clarify how confident we are that acorrelation exists.Example:During monitoring <strong>for</strong> <strong>the</strong> MoorLIFE project, an ecologist collected data from an area of moorlandthat had been restored in 2003. In order to assess whe<strong>the</strong>r a correlation existed between <strong>the</strong> twoplant species she studied or whe<strong>the</strong>r <strong>the</strong>y were growing independently of one ano<strong>the</strong>r, she carriedout <strong>the</strong> following statistical test.The MoorLIFE project is co-funded by European Union’s Life+ programme and delivered by <strong>Moors</strong> <strong>for</strong> <strong>the</strong> FuturePartnership.www.moors<strong>for</strong><strong>the</strong>future.org.uk/moorlifePartners include: Environment Agency, Natural England, National Trust, Peak District National Park Authority, UnitedUtilities and Yorkshire Water.
Quadrat% Cover ofBilberry% CoverCommonHea<strong>the</strong>r1 5 02 40 03 50 54 5 05 10 06 25 07 0 18 4 09 0 010 0 111 10 612 2 0.5First of all, <strong>for</strong>m a null hypo<strong>the</strong>sis. This hypo<strong>the</strong>sis assumes <strong>the</strong>re is no relationship between <strong>the</strong>two variables e.g. There is no correlation between percentage cover of Bilberry and percentage cover ofCommon Hea<strong>the</strong>r.Step one: <strong>Rank</strong> <strong>the</strong> dataFor each set of data assign ranks from lowest to highest. The lowest value in a column will begiven <strong>the</strong> rank of 1, <strong>the</strong> next smallest number will be given a 2 etc. If <strong>the</strong>re are tied scores each ofthose will share <strong>the</strong> ranks and be given <strong>the</strong> average (mean) rank.For <strong>example</strong>, <strong>the</strong>re are 7 quadrats with a percentage cover of Hea<strong>the</strong>r value of 0. As <strong>the</strong>se are <strong>the</strong>lowest values in that data set, <strong>the</strong>y share <strong>the</strong> ranks of 1, 2, 3, 4, 5, 6 and 7 (a total of 28) givingeach value an average rank of 4 (28÷7). The next rank that can be given is <strong>the</strong>re<strong>for</strong>e an 8 as ranks1 to 7 have already been assigned. Similarly in <strong>the</strong> same data set <strong>the</strong>re are two values <strong>for</strong> Hea<strong>the</strong>rcover of 1%, <strong>the</strong>se two <strong>the</strong>n share <strong>the</strong> ranks of 8 and 9 (8 +9 = 17, 17÷2=9.5). Each place isassigned <strong>the</strong> average rank of 9.5 and <strong>the</strong> next rank to be given out is that of 10.The MoorLIFE project is co-funded by European Union’s Life+ programme and delivered by <strong>Moors</strong> <strong>for</strong> <strong>the</strong> FuturePartnership.www.moors<strong>for</strong><strong>the</strong>future.org.uk/moorlifePartners include: Environment Agency, Natural England, National Trust, Peak District National Park Authority, UnitedUtilities and Yorkshire Water.
Quadrat% Cover ofBilberry<strong>Rank</strong>variable 1% CoverHea<strong>the</strong>r<strong>Rank</strong>variable 21 5 6.5 0 42 40 11 0 43 50 12 5 114 5 6.5 0 45 10 8.5 0 46 25 10 0 47 0 2 1 9.58 4 5 0 49 0 2 0 410 0 2 1 9.511 10 8.5 6 1212 2 4 0.5 8Step two: Find <strong>the</strong> differences between rank 1 and rank 2 <strong>for</strong> each value in <strong>the</strong> table.<strong>Rank</strong>variable 1<strong>Rank</strong>variable 26.5 4 2.511 4 712 11 16.5 4 2.58.5 4 4.510 4 62 9.5 -7.55 4 12 4 -22 9.5 -7.58.5 12 -3.54 8 -4DifferencedThe MoorLIFE project is co-funded by European Union’s Life+ programme and delivered by <strong>Moors</strong> <strong>for</strong> <strong>the</strong> FuturePartnership.www.moors<strong>for</strong><strong>the</strong>future.org.uk/moorlifePartners include: Environment Agency, Natural England, National Trust, Peak District National Park Authority, UnitedUtilities and Yorkshire Water.
Step three: Square <strong>the</strong> differences to get rid of negative numbers <strong>the</strong>n find <strong>the</strong> sum of d 2<strong>Rank</strong><strong>Rank</strong> Difference d 2variable 1 variable 2d6.5 4 2.5 6.2511 4 7 4912 11 1 16.5 4 2.5 6.258.5 4 4.5 20.2510 4 6 362 9.5 -7.5 56.255 4 1 12 4 -2 42 9.5 -7.5 56.258.5 12 -3.5 12.254 8 -4 16∑ d 2 = 264.5The MoorLIFE project is co-funded by European Union’s Life+ programme and delivered by <strong>Moors</strong> <strong>for</strong> <strong>the</strong> FuturePartnership.www.moors<strong>for</strong><strong>the</strong>future.org.uk/moorlifePartners include: Environment Agency, Natural England, National Trust, Peak District National Park Authority, UnitedUtilities and Yorkshire Water.
Step four: Calculate Spearman’s <strong>Rank</strong> using <strong>the</strong> <strong>for</strong>mula below, where n is <strong>the</strong> number of samples in eachcategory.<strong>Rank</strong> (R) = 1 -6∑d 2n(n 2 -1)R = 1 - 6 x 264.512 (144-1)R = 1 – 0.925R = 0.075The MoorLIFE project is co-funded by European Union’s Life+ programme and delivered by <strong>Moors</strong> <strong>for</strong> <strong>the</strong> FuturePartnership.www.moors<strong>for</strong><strong>the</strong>future.org.uk/moorlifePartners include: Environment Agency, Natural England, National Trust, Peak District National Park Authority, UnitedUtilities and Yorkshire Water.
Step five: work out <strong>the</strong> meaning of <strong>the</strong> R valueThe closer R is to 1 or -1 <strong>the</strong> more likely <strong>the</strong> correlation. A perfect positive correlation has an Rvalue of 1, a perfect negative correlation has a value of -1.+10-1Perfect positivecorrelationNo correlationPerfect negativecorrelationIf <strong>the</strong> value lies between -1 and 1 we need to carry out a test <strong>for</strong> significance.The significance level is calculated by finding <strong>the</strong> degrees of freedom <strong>for</strong> your test. This is <strong>the</strong>number of pairs in your sample minus 2.In our <strong>example</strong> this would be:12-2 = 10 degrees of freedomThe MoorLIFE project is co-funded by European Union’s Life+ programme and delivered by <strong>Moors</strong> <strong>for</strong> <strong>the</strong> FuturePartnership.www.moors<strong>for</strong><strong>the</strong>future.org.uk/moorlifePartners include: Environment Agency, Natural England, National Trust, Peak District National Park Authority, UnitedUtilities and Yorkshire Water.
In Biology we work to a significance level of 0.05, that is, at this level we are 95% confident that<strong>the</strong> results are due to a correlation and not due to chance. Looking at <strong>the</strong> table below we can seethat at a significant level of 0.05, <strong>for</strong> 10 degrees of freedom <strong>the</strong> R value must be 0.564 or above <strong>for</strong>it to be considered a statistically significant correlation. Our result does not reach this value,<strong>the</strong>re<strong>for</strong>e <strong>the</strong> probability of our result being due to chance alone is greater than 5% and we must rejectour null hypo<strong>the</strong>sis, <strong>the</strong> two variables are not correlated. We can conclude that <strong>the</strong> percentagecover of Bilberry and Common Hea<strong>the</strong>r are not correlated (positively nor negatively) and <strong>the</strong> twoplants <strong>the</strong>re<strong>for</strong>e grow independently of one ano<strong>the</strong>r.Degreesof Significance levelFreedom 0.05 0.014 1.0005 0.900 1.0006 0.829 0.9437 0.714 0.8938 0.643 0.8339 0.600 0.78310 0.564 0.74511 0.523 0.73612 0.497 0.70313 0.475 0.67314 0.457 0.64615 0.441 0.62316 0.425 0.60117 0.301 0.58218 0.399 0.56419 0.388 0.54920 0.377 0.534The MoorLIFE project is co-funded by European Union’s Life+ programme and delivered by <strong>Moors</strong> <strong>for</strong> <strong>the</strong> FuturePartnership.www.moors<strong>for</strong><strong>the</strong>future.org.uk/moorlifePartners include: Environment Agency, Natural England, National Trust, Peak District National Park Authority, UnitedUtilities and Yorkshire Water.
Exercise: Results analysisFollowing restoration of some Blanket Bog sites on Bleaklow by <strong>the</strong> MoorLIFE team, several areas ofBlanket Bog were monitored in order to measure <strong>the</strong> success of <strong>the</strong> process. The table shows an extractfrom <strong>the</strong> results table <strong>for</strong> an area of Blanket Bog, (Joseph’s Patch), which was restored in 2003.Quadrat_IDPercentagecover ofD. flexuosa<strong>Rank</strong> 1Percentagecover ofAgrostis spJP001 30 15JP003 35 1JP004 15 5JP005 15 10JP006 15 2JP007 10 10JP007b 3 3JP008 5 1JP009 10 5JP010 25 0.25JP011 35 30JP012 50 20JP013 50 10JP014 30 15JP015 40 15JP016 50 5JP017 30 4JP018 15 10JP019 40 7JP020b 35 15JP021 30 30JP022 50 5JP023 15 10JP024 40 10JP025 40 12JP026 10 4<strong>Rank</strong> 2The MoorLIFE project is co-funded by European Union’s Life+ programme and delivered by <strong>Moors</strong> <strong>for</strong> <strong>the</strong> FuturePartnership.www.moors<strong>for</strong><strong>the</strong>future.org.uk/moorlifePartners include: Environment Agency, Natural England, National Trust, Peak District National Park Authority, UnitedUtilities and Yorkshire Water.


