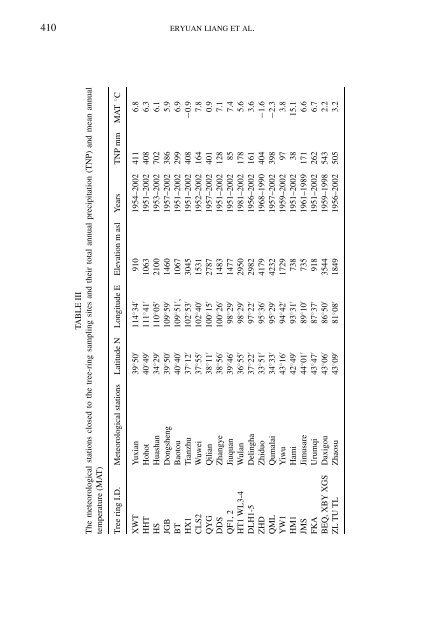
410 ERYUAN LIANG ET AL.TABLE IIIThe meteorological stations closed to the tree-ring sampling sites and their total annual precipitation (TNP) and mean annualtemperature (MAT)Tree ring I.D. Meteorological stations Latitude N Longitude E Elevation m asl Years TNP mm MAT ◦ CXWT Yuxian 39 ◦ 50 ′ 114 ◦ 34 ′ 910 1954–2002 411 6.8HHT Hohot 40 ◦ 49 ′ 111 ◦ 41 ′ 1063 1951–2002 408 6.3HS Huashan 34 ◦ 29 ′ 110 ◦ 05 ′ 2100 1953–2002 702 6.1JGB Dongsheng 39 ◦ 50 ′ 109 ◦ 59 ′ 1460 1957–2002 386 5.9BT Baotou 40 ◦ 40 ′ 109 ◦ 51 ′ , 1067 1951–2002 299 6.9HX1 Tianzhu 37 ◦ 12 ′ 102 ◦ 53 ′ 3045 1951–2002 408 −0.9CLS2 Wuwei 37 ◦ 55 ′ 102 ◦ 40 ′ 1531 1952–2002 164 7.8QYG Qilian 38 ◦ 11 ′ 100 ◦ 15 ′ 2787 1957–2002 401 0.9DDS Zhangye 38 ◦ 56 ′ 100 ◦ 26 ′ 1483 1951–2002 128 7.1QF1, 2 Jiuquan 39 ◦ 46 ′ 98 ◦ 29 ′ 1477 1951–2002 85 7.4HT1 WL3-4 Wulan 36 ◦ 55 ′ 98 ◦ 29 ′ 2950 1981–2002 178 5.6DLH1-5 Delingha 37 ◦ 22 ′ 97 ◦ 22 ′ 2982 1956–2002 161 3.6ZHD Zhiduo 33 ◦ 51 ′ 95 ◦ 36 ′ 4179 1968–1990 404 −1.6QML Qumalai 34 ◦ 33 ′ 95 ◦ 29 ′ 4232 1957–2002 398 −2.3YW1 Yiwu 43 ◦ 16 ′ 94 ◦ 42 ′ 1729 1959–2002 97 3.8HM1 Hami 42 ◦ 49 ′ 93 ◦ 31 ′ 738 1951–2002 38 15.1JMS Jimusare 44 ◦ 01 ′ 89 ◦ 10 ′ 735 1961–1989 171 6.6FKA Urumqi 43 ◦ 47 ′ 87 ◦ 37 ′ 918 1951–2002 262 6.7BEQ, X<strong>BY</strong> XGS Daxigou 43 ◦ 06 ′ 86 ◦ 50 ′ 3544 1959–1998 543 2.2ZL TU TL Zhaosu 43 ◦ 09 ′ 81 ◦ 08 ′ 1849 1956–2002 505 3.2
<strong>THE</strong> <strong>1920S</strong> <strong>DROUGHT</strong> IN NOR<strong>THE</strong>RN CHINA 411Feb–July precipitation in Baotou (Liu et al., 2001) can be explained by the HHT andBT chronologies, respectively. Tree-ring chronologies (ring width and maximumdensity) of Huashan pine account for about 55% of May–June precipitation at onesite (Hughes et al., 1994). In addition, 66% and 64% of the variance of April–Juneprecipitation (Shao and Wu, 1996) and May–June drought indices (Liu et al., 2002)can be captured by the HS tree-ring chronologies, respectively.In Regions 3 and 4, precipitation, especially in May and June, is the most dominantlimiting factor for tree growth. The QYG tree-ring width chronology in Region3 explains 60% of the variance of May–July moisture indices, as defined by theratio of monthly precipitation to monthly mean temperature (Zhang and Wu, 1997).The first principal component series extracted from these seven millennial lengthchronologies (DLH1 to DLH5, WL3 and WL4) explains 63% of the annual precipitation(from July to June) variance in Delingha in Region 4 (Shao et al., 2005)and captures the transition from the dry spell to the wet spell in the past 20 yearsin Northwest China (Shi, 2003). In Region 5, Qin et al. (2003) reported that theQML and ZHD chronologies together account for 30% of the variance of May–Junemoisture indices.In Regions 6 and 7, tree growth is also primarily influenced by seasonal precipitation(Table II). HM1 and YW1 of Region 6 show a significant and positiveresponse to May–September and December–January precipitation, respectively (Li,1989). In Region 7, BEQ and X<strong>BY</strong> explain 62% of the total variance of observedprecipitation from July through February (Yuan et al., 2001). In addition, Zhanget al. (1996) reported that the mean tree-ring series of six chronologies includingJMS and FKA had a strong and negative correlation with regional drought days.Three chronologies (ZL, TU and TL) together can explain 75% of the variance inannual (June–May) precipitation (Yuan et al., 2000).2.4.2. Climatic Signals Recorded in the New Tree-Ring ChronologiesAll eight new tree-ring chronologies in Regions 1 and 3 contain strong precipitationsignals. They show a high correlation with precipitation in July, August andSeptember (or one of these months) of the previous year, and May–June of thegrowth year (Figure 2). At the XWT, JGB and HX1 stands, precipitation duringthe early spring also has a significant impact on tree growth (Figure 2). In addition,a strong negative relationship was found between tree growth and monthly meantemperature in May and June at XWT, and June at CLS2, DDS, QF1 and QF2, andApril and June at HT1.Precipitation is a pronounced limiting factor for tree growth in these semi-aridand arid regions, where the annual precipitation ranges from 89 to 400 mm. Basedon annual temperature variation, cambial activity starts in May at most forest sites(Zhang et al., 1982). During the early growing season, sufficient soil moisture isnecessary for tree growth. However, the recharge of soil water prior to tree growthand precipitation in the early growing season in these semi-arid and arid regionsof northern China is often not sufficient to meet the needs of biological processes;