A.6.2 Plotting Data with Error Bars - Wolfram Research
A.6.2 Plotting Data with Error Bars - Wolfram Research
A.6.2 Plotting Data with Error Bars - Wolfram Research
Create successful ePaper yourself
Turn your PDF publications into a flip-book with our unique Google optimized e-Paper software.
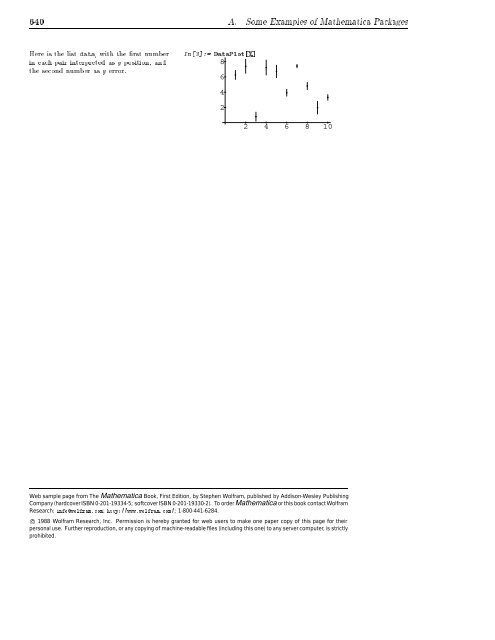
640 A. Some Examples of Mathematica PackagesHere is the list data, <strong>with</strong>therstnumberin each pair interpreted as y position, andthe second number as y error.In[3]:= <strong>Data</strong>Plot[%]86422 4 6 8 10Web sample page from The Mathematica Book, First Edition, by Stephen <strong>Wolfram</strong>, published by Addison-Wesley PublishingCompany (hardcover ISBN 0-201-19334-5; softcover ISBN 0-201-19330-2). To order Mathematica or this book contact <strong>Wolfram</strong><strong>Research</strong>: info@wolfram.com; http://www.wolfram.com/; 1-800-441-6284.c 1988 <strong>Wolfram</strong> <strong>Research</strong>, Inc. Permission is hereby granted for web users to make one paper copy of this page for theirpersonal use. Further reproduction, or any copying of machine-readable files (including this one) to any server computer, is strictlyprohibited.


