Desert locust populations, rainfall and climate change: insights from ...
Desert locust populations, rainfall and climate change: insights from ...
Desert locust populations, rainfall and climate change: insights from ...

You also want an ePaper? Increase the reach of your titles
YUMPU automatically turns print PDFs into web optimized ePapers that Google loves.
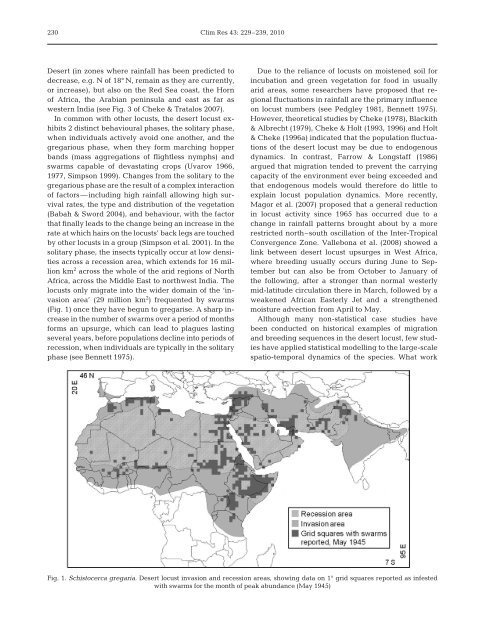
230Clim Res 43: 229–239, 2010<strong>Desert</strong> (in zones where <strong>rainfall</strong> has been predicted todecrease, e.g. N of 18° N, remain as they are currently,or increase), but also on the Red Sea coast, the Hornof Africa, the Arabian peninsula <strong>and</strong> east as far aswestern India (see Fig. 3 of Cheke & Tratalos 2007).In common with other <strong>locust</strong>s, the desert <strong>locust</strong> exhibits2 distinct behavioural phases, the solitary phase,when individuals actively avoid one another, <strong>and</strong> thegregarious phase, when they form marching hopperb<strong>and</strong>s (mass aggregations of flightless nymphs) <strong>and</strong>swarms capable of devastating crops (Uvarov 1966,1977, Simpson 1999). Changes <strong>from</strong> the solitary to thegregarious phase are the result of a complex interactionof factors—including high <strong>rainfall</strong> allowing high survivalrates, the type <strong>and</strong> distribution of the vegetation(Babah & Sword 2004), <strong>and</strong> behaviour, with the factorthat finally leads to the <strong>change</strong> being an increase in therate at which hairs on the <strong>locust</strong>s’ back legs are touchedby other <strong>locust</strong>s in a group (Simpson et al. 2001). In thesolitary phase, the insects typically occur at low densitiesacross a recession area, which extends for 16 millionkm 2 across the whole of the arid regions of NorthAfrica, across the Middle East to northwest India. The<strong>locust</strong>s only migrate into the wider domain of the ‘invasionarea’ (29 million km 2 ) frequented by swarms(Fig. 1) once they have begun to gregarise. A sharp increasein the number of swarms over a period of monthsforms an upsurge, which can lead to plagues lastingseveral years, before <strong>populations</strong> decline into periods ofrecession, when individuals are typically in the solitaryphase (see Bennett 1975).Due to the reliance of <strong>locust</strong>s on moistened soil forincubation <strong>and</strong> green vegetation for food in usuallyarid areas, some researchers have proposed that regionalfluctuations in <strong>rainfall</strong> are the primary influenceon <strong>locust</strong> numbers (see Pedgley 1981, Bennett 1975).However, theoretical studies by Cheke (1978), Blackith& Albrecht (1979), Cheke & Holt (1993, 1996) <strong>and</strong> Holt& Cheke (1996a) indicated that the population fluctuationsof the desert <strong>locust</strong> may be due to endogenousdynamics. In contrast, Farrow & Longstaff (1986)argued that migration tended to prevent the carryingcapacity of the environment ever being exceeded <strong>and</strong>that endogenous models would therefore do little toexplain <strong>locust</strong> population dynamics. More recently,Magor et al. (2007) proposed that a general reductionin <strong>locust</strong> activity since 1965 has occurred due to a<strong>change</strong> in <strong>rainfall</strong> patterns brought about by a morerestricted north–south oscillation of the Inter-TropicalConvergence Zone. Vallebona et al. (2008) showed alink between desert <strong>locust</strong> upsurges in West Africa,where breeding usually occurs during June to Septemberbut can also be <strong>from</strong> October to January ofthe following, after a stronger than normal westerlymid-latitude circulation there in March, followed by aweakened African Easterly Jet <strong>and</strong> a strengthenedmoisture advection <strong>from</strong> April to May.Although many non-statistical case studies havebeen conducted on historical examples of migration<strong>and</strong> breeding sequences in the desert <strong>locust</strong>, few studieshave applied statistical modelling to the large-scalespatio-temporal dynamics of the species. What workFig. 1. Schistocerca gregaria. <strong>Desert</strong> <strong>locust</strong> invasion <strong>and</strong> recession areas, showing data on 1° grid squares reported as infestedwith swarms for the month of peak abundance (May 1945)