
Create successful ePaper yourself
Turn your PDF publications into a flip-book with our unique Google optimized e-Paper software.
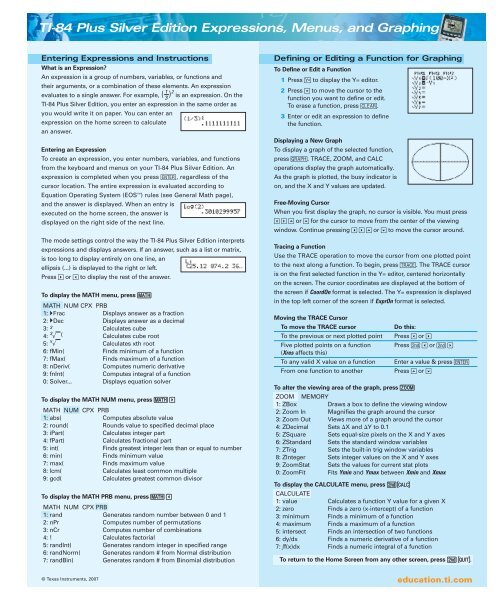
<strong>TI</strong>-84 Plus Silver Edition Expressions, Menus, and GraphingEntering Expressions and InstructionsWhat is an Expression?An expression is a group of numbers, variables, or functions andtheir arguments, or a combination of these elements. An expression1evaluates to a single answer. For example, ( ) 2 3is an expression. On the<strong>TI</strong>-84 Plus Silver Edition, you enter an expression in the same order asyou would write it on paper. You can enter anexpression on the home screen to calculatean answer.Entering an ExpressionTo create an expression, you enter numbers, variables, and functionsfrom the keyboard and menus on your <strong>TI</strong>-84 Plus Silver Edition. Anexpression is completed when you press Õ, regardless of thecursor location. The entire expression is evaluated according toEquation Operating System (EOS ) rules (see General Math page),and the answer is displayed. When an entry isexecuted on the home screen, the answer isdisplayed on the right side of the next line.The mode settings control the way the <strong>TI</strong>-84 Plus Silver Edition interpretsexpressions and displays answers. If an answer, such as a list or matrix,is too long to display entirely on one line, anellipsis (...) is displayed to the right or left.Press ~ or | to display the rest of the answer.To display the MATH menu, press çMATH NUM CPX PRB1: Frac Displays answer as a fraction2: Dec Displays answer as a decimal3: 3 Calculates cube4: 3 √ ( Calculates cube root5: x √ Calculates xth root6: fMin( Finds minimum of a function7: fMax( Finds maximum of a function8: nDeriv( Computes numeric derivative9: fnInt( Computes integral of a function0: Solver... Displays equation solverTo display the MATH NUM menu, press ç ~MATH NUM CPX PRB1: abs( Computes absolute value2: round( Rounds value to specified decimal place3: iPart( Calculates integer part4: fPart( Calculates fractional part5: int( Finds greatest integer less than or equal to number6: min( Finds minimum value7: max( Finds maximum value8: lcm( Calculates least common multiple9: gcd( Calculates greatest common divisorTo display the MATH PRB menu, press ç |MATH NUM CPX PRB1: rand Generates random number between 0 and 12: nPr Computes number of permutations3: nCr Computes number of combinations4: ! Calculates factorial5: randInt( Generates random integer in specified range6: randNorm( Generates random # from Normal distribution7: randBin( Generates random # from Binomial distributionDefining or Editing a Function for GraphingTo Define or Edit a Function1 Press o to display the Y= editor.2 Press Ü to move the cursor to thefunction you want to define or edit.To erase a function, press ë.3 Enter or edit an expression to definethe function.Displaying a New GraphTo display a graph of the selected function,press s. TRACE, ZOOM, and CALCoperations display the graph automatically.As the graph is plotted, the busy indicator ison, and the X and Y values are updated.Free-Moving CursorWhen you first display the graph, no cursor is visible. You must press|~}or Ü for the cursor to move from the center of the viewingwindow. Continue pressing | ~}or Ü to move the cursor around.Tracing a FunctionUse the TRACE operation to move the cursor from one plotted pointto the next along a function. To begin, press r. The TRACE cursoris on the first selected function in the Y= editor, centered horizontallyon the screen. The cursor coordinates are displayed at the bottom ofthe screen if CoordOn format is selected. The Y= expression is displayedin the top left corner of the screen if ExprOn format is selected.Moving the TRACE CursorTo move the TRACE cursorDo this:To the previous or next plotted point Press | or ~Five plotted points on a function Press y | or y ~(Xres affects this)To any valid X value on a function Enter a value & press ÕFrom one function to anotherPress } or ÜTo alter the viewing area of the graph, press qZOOM MEMORY1: ZBox Draws a box to define the viewing window2: Zoom In Magnifies the graph around the cursor3: Zoom Out Views more of a graph around the cursor4: ZDecimal Sets X and Y to 0.15: ZSquare Sets equal-size pixels on the X and Y axes6: ZStandard Sets the standard window variables7: ZTrig Sets the built-in trig window variables8: ZInteger Sets integer values on the X and Y axes9: ZoomStat Sets the values for current stat plots0: ZoomFit Fits Ymin and Ymax between Xmin and XmaxTo display the CALCULATE menu, press y /CALCULATE1: value Calculates a function Y value for a given X2: zero Finds a zero (x-intercept) of a function3: minimum Finds a minimum of a function4: maximum Finds a maximum of a function5: intersect Finds an intersection of two functions6: dy/dx Finds a numeric derivative of a function7: ∫f(x)dx Finds a numeric integral of a functionTo return to the Home Screen from any other screen, press y 5.© Texas Instruments, 2007education.ti.com