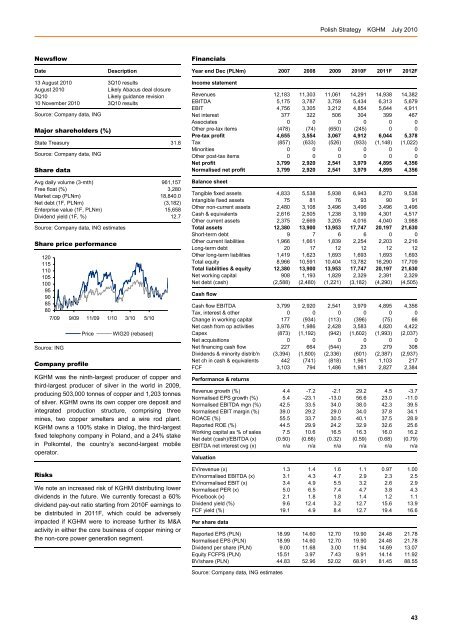
<strong>Polish</strong> <strong>Strategy</strong> KGHM July 2010NewsflowDateDescriptionFinancialsYear end Dec (PLNm) 2007 2008 2009 2010F 2011F 2012F13 August 2010 3Q10 resultsAugust 2010Likely Abacus deal closure3Q10Likely guidance revision10 November 2010 3Q10 resultsSource: Company data, INGMajor shareholders (%)State Treasury 31.8Source: Company data, INGShare dataAvg daily volume (3-mth) 961,157Free float (%) 3,280Market cap (PLNm) 18,840.0Net debt (1F, PLNm) (3,182)Enterprise value (1F, PLNm) 15,658Dividend yield (1F, %) 12.7Source: Company data, ING estimatesShare price performance12011511010510095908580Source: ING7/09 9/09 11/09 1/10 3/10 5/10PriceCompany profileWIG20 (rebased)KGHM was the ninth-largest producer of copper andthird-largest producer of silver in the world in 2009,producing 503,000 tonnes of copper and 1,203 tonnesof silver. KGHM owns its own copper ore deposit andintegrated production structure, comprising threemines, two copper smelters and a wire rod plant.KGHM owns a 100% stake in Dialog, the third-largestfixed telephony company in Poland, and a 24% stakein Polkomtel, the country’s second-largest mobileoperator.RisksWe note an increased risk of KGHM distributing lowerdividends in the future. We currently forecast a 60%dividend pay-out ratio starting from 2010F earnings tobe distributed in 2011F, which could be adverselyimpacted if KGHM were to increase further its M&Aactivity in either the core business of copper mining orthe non-core power generation segment.Income statementRevenues 12,183 11,303 11,061 14,291 14,938 14,382EBITDA 5,175 3,787 3,759 5,434 6,313 5,679EBIT 4,756 3,305 3,212 4,854 5,644 4,911Net interest 377 322 506 304 399 467Associates 0 0 0 0 0 0Other pre-tax items (478) (74) (650) (245) 0 0Pre-tax profit 4,655 3,554 3,067 4,912 6,044 5,378Tax (857) (633) (526) (933) (1,148) (1,022)Minorities 0 0 0 0 0 0Other post-tax items 0 0 0 0 0 0Net profit 3,799 2,920 2,541 3,979 4,895 4,356Normalised net profit 3,799 2,920 2,541 3,979 4,895 4,356Balance sheetTangible fixed assets 4,833 5,538 5,938 6,943 8,270 9,538Intangible fixed assets 75 81 76 93 90 91Other non-current assets 2,480 3,108 3,496 3,496 3,496 3,496Cash & equivalents 2,616 2,505 1,238 3,199 4,301 4,517Other current assets 2,375 2,669 3,205 4,016 4,040 3,988Total assets 12,380 13,900 13,953 17,747 20,197 21,630Short-term debt 9 7 6 6 0 0Other current liabilities 1,966 1,661 1,839 2,254 2,203 2,216Long-term debt 20 17 12 12 12 12Other long-term liabilities 1,419 1,623 1,693 1,693 1,693 1,693Total equity 8,966 10,591 10,404 13,782 16,290 17,709Total liabilities & equity 12,380 13,900 13,953 17,747 20,197 21,630Net working capital 908 1,193 1,829 2,329 2,391 2,329Net debt (cash) (2,588) (2,480) (1,221) (3,182) (4,290) (4,505)Cash flowCash flow EBITDA 3,799 2,920 2,541 3,979 4,895 4,356Tax, interest & other 0 0 0 0 0 0Change in working capital 177 (934) (113) (396) (75) 66Net cash from op activities 3,976 1,986 2,428 3,583 4,820 4,422Capex (873) (1,192) (942) (1,602) (1,993) (2,037)Net acquisitions 0 0 0 0 0 0Net financing cash flow 227 664 (544) 23 279 308Dividends & minority distrib'n (3,394) (1,800) (2,336) (601) (2,387) (2,937)Net ch in cash & equivalents 442 (741) (818) 1,961 1,103 217FCF 3,103 794 1,486 1,981 2,827 2,384Performance & returnsRevenue growth (%) 4.4 -7.2 -2.1 29.2 4.5 -3.7Normalised EPS growth (%) 5.4 -23.1 -13.0 56.6 23.0 -11.0Normalised EBITDA mgn (%) 42.5 33.5 34.0 38.0 42.3 39.5Normalised EBIT margin (%) 39.0 29.2 29.0 34.0 37.8 34.1ROACE (%) 55.5 33.7 30.5 40.1 37.5 28.9Reported ROE (%) 44.5 29.9 24.2 32.9 32.6 25.6Working capital as % of sales 7.5 10.6 16.5 16.3 16.0 16.2Net debt (cash)/EBITDA (x) (0.50) (0.66) (0.32) (0.59) (0.68) (0.79)EBITDA net interest cvg (x) n/a n/a n/a n/a n/a n/aValuationEV/revenue (x) 1.3 1.4 1.6 1.1 0.97 1.00EV/normalised EBITDA (x) 3.1 4.3 4.7 2.9 2.3 2.5EV/normalised EBIT (x) 3.4 4.9 5.5 3.2 2.6 2.9Normalised PER (x) 5.0 6.5 7.4 4.7 3.8 4.3Price/book (x) 2.1 1.8 1.8 1.4 1.2 1.1Dividend yield (%) 9.6 12.4 3.2 12.7 15.6 13.9FCF yield (%) 19.1 4.9 8.4 12.7 19.4 16.6Per share dataReported EPS (PLN) 18.99 14.60 12.70 19.90 24.48 21.78Normalised EPS (PLN) 18.99 14.60 12.70 19.90 24.48 21.78Dividend per share (PLN) 9.00 11.68 3.00 11.94 14.69 13.07Equity FCFPS (PLN) 15.51 3.97 7.43 9.91 14.14 11.92BV/share (PLN) 44.83 52.96 52.02 68.91 81.45 88.55Source: Company data, ING estimates43
<strong>Polish</strong> <strong>Strategy</strong> Mondi July 2010MondiToo expensive to be attractiveMaintainedSellPoland Market cap PLN3,700.0mBasic Resources Bloomberg MSC PWWe are bearish on Mondi as we believe that marketconsensus for 2010F earnings is too optimistic and thevaluation is demanding. Our 2010F EBITDA and net incomeforecasts are 22% and 37% lower than market expectations,respectively. Mondi trades at a 2010F and 2011F PER of30.6x and 16.3x, an excessive 132% and 61% premium toglobal peers. We maintain our SELL recommendation with atarget price of PLN52.6.Investment caseMondi is currently experiencing high wood prices (17% ofoperating costs), the main raw material used to producepackaging paper. Wood price hikes have been caused by thisyear’s change in sales policy by the main local wood supplier,State Forests (a state-owned holding that manages publiclyownedlocal forests). In the past, State Forests sold 80% of itswood production to long-standing customers (such as Mondi),usually offering price discounts for the placement of large orders.As a result, Mondi benefitted from low wood prices and modestlogistics costs. Mondi thus had significant cost advantages overits European competitors. Currently, just 50% of State Forests’wood is sold in closed tenders to long-standing clients. Theremaining 50% is sold in open tenders to the highest bidder. Ashorter supply of local wood has been accompanied by strongdemand for raw materials from the power sector as a result ofrising consumption for biofuels. Thus local wood prices havegrown by 30-40% YTD, approaching European price levels.The main upside potential for the company is the introduction ofan alteration of forest law proposed by the <strong>Polish</strong> government.According to the preliminary project of alteration, State Forestsmay be forced to sell wood ‘taking into consideration theinterests of the State Treasury and the needs of the local woodindustry’. In practice it would lead to an increase in wood salesby State Forests to large local industry players at the expense ofthe foreign wood industry and small local players. Thus it wouldput downside pressure on the price of wood purchased byMondi. The project of alteration is currently in consultation withinterested parties: State Forests and representatives of thedomestic wood industry. Given that it is still at an initial stage, wedo not include its implementation and a potential decrease inwood prices in our model in 2011F. Based on our sensitivityanalysis, a PLN10/m 3 decline in wood prices would increaseMondi’s EBIT by c.PLN22m.In our view, the market is underestimating the negative impact ofraw material pricing pressure on the company’s earnings in2010. We estimate 31% YoY and 89% YoY hikes in averagewood and recovered paper prices in 2010F, respectively. Weforecast a 2010F EBITDA margin of 16% versus marketexpectations of 22%.Price (19/07/10)Target price (12-mth)PLN74.0Previously PLN52.9PLN52.6Forecast total return -25.6%Quarterly previewWe expect an 11% QoQ increase in revenues, mainly driven byhikes in packaging paper prices (11% QoQ and 13% QoQgrowths in Kraftliner and Testliner prices, respectively). Weforecast improvement in gross margin from 23% in 1Q10 to 24%in 2Q10F mainly on widening spread between CCM paper andrecovered paper prices. 2Q10F average spread betweenTestliner and OCC recovered paper price reached €276/tonne vs€258/tonne in 1Q10. Net profitability should be burdened byPLN12m interest costs.2Q10F results preview (due 11 August)(PLNm) 1Q10 2Q10FRevenues 474 526EBITDA 69 84EBIT 31 46Net profit 18 34EPS (PLN) 0.36 0.68Source: Company data, ING estimatesEarnings drivers and outlookFor 2010F, we forecast 20-30% YoY growth in averagepackaging paper prices, driven by a cyclical recovery in demandfor product. Given strong YoY growth rates for average CCMpaper prices in 2010F, we forecast an improvement in Mondi’sEBIT margin to 9%, from 7% in 2009 and the historical annualaverage of 17%. For 2011F, we assume a YoY rebound in EBITprofitability to 14%, driven mainly by a drop in recovered paperprices (we forecast a 30% YoY decline).Mondi trades at a 2010F PER of 30.6x and EV/EBITDA of 12.9x,which implies excessive 132% and 104% premiums to peers,respectively. Despite Mondi’s cost advantages (low payroll costs)we believe this premium is, to a large extent unwarranted, givenits large exposure to high wood prices. In 2011F, Mondi trades ata lower PER of 16.3x due to a YoY improvement in earningsdriven by an expected decline in recovered paper prices (30%YoY drop). However, we believe that the stock is still expensive,as it trades at a 61% premium to peers.Given Mondi’s rich valuations we maintain our SELLrecommendation with a target price of PLN52.6, the outcome ofDCF and peer comparison valuations, to which we apply equalweighting.Upside potential includes a stronger-than-expected easing inrecovered paper prices in 2H10 and PLN depreciation againstthe euro.Adam Milewicz Warsaw +48 22 820 5031 adam.milewicz@pl.ing.com44