Polish Strategy - PBG SA
Polish Strategy - PBG SA
Polish Strategy - PBG SA

You also want an ePaper? Increase the reach of your titles
YUMPU automatically turns print PDFs into web optimized ePapers that Google loves.
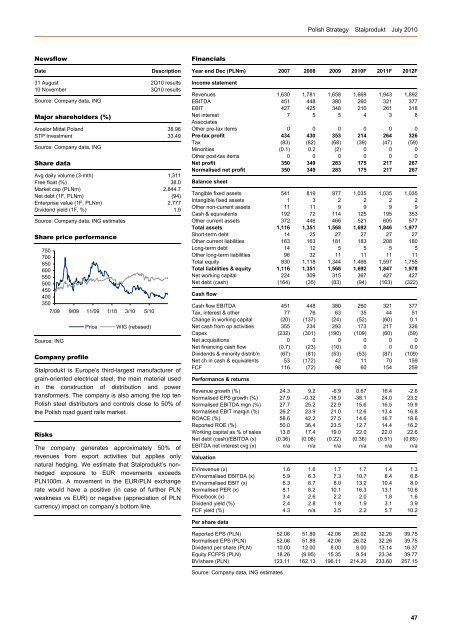
<strong>Polish</strong> <strong>Strategy</strong> Stalprodukt July 2010NewsflowDateDescriptionFinancialsYear end Dec (PLNm) 2007 2008 2009 2010F 2011F 2012F31 August 2Q10 results10 November 3Q10 resultsSource: Company data, INGMajor shareholders (%)Arcelor Mittal Poland 38.96STP Investment 33.49Source: Company data, INGShare dataAvg daily volume (3-mth) 1,311Free float (%) 38.0Market cap (PLNm) 2,844.7Net debt (1F, PLNm) (94)Enterprise value (1F, PLNm) 2,777Dividend yield (1F, %) 1.9Source: Company data, ING estimatesShare price performance750700650600550500450400350Source: ING7/09 9/09 11/09 1/10 3/10 5/10Company profilePriceWIG (rebased)Stalprodukt is Europe’s third-largest manufacturer ofgrain-oriented electrical steel, the main material usedin the construction of distribution and powertransformers. The company is also among the top ten<strong>Polish</strong> steel distributors and controls close to 50% ofthe <strong>Polish</strong> road guard rails market.RisksThe company generates approximately 50% ofrevenues from export activities but applies onlynatural hedging. We estimate that Stalprodukt’s nonhedgedexposure to EUR movements exceedsPLN100m. A movement in the EUR/PLN exchangerate would have a positive (in case of further PLNweakness vs EUR) or negative (appreciation of PLNcurrency) impact on company’s bottom line.Income statementRevenues 1,630 1,781 1,658 1,669 1,943 1,892EBITDA 451 448 380 260 321 377EBIT 427 425 348 210 261 318Net interest 7 5 5 4 3 8AssociatesOther pre-tax items 0 0 0 0 0 0Pre-tax profit 434 430 353 214 264 326Tax (83) (82) (68) (39) (47) (59)Minorities (0.1) 0.2 (2) 0 0 0Other post-tax items 0 0 0 0 0 0Net profit 350 349 283 175 217 267Normalised net profit 350 349 283 175 217 267Balance sheetTangible fixed assets 541 819 977 1,035 1,035 1,035Intangible fixed assets 1 3 2 2 2 2Other non-current assets 11 11 9 9 9 9Cash & equivalents 192 72 114 125 195 353Other current assets 372 446 466 521 605 577Total assets 1,116 1,351 1,568 1,692 1,846 1,977Short-term debt 14 25 27 27 27 27Other current liabilities 163 163 181 183 208 180Long-term debt 14 12 5 5 5 5Other long-term liabilities 96 32 11 11 11 11Total equity 830 1,118 1,344 1,466 1,597 1,755Total liabilities & equity 1,116 1,351 1,568 1,692 1,847 1,978Net working capital 224 309 315 367 427 427Net debt (cash) (164) (35) (83) (94) (163) (322)Cash flowCash flow EBITDA 451 448 380 260 321 377Tax, interest & other 77 76 63 35 44 51Change in working capital (20) (137) (24) (52) (60) 0.1Net cash from op activities 355 234 293 173 217 326Capex (232) (301) (190) (109) (60) (59)Net acquisitions 0 0 0 0 0 0Net financing cash flow (0.7) (23) (10) 0 0 0.0Dividends & minority distrib'n (67) (81) (53) (53) (87) (109)Net ch in cash & equivalents 53 (172) 42 11 70 159FCF 116 (72) 98 60 154 259Performance & returnsRevenue growth (%) 24.3 9.2 -6.9 0.67 16.4 -2.6Normalised EPS growth (%) 27.9 -0.32 -18.9 -38.1 24.0 23.2Normalised EBITDA mgn (%) 27.7 25.2 22.9 15.6 16.5 19.9Normalised EBIT margin (%) 26.2 23.9 21.0 12.6 13.4 16.8ROACE (%) 58.6 42.2 27.5 14.6 16.7 18.6Reported ROE (%) 50.0 36.4 23.5 12.7 14.4 16.2Working capital as % of sales 13.8 17.4 19.0 22.0 22.0 22.6Net debt (cash)/EBITDA (x) (0.36) (0.08) (0.22) (0.36) (0.51) (0.85)EBITDA net interest cvg (x) n/a n/a n/a n/a n/a n/aValuationEV/revenue (x) 1.6 1.6 1.7 1.7 1.4 1.3EV/normalised EBITDA (x) 5.9 6.3 7.3 10.7 8.4 6.8EV/normalised EBIT (x) 6.3 6.7 8.0 13.2 10.4 8.0Normalised PER (x) 8.1 8.2 10.1 16.3 13.1 10.6Price/book (x) 3.4 2.6 2.2 2.0 1.8 1.6Dividend yield (%) 2.4 2.8 1.9 1.9 3.1 3.9FCF yield (%) 4.3 n/a 3.5 2.2 5.7 10.2Per share dataReported EPS (PLN) 52.06 51.89 42.06 26.02 32.26 39.75Normalised EPS (PLN) 52.06 51.89 42.06 26.02 32.26 39.75Dividend per share (PLN) 10.00 12.00 8.00 8.00 13.14 16.37Equity FCFPS (PLN) 18.26 (9.95) 15.35 9.54 23.34 39.77BV/share (PLN) 123.11 162.13 196.11 214.20 233.60 257.15Source: Company data, ING estimates47