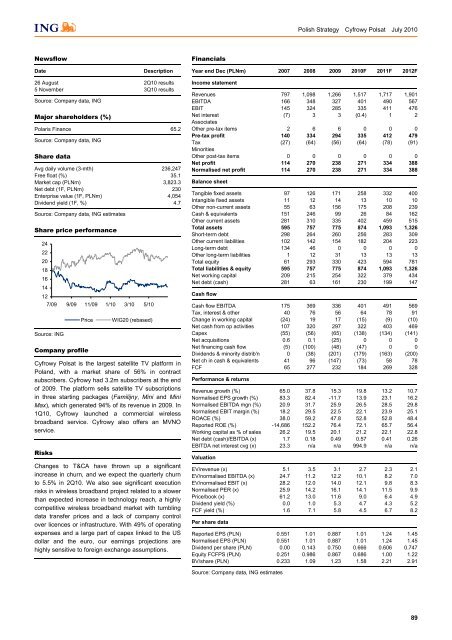
<strong>Polish</strong> <strong>Strategy</strong> Cyfrowy Polsat July 2010NewsflowDateDescriptionFinancialsYear end Dec (PLNm) 2007 2008 2009 2010F 2011F 2012F26 August 2Q10 results5 November 3Q10 resultsSource: Company data, INGMajor shareholders (%)Polaris Finance 65.2Source: Company data, INGShare dataAvg daily volume (3-mth) 236,247Free float (%) 35.1Market cap (PLNm) 3,823.3Net debt (1F, PLNm) 230Enterprise value (1F, PLNm) 4,054Dividend yield (1F, %) 4.7Source: Company data, ING estimatesShare price performance242220181614127/09 9/09 11/09 1/10 3/10 5/10Source: INGPriceCompany profileWIG20 (rebased)Cyfrowy Polsat is the largest satellite TV platform inPoland, with a market share of 56% in contractsubscribers. Cyfrowy had 3.2m subscribers at the endof 2009. The platform sells satellite TV subscriptionsin three starting packages (Familijny, Mini and MiniMax), which generated 94% of its revenue in 2009. In1Q10, Cyfrowy launched a commercial wirelessbroadband service. Cyfrowy also offers an MVNOservice.RisksChanges to T&CA have thrown up a significantincrease in churn, and we expect the quarterly churnto 5.5% in 2Q10. We also see significant executionrisks in wireless broadband project related to a slowerthan expected increase in technology reach, a highlycompetitive wireless broadband market with tumblingdata transfer prices and a lack of company controlover licences or infrastructure. With 49% of operatingexpenses and a large part of capex linked to the USdollar and the euro, our earnings projections arehighly sensitive to foreign exchange assumptions.Income statementRevenues 797 1,098 1,266 1,517 1,717 1,901EBITDA 166 348 327 401 490 567EBIT 145 324 285 335 411 476Net interest (7) 3 3 (0.4) 1 2AssociatesOther pre-tax items 2 6 6 0 0 0Pre-tax profit 140 334 294 335 412 479Tax (27) (64) (56) (64) (78) (91)MinoritiesOther post-tax items 0 0 0 0 0 0Net profit 114 270 238 271 334 388Normalised net profit 114 270 238 271 334 388Balance sheetTangible fixed assets 97 126 171 258 332 400Intangible fixed assets 11 12 14 13 10 10Other non-current assets 55 63 156 175 208 239Cash & equivalents 151 246 99 26 84 162Other current assets 281 310 335 402 459 515Total assets 595 757 775 874 1,093 1,326Short-term debt 298 264 260 256 283 309Other current liabilities 102 142 154 182 204 223Long-term debt 134 46 0 0 0 0Other long-term liabilities 1 12 31 13 13 13Total equity 61 293 330 423 594 781Total liabilities & equity 595 757 775 874 1,093 1,326Net working capital 209 215 254 322 379 434Net debt (cash) 281 63 161 230 199 147Cash flowCash flow EBITDA 175 369 336 401 491 569Tax, interest & other 40 76 56 64 78 91Change in working capital (24) 19 17 (15) (9) (10)Net cash from op activities 107 320 297 322 403 469Capex (55) (56) (65) (138) (134) (141)Net acquisitions 0.6 0.1 (25) 0 0 0Net financing cash flow (5) (100) (48) (47) 0 0Dividends & minority distrib'n 0 (38) (201) (179) (163) (200)Net ch in cash & equivalents 41 96 (147) (73) 58 78FCF 65 277 232 184 269 328Performance & returnsRevenue growth (%) 65.0 37.8 15.3 19.8 13.2 10.7Normalised EPS growth (%) 83.3 82.4 -11.7 13.9 23.1 16.2Normalised EBITDA mgn (%) 20.9 31.7 25.9 26.5 28.5 29.8Normalised EBIT margin (%) 18.2 29.5 22.5 22.1 23.9 25.1ROACE (%) 38.0 59.2 47.8 52.8 52.8 48.4Reported ROE (%) -14,686 152.2 76.4 72.1 65.7 56.4Working capital as % of sales 26.2 19.5 20.1 21.2 22.1 22.8Net debt (cash)/EBITDA (x) 1.7 0.18 0.49 0.57 0.41 0.26EBITDA net interest cvg (x) 23.3 n/a n/a 994.9 n/a n/aValuationEV/revenue (x) 5.1 3.5 3.1 2.7 2.3 2.1EV/normalised EBITDA (x) 24.7 11.2 12.2 10.1 8.2 7.0EV/normalised EBIT (x) 28.2 12.0 14.0 12.1 9.8 8.3Normalised PER (x) 25.9 14.2 16.1 14.1 11.5 9.9Price/book (x) 61.2 13.0 11.6 9.0 6.4 4.9Dividend yield (%) 0.0 1.0 5.3 4.7 4.3 5.2FCF yield (%) 1.6 7.1 5.8 4.5 6.7 8.2Per share dataReported EPS (PLN) 0.551 1.01 0.887 1.01 1.24 1.45Normalised EPS (PLN) 0.551 1.01 0.887 1.01 1.24 1.45Dividend per share (PLN) 0.00 0.143 0.750 0.666 0.606 0.747Equity FCFPS (PLN) 0.251 0.986 0.867 0.686 1.00 1.22BV/share (PLN) 0.233 1.09 1.23 1.58 2.21 2.91Source: Company data, ING estimates89
<strong>Polish</strong> <strong>Strategy</strong> TVN July 2010TVNLeveraged play on accelerated GDP growthMaintainedHoldPoland Market cap PLN5,606.6mMedia Bloomberg TVN PWWe increase our DCF-based target price for TVN to PLN18.0based on higher EBITDA estimates for 2010F and 2011F.With <strong>Polish</strong> GDP growth of 3.2% in 2010F and 3.9% in 2011F,TV advertising spend is likely to grow by 7% in 2010F and by10% in 2011F, supporting revenue growth in the company’sTV segment.Investment caseHistorically, GDP growth in excess of 3% has triggered muchstronger TV ad spend in Poland. This positive scenario shouldmaterialise once again. Management is cautiously optimisitic,indicating improving visibility of advertising booking, whichreached six weeks for the mainstream stations up from fourweeks at the beginning of the year. Advertisers’ budgets areunchanged or marginally higher for 2010F but we see morerobust ad spending in 2011F. We expect TV ad spend to grow by7% in 2010F and 10% in 2011F. As in the past, TVN should beable to capture market share as its channels maintain a superiorprofile of audiences and its sales team outperform thecompetition. Earnings growth will be additionally supported byimproving profitability of thematic channels that gradually gainsubscribers and advertisers.N increased its basic package prices by PLN6 in 2Q10, which wesee as an attempt to improve ARPU and profitability. Theplatform should be able to breakeven at the EBITDA level in2Q10 and 3Q10 but not in 4Q10 and not for the year yet. Thepaid TV market has been fairly quiet so far this year with playerspreparing compelling promotions for the critical last four monthsof the year. The key challenges for N remain churn andprogramming expenses management. Competition remainstough and N’s closest competitor, Cyfra+, is suffering from ahuge internal churn and very expensive promotions to the pointwhere it changed its CEO in 2Q10.We increase our DCF-based target price to PLN18 following anupward revision to earnings estimates in 2010F and 2011F. TheTVN story looks interesting going into 2H10 and 2011. The groupis in the sweet spot to grow operating profit and cash flow asincreasing advertising spend underpins revenue growth in theTV and internet segments. Programming costs are being kept incheck and we understand the group’s other costs are runningbelow budget for most divisions. Cash burn at N is still huge butthe platform is growing and should visibly narrow the EBITDAloss this year.TVN trades at an EV/EBITDA of 10.7x in 2010F and 8.2x in2011F. CME trades at a 2011F EV/EBITDA of 9.1x and themarket values CTC Media at a 2010F EV/EBITDA of 9.6x. Weargue that the real discount in TVN's valuation is likely to beeven higher. TVN's EV-based multiples are significantly inflatedby weak currency as 81% of TVN’s total debt of PLN2.6bn isdenominated in euro, and the PLN-value of company debt isartificially high at current exchange rates.Price (19/07/10)Target price (12-mth)PLN16.45Previously PLN16.0PLN18.0Forecast total return 11.0%Quarterly previewNational mourning in April reduced the company’s advertisingrevenue in its TV segment. The TVN channel was not able tocompensate fully for the April advertising break in May and June,despite extending the line-up of premiere formats until the end ofJune. We forecast 3% YoY revenue growth in the TV segmentwith an EBITDA margin of 50%, up from 49.4% in 2Q09.At N, we expect net subscriber additions of 20,000 to 744,000and ARPU of PLN61, which should generate revenue ofPLN145m, including PLN11m of revenue from pre-paid service,TNK. We expect N to report zero EBITDA in 2Q10. Investors willfocus on the implication of package price increases on expectedARPU and churn rates.The online segment enjoyed healthy growth rates as the internetadvertising market grew by 20% in 2Q10. We forecast a 20%increase in revenue for TVN's online division driven by displayadvertising as well as increased revenue of new ventures suchas sympatia.pl, zumi.pl and VOD service.An unrealised FX loss of PLN168m on euro bonds and an accruedtax charge of PLN14.0m will drive net earnings into a loss.2Q10 results preview(PLNm) 2Q09 2Q10FRevenues 580.0 647.3EBITDA 190.5 214.4EBIT 138.5 151.7Net profit 141.8 (92.9)Source: Company data, ING estimatesEarnings drivers and outlookWe increase our 2010F and 2011F EBITDA estimates by 2%and 5%, respectively, based on higher assumed EBITDAmargins in the TV segment which we now expect to reach 44%and 45%, respectively, up from 43% in 2009. The mainstreamchannel, TVN, continues to target a roughly unchangedprogramming budget for the mainstream station and theprogramming expenses of thematic channels (apart from TVN24)are also being kept in check. Prudent cost policies should resultin improved profitability in the TV segment once TV advertisingspend accelerates into high-single digits in 2H10 and 2011F.For N, we forecast 900,000 contract subscribers in 2010F and1.1m subscribers in 2011F. N should narrow its EBITDA loss toPLN30m in 2010F and we forecast EBTIDA profit of PLN38m in2011F. The platform is on track to turn free cash flow positive in2012.Andrzej Knigawka Warsaw +48 22 820 5015 andrzej.knigawka@pl.ing.com90


