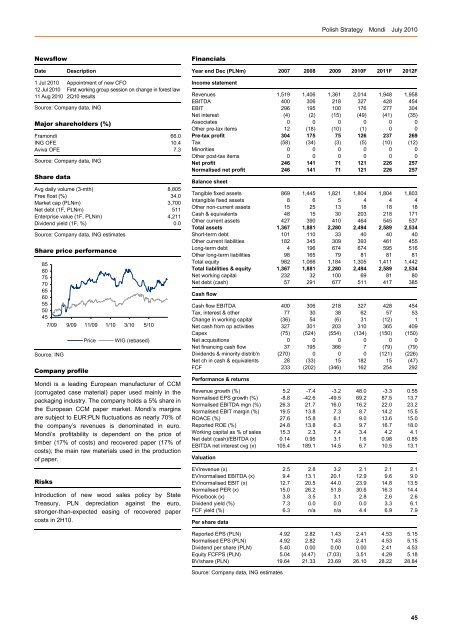
<strong>Polish</strong> <strong>Strategy</strong> Mondi July 2010NewsflowFinancialsDateDescriptionYear end Dec (PLNm) 2007 2008 2009 2010F 2011F 2012F1 Jul 2010 Appointment of new CFO12 Jul 2010 First working group session on change in forest law11 Aug 2010 2Q10 resultsSource: Company data, INGMajor shareholders (%)Framondi 66.0ING OFE 10.4Aviva OFE 7.3Source: Company data, INGShare dataAvg daily volume (3-mth) 8,805Free float (%) 34.0Market cap (PLNm) 3,700Net debt (1F, PLNm) 511Enterprise value (1F, PLNm) 4,211Dividend yield (1F, %) 0.0Source: Company data, ING estimatesShare price performance8580757065605550457/09 9/09 11/09 1/10 3/10 5/10Source: INGCompany profilePriceWIG (rebased)Mondi is a leading European manufacturer of CCM(corrugated case material) paper used mainly in thepackaging industry. The company holds a 5% share inthe European CCM paper market. Mondi’s marginsare subject to EUR:PLN fluctuations as nearly 70% ofthe company’s revenues is denominated in euro.Mondi’s profitability is dependent on the price oftimber (17% of costs) and recovered paper (17% ofcosts); the main raw materials used in the productionof paper.RisksIntroduction of new wood sales policy by StateTreasury, PLN depreciation against the euro,stronger-than-expected easing of recovered papercosts in 2H10.Income statementRevenues 1,519 1,406 1,361 2,014 1,948 1,958EBITDA 400 306 218 327 428 454EBIT 296 195 100 176 277 304Net interest (4) (2) (15) (49) (41) (35)Associates 0 0 0 0 0 0Other pre-tax items 12 (18) (10) (1) 0 0Pre-tax profit 304 175 75 126 237 269Tax (58) (34) (3) (5) (10) (12)Minorities 0 0 0 0 0 0Other post-tax items 0 0 0 0 0 0Net profit 246 141 71 121 226 257Normalised net profit 246 141 71 121 226 257Balance sheetTangible fixed assets 869 1,445 1,821 1,804 1,804 1,803Intangible fixed assets 8 6 5 4 4 4Other non-current assets 15 25 13 18 18 18Cash & equivalents 48 15 30 203 218 171Other current assets 427 390 410 464 545 537Total assets 1,367 1,881 2,280 2,494 2,589 2,534Short-term debt 101 110 33 40 40 40Other current liabilities 182 345 309 393 461 455Long-term debt 4 196 674 674 595 516Other long-term liabilities 98 165 79 81 81 81Total equity 982 1,066 1,184 1,305 1,411 1,442Total liabilities & equity 1,367 1,881 2,280 2,494 2,589 2,534Net working capital 232 32 100 69 81 80Net debt (cash) 57 291 677 511 417 385Cash flowCash flow EBITDA 400 306 218 327 428 454Tax, interest & other 77 30 38 62 57 53Change in working capital (36) 54 (6) 31 (12) 1Net cash from op activities 327 301 203 310 365 409Capex (75) (524) (554) (134) (150) (150)Net acquisitions 0 0 0 0 0 0Net financing cash flow 37 195 366 7 (79) (79)Dividends & minority distrib'n (270) 0 0 0 (121) (226)Net ch in cash & equivalents 28 (33) 15 182 15 (47)FCF 233 (202) (346) 162 254 292Performance & returnsRevenue growth (%) 5.2 -7.4 -3.2 48.0 -3.3 0.55Normalised EPS growth (%) -8.8 -42.6 -49.5 69.2 87.5 13.7Normalised EBITDA mgn (%) 26.3 21.7 16.0 16.2 22.0 23.2Normalised EBIT margin (%) 19.5 13.8 7.3 8.7 14.2 15.5ROACE (%) 27.6 15.8 6.1 9.0 13.6 15.0Reported ROE (%) 24.8 13.8 6.3 9.7 16.7 18.0Working capital as % of sales 15.3 2.3 7.4 3.4 4.2 4.1Net debt (cash)/EBITDA (x) 0.14 0.95 3.1 1.6 0.98 0.85EBITDA net interest cvg (x) 105.4 189.1 14.5 6.7 10.5 13.1ValuationEV/revenue (x) 2.5 2.8 3.2 2.1 2.1 2.1EV/normalised EBITDA (x) 9.4 13.1 20.1 12.9 9.6 9.0EV/normalised EBIT (x) 12.7 20.5 44.0 23.9 14.8 13.5Normalised PER (x) 15.0 26.2 51.8 30.6 16.3 14.4Price/book (x) 3.8 3.5 3.1 2.8 2.6 2.6Dividend yield (%) 7.3 0.0 0.0 0.0 3.3 6.1FCF yield (%) 6.3 n/a n/a 4.4 6.9 7.9Per share dataReported EPS (PLN) 4.92 2.82 1.43 2.41 4.53 5.15Normalised EPS (PLN) 4.92 2.82 1.43 2.41 4.53 5.15Dividend per share (PLN) 5.40 0.00 0.00 0.00 2.41 4.53Equity FCFPS (PLN) 5.04 (4.47) (7.03) 3.51 4.29 5.18BV/share (PLN) 19.64 21.33 23.69 26.10 28.22 28.84Source: Company data, ING estimates45
<strong>Polish</strong> <strong>Strategy</strong> Stalprodukt July 2010StalproduktDelayed reboundPreviously: SellHoldPoland Market cap PLN2,844.7mBasic Resources Bloomberg STP PWAlthough prices of Stalprodukt’s main product transformersteel have stabilised in 3Q10, we believe the company is notin a position to pass on higher raw material prices to endcustomers. Unless prices rebound beginning from 4Q10,resulting in improving profitability, we believe Stalproduktwill not be a convincing growth story in 2011. HOLD.Investment caseStalprodukt is facing a challenging 2010 with an expected 39%YoY decline in EPS, primarily related to declining transformersteel prices, which as of end-1H10 dropped 44% from its peak in2008 but has finally stabilised at the beginning of 3Q10. A pickupin prices is likely beginning from 4Q10 and the extent ofincreases will determine EPS growth in 2011. We currently see2011F EPS growing 25% YoY.Transformer steel segment: The core segment of activity with a41% share of 2009 revenues and 84% share of last year's grossprofit. After a 20% decline in 2H09 prices decreased by another20% in 1H10. The CEO expects a stabilisation at levels slightlyabove EUR1,700 per tonne in 3Q10. Still, pressure on profitmargins continues to be immense as transformer manufacturersare not willing to accept price hikes. In our view, the company isjust not in a position to pass higher raw material costs to itscustomers, which should result in declining profitability QoQ in3Q10. We forecast a 32% gross margin in 3Q10 compared with36% in 1Q10 and 52% reported in 2Q09. A positive developmentsupporting the stabilisation theory is improving sales volumes,which increased by 37% YoY in 2Q10F. In all of 2010Stalprodukt expects 80,000 tons of volume sales (compared with62,000 reported in 2009) and hopes for at least 10,000 tons YoYhigher volume sales in 2011. Our forecasts are broadly in linewith management assumptions and we see 81,000 tons and90,000 tons of sales volumes in 2010F and 2011F, respectively.Steel profiles: Following difficult market conditions in 2009 (4%YoY decline in volume sales in 2009) demand improvedbeginning from 2010. As a result, we expect sales volumegrowth to approach 30% YoY in 1H10, impressive despite thelow base in 1H09. According to Stalprodukt, it is difficult toprovide an outlook for 2H10 given macroeconomic uncertaintiesbut the company hopes for at least double-digit growth rates YoYin 2010 vs the 210,000 sales volumes in 2009.Following the inability to pass on higher raw material prices tocustomers in 3Q10, we lower our 2010 and 2011 EPS estimatesby 6% and 10% to PLN175m and PLN218m, respectively.Based on our current forecasts Stalprodukt trades at 2011F and2012F EV/EBITDA of 8.4x and 6.8x, respectively, a 46% and 24%premium to peers. Our 12-month TP is based on DCF and peers’valuation with an 80% and 20% share applied to the methods.Price (19/07/10)Target price (12-mth)PLN423.00Previously PLN393.00PLN406.99Forecast total return -1.9%2Q10 previewRevenues are likely to be solely driven by steel profiles(PLN231m in 2Q10 compared with PLN173m in 2Q09) while thetransformer steel segment shold see a contraction in the top lineYoY following an over 30% YoY decline in price levels, which willnot be offset by the strong 5,000 ton increase in volume sales.We forecast a deterioration of profit margins (EBIT margin at14.6% vs 22.8% reported in 2Q09) primarily due to a sharp dropof transformer steel price levels but also an unfavourableEUR/PLN exchange rate (4.00 vs 4.44 in 2Q09).2Q10F results preview (31 August)(PLNm) 2Q09 2Q10FRevenues 411.0 431.8EBITDA 103.1 73.5EBIT 93.7 63.0Net profit 75.0 52.0EPS 11.2 7.7Source: Company data, ING estimatesEarnings drivers and outlookPrice pressure on transformer steel products will negatively affectStalprodukt’s profit margins in 2010F. We currently forecast a15.6% EBIT margin in 2010F versus 22.9% reported in 2009,primarily due to a transformer steel gross margin decrease, whichshould drive margins down to 31% versus 53% reported in 2009.In 2011F revenues should increase by 16% YoY to PLN1.9bn,driven by a recovery of transformer steel prices. We believe thecompany will be in a position to raise transformer steel prices by12.2% YoY. Also, volumes should improve to 90,000 tons sold in2011F vs 80,000 in 2010F. In steel profiles we raise our volumesales forecasts by 20,000 tons to 260,000 tons.Following price increases we believe profitability will improvemoderately in 2011F with EBIT/net profit margin growing to16.5% and 11.2%, respectively. Both transformer steel and steelprofiles segments should see stronger gross margins in 2011F at33% and 8%, respectively.The main earnings and share price driver will be price levels oftransformer steels. If Stalprodukt is in a position to increaseprices beginning from 4Q10 the impact on results would beimpressive as the company has a high operating leverage. Anincrease by EUR200 per tonne increases net profit by PLN56m.Tomasz Czyz Warsaw +48 22 820 5046 tomasz.czyz@pl.ing.com46


