

weekly weather and crop bulletin - The World AgroMeteorological ...
weekly weather and crop bulletin - The World AgroMeteorological ...
weekly weather and crop bulletin - The World AgroMeteorological ...

You also want an ePaper? Increase the reach of your titles
YUMPU automatically turns print PDFs into web optimized ePapers that Google loves.
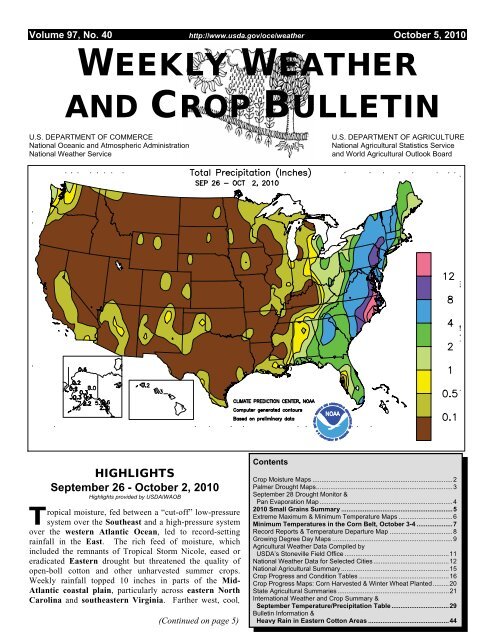
Volume 97, No. 40 http://www.usda.gov/oce/<strong>weather</strong> October 5, 2010WEEKLY WEATHERAND CROP BULLETINU.S. DEPARTMENT OF COMMERCENational Oceanic <strong>and</strong> Atmospheric AdministrationNational Weather ServiceU.S. DEPARTMENT OF AGRICULTURENational Agricultural Statistics Service<strong>and</strong> <strong>World</strong> Agricultural Outlook BoardTHIGHLIGHTSSeptember 26 - October 2, 2010Highlights provided by USDA/WAOBropical moisture, fed between a “cut-off” low-pressuresystem over the Southeast <strong>and</strong> a high-pressure systemover the western Atlantic Ocean, led to record-settingrainfall in the East. <strong>The</strong> rich feed of moisture, whichincluded the remnants of Tropical Storm Nicole, eased oreradicated Eastern drought but threatened the quality ofopen-boll cotton <strong>and</strong> other unharvested summer <strong>crop</strong>s.Weekly rainfall topped 10 inches in parts of the Mid-Atlantic coastal plain, particularly across eastern NorthCarolina <strong>and</strong> southeastern Virginia. Farther west, cool,(Continued on page 5)ContentsCrop Moisture Maps .............................................................................. 2Palmer Drought Maps ............................................................................ 3September 28 Drought Monitor &Pan Evaporation Map .......................................................................... 42010 Small Grains Summary .............................................................. 5Extreme Maximum & Minimum Temperature Maps .............................. 6Minimum Temperatures in the Corn Belt, October 3-4 .................... 7Record Reports & Temperature Departure Map ................................... 8Growing Degree Day Maps ................................................................... 9Agricultural Weather Data Compiled byUSDA’s Stoneville Field Office .......................................................... 11National Weather Data for Selected Cities .......................................... 12National Agricultural Summary ............................................................ 15Crop Progress <strong>and</strong> Condition Tables .................................................. 16Crop Progress Maps: Corn Harvested & Winter Wheat Planted ......... 20State Agricultural Summaries .............................................................. 21International Weather <strong>and</strong> Crop Summary &September Temperature/Precipitation Table ................................ 29Bulletin Information &Heavy Rain in Eastern Cotton Areas .............................................44
2 Weekly Weather <strong>and</strong> Crop Bulletin October 5, 2010
October 5, 2010 Weekly Weather <strong>and</strong> Crop Bulletin 3
4 Weekly Weather <strong>and</strong> Crop Bulletin October 5, 2010U.S. Drought MonitorSeptember 28, 2010Valid 8 a.m. EDTHHAHAHHAHAAHHAAAHAAAHAAHAHAHIntensity:D0 Abnormally DryD1 Drought - ModerateD2 Drought - SevereD3 Drought - ExtremeD4 Drought - ExceptionalDrought Impact Types:Delineates dominant impactsA = Agricultural (<strong>crop</strong>s, pastures,grassl<strong>and</strong>s)H = Hydrological (water)A<strong>The</strong> Drought Monitor focuses on broad-scale conditions.Local conditions may vary. See accompanying text summaryfor forecast statements.http://drought.unl.edu/dmReleased Thursday, September 30, 2010Author: Richard Heim/Liz Love-Brotak, NOAA/NESDIS/NCDC0.05Average Pan Evaporation (inches/day)September 26 - October 2, 20100.180.130.200.140.20 0.190.150.170.150.170.090.220.110.250.020.230.290.140.290.330.180.23 0.230.27Based on preliminary data0.110.140.470.200.090.300.400.080.200.140.100.190.160.140.270.100.18 0.340.150.17 0.100.44 0.350.160.080.210.120.250.320.180.240.280.140.130.21 0.19 0.150.230.33 0.31 0.20 0.160.170.380.230.290.190.090.27 0.320.230.130.220.020.310.170.060.160.090.120.130.100.200.330.190.23 0.190.080.250.310.110.30 0.210.220.21 0.230.28 0.250.24 0.16 0.200.320.250.220.25 0.160.390.220.530.260.280.190.190.23 0.42 0.640.19 0.210.200.920.280.240.250.240.240.25 0.170.250.200.120.280.20NOAA/USDA JOINT AGRICULTURAL WEATHER FACILITYData obtained from the NWS Cooperative Observer Network.Last Chart of Season
October 5, 2010 Weekly Weather <strong>and</strong> Crop Bulletin 5(Continued from front cover)dry air settled across the Corn Belt <strong>and</strong> much of the South. In fact,late-week freezes ended the growing season on October 2-3,roughly on schedule, across much of the upper Midwest. Corn <strong>and</strong>soybeans were largely mature in the freeze-affected area,minimizing the impact of the cold snap. Previously floodedsections of the upper Midwest experienced an extended period offavorably dry <strong>weather</strong>, allowing fieldwork to gradually resume.Meanwhile on the Plains, dry <strong>weather</strong> promoted summer <strong>crop</strong>maturation <strong>and</strong> harvesting, <strong>and</strong> winter wheat planting <strong>and</strong>emergence. However, pockets of dryness on the central <strong>and</strong>southern Plains raised concerns with respect to winter wheatestablishment. Elsewhere, mostly dry <strong>weather</strong> <strong>and</strong> record-settingwarmth prevailed in the West. On September 27, all-time-recordhighs were established at a few locations in southern California,including downtown Los Angeles. <strong>The</strong> warmth favored fieldwork,including winter wheat planting in the Northwest, rice harvestingin California, <strong>and</strong> cotton harvesting in Arizona.Record-setting warmth prevailed for the entire week in the West.In Nevada, Ely posted eight consecutive daily-record highs fromSeptember 25 - October 2, including a maximum of 91 o F onSeptember 28. Prior to this year, Ely had never reached orexceeded 90 o F after September 17. Elsewhere in Nevada, Elkocollected six daily-record highs in a row from September 27 -October 2. On October 1, Nevada locations such as Winnemucca(94 o F), Elko (92 o F), <strong>and</strong> Ely (86 o F) tallied monthly record highs.Elko reached the 90-degree mark for the first time on record inOctober, surpassing the monthly st<strong>and</strong>ard of 89 o F set on October 8,1917. In Utah, Salt Lake City (89 o F on October 1) tied a monthlyst<strong>and</strong>ard first achieved on October 3, 1963. Farther south, Tucson,AZ (102 o F on October 1), tied a monthly record first established onOctober 3, 1993. <strong>The</strong> previous day, Tucson (104 o F on September30) had notched its 16 th day of triple-digit heat during the month,tying a September record first set in 1953. Meanwhile in southernCalifornia, a stunning, late-season heat wave peaked on September27 with all-time-record highs of 111 o F in Long Beach <strong>and</strong> 113 o F indowntown Los Angeles. Long Beach tied the record originally seton October 15, 1961, while Los Angeles eclipsed the former markof 112 o F established on June 26, 1990. Western daily-record highsin excess of 110 o F included 115 o F (on September 27) in DeathValley, CA; 111 o F (on September 26) in Yuma, AZ; <strong>and</strong> 111 o F (onSeptember 26) in Palm Springs, CA.Farther east, stations completing their driest September on recordincluded Rawlins, WY (a trace; previously, 0.10 inch in 1953 <strong>and</strong>1957); Alex<strong>and</strong>ria, LA (0.07 inch; previously, 0.20 inch in 1914),<strong>and</strong> Louisville, KY (0.12 inch; previously, 0.18 inch in 2004).Shreveport, LA, completed its warmest, driest August-Septemberperiod on record, with an average temperature of 84.8 o F(previously, 84.7 o F in 2005) <strong>and</strong> rainfall totaling 0.97 inch(previously, 1.11 inches in 1899). Meanwhile, Nicole existed as atropical storm for only a few hours on September 29 over Cuba <strong>and</strong>the Florida Straits before becoming entangled in a cold frontdraped along the U.S. East Coast. Copious tropical moisture <strong>and</strong>a significant frontal wave of low pressure preceded Nicole; thestorm’s remnant circulation finally reached the middle <strong>and</strong>northern Atlantic Coast States from late September 30 intoOctober 1. Earlier, heavy rain had developed across the Southeaston September 26, when Macon, GA (4.20 inches), netted a dailyrecordtotal. <strong>The</strong> following day, September 27, featured 10.33inches of rain in Wilmington, NC. It was Wilmington’s secondwettestday on record behind the Hurricane Floyd-induced total of13.38 inches on September 15, 1999. Floyd’s final total inWilmington was 19.06 inches from September 14-16, 1999.During the last 5 days of September, 22.54 inches of rain delugedWilmington. Numerous Mid-Atlantic locations posted consecutivedaily-record rainfall amounts on September 30 <strong>and</strong> October1, when 2-day totals reached 8.08 inches in Allentown, PA, <strong>and</strong>7.58 inches in Wilmington, DE. Binghamton, NY (4.24 inches onSeptember 30), experienced its wettest day on record, toppling the4.05-inch st<strong>and</strong>ard established on June 27, 2006. Schoharie Creekat Prattsville, NY, surged 5.38 feet above flood stage on October1—the highest level since April 3, 2005. In southeasternPennsylvania, Chester Creek near Chester climbed 9.54 feetabove flood stage on October 1—the highest level since September16, 1999. Baltimore, MD (6.02 inches on September 30), reportedits second-wettest day on record, behind only 7.62 inches on August23, 1933. Similarly, Norfolk, VA (7.85 inches on September 30),noted its second-wettest day behind only 8.93 inches on September1, 2006. In addition, Cape Hatteras, NC, clocked a peak wind gustto 60 mph on September 30. Elsewhere, rivers began to recede inthe upper Midwest. <strong>The</strong> Minnesota River at Henderson, MN,crested on September 28 at a record-high 8.08 feet above floodstage (previously, 7.65 feet on April 11, 1965).Very cool <strong>weather</strong> prevailed in Alaska, while showery conditionswere mostly confined to southern <strong>and</strong> western parts of the state.Near Fairbanks, Eielson Air Force Base (3 o F on September 28)posted a monthly record low, previously established with a readingof 5 o F on September 27, 1992. Bettles (0 o F on September 27 <strong>and</strong>28) tied a monthly record first set on September 23, 1992. OnSeptember 28, lows dipped to -5 o F in Chicken <strong>and</strong> Circle HotSprings. Meanwhile, southeastern Alaska completed an oddmonth that featured nearly 2 weeks of dry <strong>weather</strong> between early<strong>and</strong>late-September wetness. All of Juneau’s 6.24-inch monthlyrainfall occurred from September 1-9 <strong>and</strong> 23-30. Farther south,Hawaii’s drought situation remained virtually unchanged. On theBig Isl<strong>and</strong> at Hilo, the September rainfall of 2.75 inches (30percent of normal) left its year-to-date total at 37.05 inches (41percent). On Oahu, Honolulu netted a daily-record rainfall (0.21inch) for September 30, but had a January-September sum of just5.03 inches (46 percent of normal).U.S. Crop Production Highlights:2010 Small Grains Summary<strong>The</strong> following information was released by USDA’sAgricultural Statistics Board on September 30, 2010.All wheat production totaled 2.22 billion bushels in 2010, down2% from the August forecast but up slightly from 2009. Grain areais 47.7 million acres, down 4% from last year. Yield is a recordhigh46.7 bushels per acre, 2.3 bushels higher than last year <strong>and</strong> 1.8bushels higher than the previous record set in 2008. <strong>The</strong> levels ofproduction <strong>and</strong> changes from last year by type are: winter wheat,1.49 billion bushels, down 3%; other spring wheat, 627 millionbushels, up 7%; <strong>and</strong> Durum wheat, 111 million bushels, up 2%.Oat production is estimated at a record-low 81.9 million bushels,6% below the August forecast <strong>and</strong> down 12% from last year. Yieldis estimated at 64.6 bushels per acre, down 1.7 bushels from the lastforecast <strong>and</strong> down 2.9 bushels from the previous year. Comparedwith last year, yields decreased or stayed the same for most states,with the exception of Michigan, Texas, <strong>and</strong> several NorthwesternStates. Harvested area, at 1.27 million acres, is 4% below August<strong>and</strong> 8% below last year. This is the smallest acreage harvested forgrain on record, continuing a steady downward trend.Barley production is estimated at 182 million bushels, down 1%from the August 1 forecast <strong>and</strong> 20% below 2009. Average yield peracre, at 73.6 bushels, is up 1.3 bushels from August <strong>and</strong> up 0.6bushel from last year. This is the highest yield on record sinceestimates began in 1866. Producers seeded 2.87 million acres in2010, down 19% from last year to the lowest planted acreage onrecord. Harvested area, at 2.47 million acres, is down 3% from theAugust 1 forecast <strong>and</strong> down 21% from 2009, to the lowest levelsince 1882.
6 Weekly Weather <strong>and</strong> Crop Bulletin October 5, 2010
October 5, 2010 Weekly Weather <strong>and</strong> Crop Bulletin 7Minimum Temperatures in the Corn BeltOctober 3, 201071%67%79%63%90%69%78%91%97%94% 85%55%93%90%99%96% 100%LEGEND= Major Growing Area= Minor Growing AreaAgricultural Weather Assessments<strong>World</strong> Agricultural Outlook BoardXX = Minimum Temperature(Source: NOAA)XX%= Percent Crop Mature(Source: NASS) as of Sep 26, 2010Minimum Temperatures in the Corn BeltOctober 4, 201071%67%79%63%90%69%78%91%97%94% 85%55%93%90%99%96% 100%LEGEND= Major Growing Area= Minor Growing AreaAgricultural Weather Assessments<strong>World</strong> Agricultural Outlook BoardXX = Minimum Temperature(Source: NOAA)XX%= Percent Crop Mature(Source: NASS) as of Sep 26, 2010On October 3-4, widespread frost <strong>and</strong> scattered freezes in the Corn Belt had little effecton summer <strong>crop</strong>s that were already mature or nearly so. For locations that reportedtemperatures of 32 o F or below, the season’s first freeze was roughly on schedule in thenorthern Corn Belt <strong>and</strong> several days earlier than normal farther south.
8 Weekly Weather <strong>and</strong> Crop Bulletin October 5, 2010Daily Weather Records (ASOS & COOP)September 26-October 2, 2010ÔÕ"ÔÕ "ÔÕÔÕ"ÔÕÔÕ ÔÕ" ""ÔÕ"""" """"" " "ÔÕ"" ""ÔÕ"ÔÕÔÕ """"" " " """ " """""X""" "" " """ " ""ÔÕÔÕ "ÔÕÔÕÔÕ""""""ÔÕ" "ÔÕÔÕ ÔÕ ÔÕ ÔÕ ÔÕÔÕÔÕ ÔÕÔÕ""""" "" " "ÔÕ ÔÕ"""""""" """ "ÔÕ""" """ÔÕ ÔÕÔÕ ÔÕÔÕ ÔÕÔÕÔÕ "ÔÕÔÕÔÕÔÕ ÔÕÔÕÔÕÔÕÔÕ ÔÕÔÕ""ÔÕ ÔÕ"""" " ""ÔÕÔÕ"""""" "ÔÕÔÕÔÕ""" """"" """ÔÕ"""ÔÕÔÕÔÕ" "" ""ÔÕ ÔÕ"""" "" "" """"""" """" "ÔÕ ÔÕ""" ""ÔÕ""""""" "" """""ÔÕ" ÔÕÔÕ""" """""""ÔÕÔÕÔÕ ÔÕÔÕ ÔÕÔÕ ÔÕ ÔÕÔÕÔÕÔÕÔÕ ÔÕ ÔÕ ÔÕ ÔÕÔÕÔÕÔÕÔÕ ÔÕ ÔÕÔÕÔÕÔÕ ÔÕÔÕ ÔÕ ÔÕ ÔÕÔÕÔÕ ÔÕÔÕÔÕÔÕÔÕÔÕÔÕÔÕ ÔÕÔÕ ÔÕÔÕÔÕ ÔÕ ÔÕÔÕÔÕÔÕ ÔÕ ÔÕÔÕÔÕ ÔÕÔÕÔÕÔÕÔÕ"" " """""" "" " """"" "ÔÕ""""""""""""" ""ÔÕÔÕÔÕÔÕÔÕÔÕÔÕ ÔÕÔÕÔÕ ÔÕ ÔÕÔÕ ÔÕÔÕÔÕ ÔÕ ÔÕ ÔÕÔÕÔÕ ÔÕ"""""" "ÔÕÔÕÔÕÔÕ ÔÕÔÕÔÕÔÕÔÕ""" """"""" """""ÔÕ" "ÔÕ ÔÕ ÔÕ"""" """""""ÔÕ""""""""""""""""" "" " "ÔÕ ÔÕÔÕÔÕ ÔÕÔÕÔÕÔÕÔÕ""""""" """ " """"" """" " "ÔÕ" " " "ÔÕ ÔÕ ÔÕ ÔÕ ÔÕÔÕ ÔÕ ÔÕ ÔÕÔÕ ÔÕÔÕÔÕÔÕÔÕ ÔÕÔÕÔÕ ÔÕÔÕÔÕ ÔÕÔÕÔÕ ÔÕ ÔÕÔÕÔÕÔÕ ÔÕÔÕÔÕÔÕÔÕÔÕÔÕÔÕ ÔÕÔÕ ÔÕ ÔÕ ÔÕ ÔÕÔÕ ÔÕ ÔÕÔÕÔÕÔÕÔÕ ÔÕ ÔÕ ÔÕ ÔÕÔÕÔÕ ÔÕÔÕÔÕÔÕ ÔÕ ÔÕ ÔÕÔÕÔÕ ÔÕÔÕÔÕÔÕÔÕÔÕÔÕ ÔÕ ÔÕ ÔÕÔÕÔÕÔÕ ÔÕÔÕ ÔÕ ÔÕ"ÔÕ ÔÕ ÔÕ ÔÕÔÕÔÕ ÔÕ ÔÕ"""""" """""""""""" """""""" """"""""" " "ÔÕ ÔÕÔÕÔÕ ÔÕÔÕÔÕX" "ÔÕÔÕÔÕÔÕÔÕÔÕÔÕ ÔÕ ÔÕÔÕÔÕÔÕ""ÔÕÔÕ"X """ ÔÕÔÕÔÕÔÕ ÔÕ"" " """"ÔÕÔÕÔÕÔÕÔÕ ÔÕÔÕ ÔÕÔÕÔÕ ÔÕ ÔÕÔÕÔÕÔÕ ÔÕÔÕÔÕÔÕÔÕÔÕ ÔÕÔÕ ÔÕÔÕ"" """""""""""""" "ÔÕ"""""""" " " """" ""X"""" """"""XX ÔÕ ÔÕ ÔÕ ÔÕ ÔÕÔÕÔÕÔÕÔÕ ÔÕÔÕÔÕÔÕ ÔÕÔÕÔÕÔÕ"""""" ÔÕ"""XÔÕÔÕ ÔÕÔÕÔÕ ÔÕ ÔÕÔÕ ÔÕÔÕÔÕÔÕÔÕÔÕÔÕ ÔÕÔÕ ÔÕÔÕÔÕ ÔÕ ÔÕ ÔÕÔÕ ÔÕ ÔÕÔÕ ÔÕ""" ""ÔÕÔÕ"" """"" """"ÔÕÔÕ ÔÕ ÔÕÔÕÔÕ" ÔÕÔÕÔÕ ÔÕÔÕ"" """""""""" "" """ " "" "XÔÕ ÔÕÔÕ ÔÕ"ÔÕÔÕÔÕ ÔÕÔÕ ÔÕÔÕÔÕÔÕ""""""""""""ÔÕ"ÔÕÔÕ""""" " ÔÕ "" """ÔÕ ÔÕÔÕ ÔÕ ÔÕ ÔÕ ÔÕÔÕÔÕÔÕÔÕ ÔÕÔÕÔÕÔÕÔÕÔÕÔÕ ÔÕÔÕÔÕ ÔÕÔÕÔÕÔÕÔÕÔÕ ÔÕÔÕ ÔÕÔÕÔÕ ÔÕ ÔÕ ÔÕÔÕ"ÔÕ" "X ÔÕÔÕÔÕÔÕÔÕ ÔÕÔÕ"ÔÕ"ÔÕ ÔÕÔÕ ÔÕÔÕ ÔÕ ÔÕ XÔÕ ÔÕÔÕ ÔÕÔÕ ÔÕÔÕÔÕÔÕÔÕ ÔÕ ÔÕ" ÔÕ ÔÕ " ÔÕ""X ÔÕÔÕCorn AreasXÔÕ""ÔÕÔÕ ÔÕ ÔÕ ÔÕ ÔÕÔÕÔÕ ÔÕ ÔÕXÔÕÔÕMinor"ÔÕ"ÔÕÔÕ" ""ÔÕRecord TypeÔÕ"""MajorÔÕÔÕX" ÔÕ X X h Snow (5)ÔÕÔÕ ÔÕ" ÔÕ ÔÕ Pcp (775)X"ÔÕÔÕÔÕÔÕ " Tmax (1167)ÔÕ ÔÕÔÕÔÕX Tmin (45)"Joint Agricultural Weather Facility<strong>World</strong> Agricultural Outlook BoardData courtesy of the U.S. National Climatic Data Center (NCDC)
October 5, 2010 Weekly Weather <strong>and</strong> Crop Bulletin 9
10 Weekly Weather <strong>and</strong> Crop Bulletin October 5, 2010
October 5, 2010 Weekly Weather <strong>and</strong> Crop Bulletin 11Agricultural Weather Data Compiled by USDA's Stoneville Field OfficeWeather Data for the Week Ending October 2, 2010Data Provided by the Mississippi State Delta Research <strong>and</strong> Extension Center (DREC)<strong>and</strong> the University of Missouri Commercial Agriculture Program.STATES TEMPERATURE ˚F PRECIPITATION4-INCHSOIL TEMP.˚FANDSTATIONSAVERAGEMAXIMUMAVERAGEMINIMUMEXTREMEHIGHEXTREMELOWAVERAGEDEPARTUREFROM NORMALWEEKLYTOTAL, IN.DEPARTUREFROM NORMALGREATEST IN24-HOUR, IN.TOTAL IN.SINCE SEP01PCT. NORMALSINCE SEP01TOTAL, IN.,SINCE JAN01PCT. NORMALSINCE JAN01AVERAGEMAXIMUMAVERAGEMINIMUMNUMBER OF DAYSTEMP. ˚F90 AND ABOVE32 AND BELOWPRECIP.01 INCHOR MORE.50 INCHOR MOREMISSISSIPPIND TUNICA 1W - - - - - - - - - - - - - - - - - - -LYON 81 53 86 49 67 - 0.00 - 0.00 2.10 - - - 76 69 0 0 0 0VANCE - - - - - - - - - - - - - - - - - - -PERTHSHIRE 80 55 85 52 67 - 0.00 - 0.00 0.32 - - - 77 67 0 0 0 0SCOTT - - - - - - - - - - - - - - - - - - -SANDY RIDGE 82 55 86 50 69 - 0.00 - 0.00 1.00 - - - - - 0 0 0 0NE VERONA - - - - - - - - - - - - - - - - - - -SD STONEVILLE x 83 56 87 52 70 -1 0.00 -0.75 0.00 2.13 63 26.35 66 76 64 0 0 0 0INDIANOLA 1S* 81 56 85 52 69 - 0.01 - 0.01 1.34 - - - 80 75 0 0 1 0INVERNESS 5E - - - - - - - - - - - - - - - - - - -SIDON 82 55 85 50 68 - 0.06 - 0.06 0.79 - - - - - 0 0 1 0NORTH ISSAQUENA 81 55 85 50 68 - 0.18 - 0.18 0.71 - - - 83 74 0 0 1 0SILVER CITY 81 55 85 50 68 - 0.59 - 0.59 1.65 - 25.50 - - - 0 0 1 1ONWARD 82 54 85 49 68 - 0.11 - 0.11 0.32 - - - - 74 0 0 1 0MAYDAY 82 51 85 43 66 - 0.36 - 0.36 - - - - - - 0 0 1 0MISSOURINW CORNING 76 47 87 41 61 -1 0.00 -0.53 0.00 3.23 94 28.90 102 - - 0 0 0 0ALBANY 72 44 80 40 58 -3 0.00 -0.43 0.00 6.63 191 33.16 112 68 59 0 0 0 0ST. JOSEPH 71 50 79 44 61 -1 0.00 -0.61 0.00 4.29 96 37.16 122 - - 0 0 0 0NC LINNEUS - - - - - - - - - - - - - - - - - - -BRUNSWICK 72 47 79 41 60 -2 0.00 -0.76 0.00 6.17 173 41.45 133 69 63 0 0 0 0NE NOVELTY 70 45 75 40 58 -4 0.00 -0.81 0.00 9.53 243 47.24 160 70 56 0 0 0 0MONROE CITY 71 45 78 39 58 -3 0.01 -0.68 0.01 8.55 219 43.90 149 66 57 0 0 1 0WC GREEN RIDGE 71 47 78 41 59 -3 0.00 -0.78 0.00 10.04 223 40.33 123 69 59 0 0 0 0C AUXVASSE 71 47 78 41 59 -3 0.00 -0.46 0.00 7.81 204 45.64 145 68 58 0 0 0 0COL-SANBORN FLD 71 49 78 44 60 -3 0.01 -0.65 0.01 7.36 194 49.44 150 70 60 0 0 1 0WILLIAMSBURG 72 46 78 41 59 -3 0.02 -0.56 0.02 7.79 188 37.41 112 66 59 0 0 1 0COL-JEFFERS F&G 70 48 78 42 59 -4 0.00 -0.65 0.00 5.84 154 40.63 124 68 59 0 0 0 0COL SOUTH FARMS 70 47 77 41 59 -4 0.00 -0.65 0.00 6.88 179 46.19 140 - - 0 0 0 0COL-BF 71 46 78 41 59 -4 0.00 -0.65 0.00 6.92 180 41.43 126 70 58 0 0 0 0VERSAILLES 73 47 81 41 60 -3 0.02 -0.52 0.02 9.70 243 39.68 121 69 61 0 0 1 0EC VANDALIA 71 45 80 40 58 -5 0.02 -0.24 0.02 8.79 244 45.08 141 72 57 0 0 1 0SW LAMAR 71 48 79 42 59 -5 0.00 -0.96 0.00 8.85 173 35.01 94 72 63 0 0 0 0SC COOK STATION 70 43 78 39 56 -6 0.02 -0.59 0.02 6.36 148 39.43 120 70 60 0 0 1 0MOUNTAIN GROVE 69 46 80 41 57 -5 0.09 -0.61 0.09 9.29 212 34.27 102 69 58 0 0 1 0SE DELTA 74 48 80 42 60 -4 0.56 0.07 0.56 5.50 166 27.77 84 71 62 0 0 1 1CHARLESTON 75 49 81 43 61 -4 0.02 -0.55 0.02 3.67 113 26.86 79 78 62 0 0 1 0GLENNONVILLE 77 47 83 42 61 -5 0.02 -0.41 0.02 0.91 27 22.07 71 76 65 0 0 1 0CLARKTON - - - - - - - - - - - - - - - - - - -PORTAGEVILLE DC 78 50 84 45 63 -4 0.05 -0.36 0.04 1.85 53 28.56 86 81 65 0 0 2 0PORTAGEVILLE LF 78 49 85 46 62 -4 0.05 -0.35 0.04 0.77 22 25.15 75 79 65 0 0 2 0STEELE 80 49 87 43 63 -3 0.00 -0.50 0.00 1.01 30 28.23 81 81 67 0 0 0 0CARDWELL 79 49 86 44 63 -3 0.00 -0.59 0.00 2.34 71 24.55 73 71 65 0 0 0 0Compiled by USDA/OCE/WAOB’s Stoneville Field Office. * Beasley Lake. X Based on 1971-2000 normals. - Sufficient data not available.Data are preliminary <strong>and</strong> subject to revision.Mississippi: ND = Northern Delta; NE = Northeastern Mississippi; EC = East Central Mississippi; SD = Southern Delta.Missouri: NW = Northwest; NC = North Central; NE = Northeast; WC = West Central; C = Central; EC = East Central; SW = Southwest; SE = Southeast;SC = South Central. (Col=Columbia, Col-Jeffers F&G=Columbia Jefferson Farm <strong>and</strong> Gardens, Col-BF=Bradford Farm)Weather <strong>and</strong> Crop Summary for the Mississippi Delta: An early-week frontal boundary produced light rain, primarily in thecentral to southern Delta, <strong>and</strong> provided some cooler <strong>weather</strong>. Otherwise, dry <strong>weather</strong> <strong>and</strong> near-normal temperatures prevailed, withplenty of days suitable for fieldwork. However, dust was often observed on windy days due to rapid drying <strong>and</strong> a lack of soil moisture.Missouri Weather StationsMississippi Weather StationsNote: For information on the <strong>weather</strong> stations in Missouri,please visit:http://agebb.missouri.edu/<strong>weather</strong>/stations/index.htmNote: For information on the <strong>weather</strong> stations in Mississippi,please visit:http://www.delta<strong>weather</strong>.msstate.edu/maps/<strong>weather</strong>_station_map.htm
12 Weekly Weather <strong>and</strong> Crop Bulletin October 5, 2010National Weather Data for Selected CitiesWeather Data for the Week Ending October 2, 2010Data Provided by Climate Prediction Center (301-763-8000, Ext. 7503)STATESANDSTATIONSAVERAGEMAXIMUMAVERAGEMINIMUMEXTREMEHIGHEXTREMELOWAVERAGEDEPARTUREFROM NORMALWEEKLYTOTAL, IN.DEPARTUREFROM NORMALGREATEST IN24-HOUR, IN.TOTAL, IN.,SINCE SEP 1PCT. NORMALSINCE SEP 1TOTAL, IN.,SINCE JAN 1PCT. NORMALSINCE JAN 1AVERAGEMAXIMUMAVERAGEMINIMUMNUMBER OF DAYSAL BIRMINGHAM 80 54 84 50 67 -3 0.38 -0.50 0.21 0.43 10 38.01 91 90 38 0 0 2 0HUNTSVILLE 78 54 83 47 66 -2 0.36 -0.59 0.25 2.53 56 31.64 73 89 49 0 0 2 0MOBILE 83 57 87 53 70 -4 1.62 0.53 1.32 2.36 38 48.77 92 86 44 0 0 2 1MONTGOMERY 84 57 86 53 71 -2 2.17 1.31 2.17 2.19 49 31.39 73 90 41 0 0 1 1AK ANCHORAGE 48 37 53 25 42 -2 0.33 -0.27 0.20 1.03 34 12.40 103 77 58 0 1 3 0BARROW 33 23 36 13 28 2 0.43 0.32 0.15 0.57 79 4.17 119 94 65 0 7 4 0FAIRBANKS 47 26 59 14 37 -1 0.01 -0.21 0.01 1.21 103 7.94 99 70 60 0 5 1 0JUNEAU 52 45 57 39 49 2 2.59 0.62 0.70 6.90 85 35.94 90 96 88 0 0 6 2KODIAK 52 43 54 38 48 2 2.22 0.19 1.32 4.28 51 56.27 106 83 72 0 0 5 1NOME 42 27 46 22 34 -4 0.14 -0.31 0.13 2.25 86 9.64 75 80 66 0 6 2 0AZ FLAGSTAFF 81 42 83 39 62 8 0.00 -0.44 0.00 0.79 35 19.63 113 70 17 0 0 0 0PHOENIX 104 80 107 76 92 9 0.00 -0.17 0.00 0.13 16 7.40 125 35 21 7 0 0 0PRESCOTT 90 56 93 53 73 11 0.72 0.34 0.45 0.75 35 16.19 105 59 13 5 0 2 0TUCSON 100 70 104 65 85 7 0.00 -0.30 0.00 0.70 45 10.20 109 41 22 7 0 0 0AR FORT SMITH 79 52 85 49 66 -4 0.07 -0.78 0.07 5.91 154 29.08 91 90 41 0 0 1 0LITTLE ROCK 83 55 90 52 69 -2 0.00 -0.85 0.00 1.31 33 25.64 70 84 32 1 0 0 0CA BAKERSFIELD 98 71 100 66 85 11 0.00 -0.03 0.00 0.00 0 5.26 109 48 28 7 0 0 0FRESNO 99 68 102 61 84 12 0.00 -0.06 0.00 0.00 0 8.35 102 59 32 7 0 0 0LOS ANGELES 86 67 105 63 77 8 0.00 -0.03 0.00 0.00 0 9.07 92 76 53 2 0 0 0REDDING 97 59 106 56 78 8 0.00 -0.16 0.00 0.34 64 24.11 106 45 27 5 1 0 0SACRAMENTO 96 59 102 54 77 7 0.00 -0.08 0.00 0.01 3 13.48 109 80 17 6 0 0 0SAN DIEGO 84 70 95 67 77 7 0.01 -0.02 0.01 0.01 5 8.19 103 76 51 1 0 1 0SAN FRANCISCO 82 61 96 58 71 8 0.00 -0.04 0.00 0.01 5 14.90 109 73 53 2 0 0 0STOCKTON 97 59 102 54 78 7 0.00 -0.08 0.00 0.00 0 10.69 113 62 34 6 0 0 0CO ALAMOSA 81 35 85 31 58 7 0.00 -0.17 0.00 0.74 79 4.91 84 82 33 0 2 0 0CO SPRINGS 81 48 88 43 64 8 0.00 -0.14 0.00 0.09 7 8.80 56 63 20 0 0 0 0DENVER INTL 83 50 92 42 67 10 0.00 -0.22 0.00 0.07 6 11.61 98 51 17 2 0 0 0GRAND JUNCTION 88 53 90 51 70 9 0.00 -0.22 0.00 0.73 75 6.36 93 42 21 1 0 0 0PUEBLO 85 46 94 43 65 5 0.00 -0.11 0.00 0.08 9 10.98 102 61 31 3 0 0 0CT BRIDGEPORT 74 62 78 51 68 7 2.62 1.83 1.03 3.60 95 36.92 110 87 69 0 0 4 3HARTFORD 74 56 82 45 65 6 4.66 3.76 2.25 4.82 110 31.38 90 88 65 0 0 4 3DC WASHINGTON 76 61 84 52 69 3 5.34 4.49 4.61 6.06 150 27.42 91 89 54 0 0 5 1DE WILMINGTON 74 59 81 46 66 3 8.09 7.20 5.70 9.21 216 37.04 111 95 57 0 0 5 2FL DAYTONA BEACH 86 69 93 65 78 0 0.84 -0.52 0.67 3.49 50 37.87 96 96 56 1 0 2 1JACKSONVILLE 84 68 89 63 76 1 4.25 2.69 2.88 5.12 62 31.78 72 93 62 0 0 4 2KEY WEST 86 77 88 73 82 0 0.08 -1.05 0.07 8.93 155 29.24 97 85 68 0 0 2 0MIAMI 87 75 89 72 81 0 5.89 4.20 4.92 15.89 180 59.96 127 89 65 0 0 3 2ORLANDO 88 69 93 65 79 0 2.80 1.74 2.66 5.67 94 43.26 105 96 66 3 0 2 1PENSACOLA 85 62 89 58 74 -2 4.12 2.99 1.88 6.78 112 59.94 115 73 38 0 0 6 2TALLAHASSEE 84 62 87 55 73 -3 1.27 0.36 0.71 1.94 37 52.37 100 91 55 0 0 2 2TAMPA 89 73 90 69 81 1 0.05 -1.09 0.04 1.13 17 37.73 97 86 50 4 0 2 0WEST PALM BEACH 87 75 90 70 81 0 4.16 2.56 2.99 6.36 75 48.78 102 81 63 1 0 4 2GA ATHENS 76 57 80 50 66 -3 4.38 3.59 1.89 5.35 143 39.46 106 93 66 0 0 4 3ATLANTA 78 58 81 54 68 -1 1.46 0.58 1.13 1.59 37 37.70 96 87 57 0 0 3 1AUGUSTA 79 59 84 52 69 -1 1.77 1.04 1.26 1.89 50 25.49 71 97 72 0 0 2 2COLUMBUS 83 62 85 58 72 -1 2.18 1.58 1.87 3.17 98 30.41 80 85 40 0 0 2 1MACON 81 58 85 53 69 -2 5.46 4.82 4.25 6.85 200 40.85 115 97 56 0 0 6 2SAVANNAH 81 66 89 60 74 1 2.43 1.54 1.14 3.01 57 33.82 82 91 61 0 0 4 2HI HILO 84 67 86 65 76 0 0.03 -1.82 0.03 2.76 29 36.92 41 80 62 0 0 1 0HONOLULU 86 71 87 71 79 -2 0.25 -0.05 0.15 0.67 81 5.09 46 77 66 0 0 3 0KAHULUI 87 67 89 63 77 -2 0.03 -0.05 0.02 0.19 46 4.26 34 78 68 0 0 2 0LIHUE 85 71 87 68 78 -1 0.21 -0.55 0.17 1.35 46 12.22 47 79 68 0 0 2 0ID BOISE 89 57 92 55 73 13 0.00 -0.17 0.00 0.03 4 9.04 104 37 21 3 0 0 0LEWISTON 84 54 87 51 69 10 0.00 -0.17 0.00 0.78 92 10.54 110 72 50 0 0 0 0POCATELLO 88 39 90 36 63 8 0.00 -0.19 0.00 0.20 21 6.06 64 61 28 2 0 0 0IL CHICAGO/O'HARE 68 49 75 45 58 -2 0.31 -0.27 0.23 3.09 90 32.14 114 86 53 0 0 2 0MOLINE 71 47 77 43 59 -2 0.04 -0.56 0.03 4.33 130 39.72 130 89 51 0 0 2 0PEORIA 70 46 75 42 58 -3 0.10 -0.59 0.08 5.13 155 37.19 133 89 42 0 0 2 0ROCKFORD 70 45 76 41 58 -1 0.15 -0.51 0.13 2.05 56 31.16 106 84 47 0 0 2 0SPRINGFIELD 72 46 79 42 59 -4 0.20 -0.39 0.19 8.14 271 42.71 154 93 38 0 0 2 0IN EVANSVILLE 76 48 85 44 62 -3 0.09 -0.52 0.07 0.45 14 21.57 64 78 45 0 0 2 0FORT WAYNE 68 45 78 40 57 -3 0.40 -0.16 0.22 1.59 54 27.70 98 89 42 0 0 2 0INDIANAPOLIS 71 49 80 46 60 -2 0.37 -0.22 0.28 0.85 28 26.48 84 83 37 0 0 2 0SOUTH BEND 67 42 74 39 54 -5 0.12 -0.67 0.12 2.26 56 25.94 86 93 50 0 0 1 0IA BURLINGTON 70 45 76 40 57 -6 0.12 -0.65 0.11 5.57 146 47.89 157 98 44 0 0 2 0CEDAR RAPIDS 69 43 77 39 56 -4 0.02 -0.57 0.01 5.22 152 38.28 138 92 37 0 0 2 0DES MOINES 73 48 82 44 61 0 0.00 -0.59 0.00 4.13 124 48.16 167 87 49 0 0 0 0DUBUQUE 67 41 75 37 54 -4 0.10 -0.54 0.10 2.62 70 40.89 141 91 57 0 0 1 0SIOUX CITY 76 44 84 37 60 1 0.00 -0.50 0.00 3.00 117 29.70 135 91 49 0 0 0 0WATERLOO 71 42 82 36 56 -2 0.01 -0.55 0.01 2.50 80 39.22 142 95 61 0 0 1 0KS CONCORDIA 76 47 89 43 61 -3 0.00 -0.51 0.00 3.33 126 28.43 116 87 50 0 0 0 0DODGE CITY 81 48 95 40 64 -1 0.00 -0.33 0.00 1.44 80 23.81 124 79 23 1 0 0 0GOODLAND 79 45 86 41 62 2 0.00 -0.22 0.00 1.64 139 18.92 108 80 38 0 0 0 0TOPEKA 75 47 84 42 61 -3 0.00 -0.78 0.00 4.69 119 33.76 116 90 52 0 0 0 0Based on 1971-2000 normalsTEMPERATURE ˚FPRECIPITATIONRELATIVEHUMIDITYPERCENTTEMP. ˚F90 AND ABOVE32 AND BELOWPRECIP.01 INCHOR MORE*** Not Available.50 INCHOR MORE
October 5, 2010 Weekly Weather <strong>and</strong> Crop Bulletin 13Weather Data for the Week Ending October 2, 2010STATESANDSTATIONSAVERAGEMAXIMUMAVERAGEMINIMUMEXTREMEHIGHEXTREMELOWAVERAGEDEPARTUREFROM NORMALWEEKLYTOTAL, IN.DEPARTUREFROM NORMALGREATEST IN24-HOUR, IN.TOTAL, IN.,SINCE SEP 1PCT. NORMALSINCE SEP 1TOTAL, IN.,SINCE JAN01PCT. NORMALSINCE JAN01AVERAGEMAXIMUMAVERAGEMINIMUMNUMBER OF DAYSWICHITA 76 50 86 45 63 -4 0.00 -0.65 0.00 3.11 99 26.31 105 84 52 0 0 0 0KY JACKSON 68 52 75 44 60 -4 0.60 -0.19 0.43 2.05 51 34.84 92 93 55 0 0 2 0LEXINGTON 71 47 81 41 59 -5 0.06 -0.61 0.03 0.64 19 29.88 83 84 42 0 0 2 0LOUISVILLE 78 52 86 47 65 -1 0.08 -0.58 0.08 0.21 7 29.92 87 76 31 0 0 1 0PADUCAH 76 48 82 43 62 -3 0.00 -0.83 0.00 3.64 96 28.74 77 87 35 0 0 0 0LA BATON ROUGE 84 58 86 54 71 -4 0.11 -0.83 0.11 1.91 37 44.03 89 91 38 0 0 1 0LAKE CHARLES 88 60 91 54 74 -2 0.00 -1.21 0.00 0.93 15 26.01 59 83 29 4 0 0 0NEW ORLEANS 85 66 91 62 75 -1 0.02 -0.92 0.02 0.33 6 48.26 94 73 41 1 0 1 0SHREVEPORT 87 57 91 53 72 -1 0.00 -0.85 0.00 0.12 3 24.30 64 78 28 1 0 0 0ME CARIBOU 67 49 74 40 58 9 2.84 2.17 1.20 7.01 203 31.41 111 95 70 0 0 6 2PORTLAND 67 54 79 42 61 7 1.20 0.36 0.74 2.97 82 37.04 113 96 76 0 0 5 1MD BALTIMORE 74 57 81 46 66 3 7.32 6.45 6.00 8.28 196 36.53 112 91 64 0 0 6 2MA BOSTON 75 59 84 50 67 6 1.07 0.29 0.68 2.15 58 39.55 127 92 64 0 0 3 1WORCESTER 69 55 77 45 62 6 3.68 2.67 2.29 4.57 100 38.09 104 99 70 0 0 5 2MI ALPENA 59 43 68 39 51 -1 0.11 -0.46 0.04 4.12 139 22.76 102 94 59 0 0 4 0GRAND RAPIDS 66 45 73 40 55 -2 0.37 -0.47 0.32 2.84 63 28.71 101 90 50 0 0 4 0HOUGHTON LAKE 61 36 68 30 48 -5 0.11 -0.47 0.09 2.99 91 21.65 96 98 58 0 1 2 0LANSING 63 42 72 40 53 -3 0.51 -0.13 0.26 5.10 140 21.43 87 95 66 0 0 4 0MUSKEGON 66 45 73 41 55 -1 0.48 -0.19 0.45 6.70 181 25.68 105 88 56 0 0 3 0TRAVERSE CITY 61 42 68 38 52 -4 0.32 -0.43 0.18 5.39 142 26.95 106 97 53 0 0 2 0MN DULUTH 62 40 70 31 51 0 0.36 -0.42 0.20 3.45 79 27.96 109 81 58 0 1 3 0INT'L FALLS 62 39 68 28 51 2 0.15 -0.44 0.14 6.03 189 27.74 138 91 52 0 1 2 0MINNEAPOLIS 68 47 75 41 58 1 0.00 -0.47 0.00 5.53 196 26.43 108 84 48 0 0 0 0ROCHESTER 68 44 80 39 56 1 0.00 -0.57 0.00 9.99 305 32.58 124 91 58 0 0 0 0ST. CLOUD 67 42 74 33 54 1 0.00 -0.52 0.00 7.17 234 27.78 122 96 44 0 0 0 0MS JACKSON 83 54 86 50 69 -3 0.04 -0.66 0.04 0.06 2 35.30 83 83 31 0 0 1 0MERIDIAN 82 50 86 45 66 -6 0.24 -0.59 0.24 0.24 6 33.51 74 95 47 0 0 1 0TUPELO 80 53 84 46 67 -2 0.00 -0.78 0.00 1.85 52 37.61 90 82 36 0 0 0 0MO COLUMBIA 70 49 77 43 59 -4 0.00 -0.73 0.00 6.97 193 41.52 132 88 48 0 0 0 0KANSAS CITY 72 49 79 42 61 -3 0.01 -1.06 0.01 7.59 154 38.56 124 91 42 0 0 1 0SAINT LOUIS 72 52 80 47 62 -4 0.12 -0.52 0.11 3.75 119 31.36 106 84 49 0 0 2 0SPRINGFIELD 70 48 76 44 59 -6 0.00 -1.00 0.00 11.67 229 40.19 118 94 64 0 0 0 0MT BILLINGS 80 51 92 44 65 10 0.00 -0.33 0.00 0.64 45 15.29 126 64 30 2 0 0 0BUTTE 79 36 83 35 58 10 0.00 -0.20 0.00 1.13 98 13.59 124 84 17 0 0 0 0CUT BANK 76 43 83 36 59 10 0.00 -0.17 0.00 0.67 55 7.10 63 83 27 0 0 0 0GLASGOW 77 45 91 41 61 8 0.00 -0.19 0.00 1.68 162 15.86 162 83 44 1 0 0 0GREAT FALLS 80 47 86 38 63 11 0.00 -0.22 0.00 2.26 175 15.61 122 79 27 0 0 0 0HAVRE 79 42 88 36 60 8 0.03 -0.17 0.03 1.70 156 12.35 124 89 46 0 0 1 0MISSOULA 82 45 86 40 63 12 0.01 -0.19 0.01 1.47 129 12.16 111 80 49 0 0 1 0NE GRAND ISLAND 77 45 87 40 61 1 0.00 -0.44 0.00 1.68 66 28.32 126 84 51 0 0 0 0LINCOLN 76 44 88 36 60 -2 0.00 -0.58 0.00 3.75 122 32.09 133 90 48 0 0 0 0NORFOLK 75 43 82 36 59 0 0.00 -0.45 0.00 2.87 121 27.90 121 89 47 0 0 0 0NORTH PLATTE 77 39 85 34 58 0 0.00 -0.28 0.00 1.30 93 21.09 122 94 32 0 0 0 0OMAHA 75 49 86 43 62 1 0.00 -0.66 0.00 2.45 73 31.94 126 91 53 0 0 0 0SCOTTSBLUFF 83 44 92 40 64 8 0.00 -0.28 0.00 0.06 5 13.86 99 77 35 2 0 0 0VALENTINE 77 40 87 29 59 2 0.00 -0.35 0.00 0.91 54 16.00 92 86 38 0 1 0 0NV ELY 88 38 91 36 63 10 0.01 -0.21 0.01 0.02 2 4.82 61 35 14 2 0 1 0LAS VEGAS 99 75 103 71 87 10 0.03 -0.03 0.03 0.04 12 3.32 93 23 14 7 0 1 0RENO 93 53 96 48 73 14 0.01 -0.07 0.01 0.01 2 4.77 88 48 21 6 0 1 0WINNEMUCCA 93 38 95 34 66 10 0.06 -0.05 0.01 0.35 63 6.71 110 36 13 7 0 6 0NH CONCORD 70 52 80 36 61 6 2.24 1.52 1.35 2.92 87 26.42 95 98 70 0 0 4 1NJ NEWARK 75 61 79 51 68 4 4.33 3.48 2.36 5.94 140 36.28 101 87 67 0 0 4 3NM ALBUQUERQUE 86 61 90 58 74 9 0.08 -0.11 0.08 1.14 101 6.87 93 52 21 1 0 1 0NY ALBANY 70 54 78 45 62 6 6.09 5.39 3.28 6.45 184 27.27 94 92 64 0 0 4 2BINGHAMTON 66 50 77 42 58 3 3.00 2.24 1.91 3.45 91 27.62 94 93 69 0 0 5 2BUFFALO 62 50 72 40 56 -1 1.09 0.33 0.52 2.98 74 27.52 92 92 65 0 0 4 1ROCHESTER 64 50 77 41 57 0 1.70 1.02 1.13 3.42 94 28.58 110 93 66 0 0 4 1SYRACUSE 65 51 79 46 58 1 3.99 3.12 2.69 5.48 125 32.22 107 94 68 0 0 4 2NC ASHEVILLE 68 53 71 42 61 -1 2.28 1.56 1.11 4.15 106 34.56 94 94 65 0 0 4 2CHARLOTTE 76 59 86 49 67 -2 3.94 3.07 1.92 4.20 103 32.17 96 91 57 0 0 4 3GREENSBORO 74 58 78 49 66 0 6.56 5.59 3.10 6.74 148 37.08 109 86 54 0 0 4 4HATTERAS 81 70 86 65 76 4 7.23 6.04 2.36 12.19 203 54.37 126 99 73 0 0 7 4RALEIGH 77 62 84 50 70 3 6.54 5.61 2.28 6.71 148 30.84 90 88 62 0 0 6 4WILMINGTON 77 66 85 61 72 0 22.20 20.91 9.94 23.44 329 53.22 113 93 71 0 0 7 5ND BISMARCK 72 40 84 27 56 3 0.00 -0.33 0.00 3.63 214 20.37 140 84 46 0 1 0 0DICKINSON 71 41 86 32 56 3 0.00 -0.31 0.00 2.99 174 14.06 99 84 33 0 1 0 0FARGO 69 45 75 32 57 4 0.02 -0.45 0.02 5.83 252 25.09 142 85 44 0 1 1 0GRAND FORKS 68 43 74 31 56 3 0.16 -0.24 0.14 5.42 262 24.17 147 93 46 0 1 2 0JAMESTOWN 69 42 76 29 55 2 0.00 -0.37 0.00 3.50 190 21.06 131 90 38 0 1 0 0WILLISTON 75 42 88 33 59 8 0.00 -0.28 0.00 1.40 99 16.86 139 81 43 0 0 0 0OH AKRON-CANTON 63 49 71 43 56 -3 1.51 0.81 1.20 4.23 117 29.60 98 92 68 0 0 3 1CINCINNATI 71 47 83 41 59 -4 0.14 -0.44 0.10 0.72 24 26.64 81 86 53 0 0 2 0CLEVELAND 63 51 70 46 57 -2 1.52 0.77 1.07 3.30 83 27.21 92 91 66 0 0 3 1COLUMBUS 67 49 77 43 58 -4 1.25 0.68 0.65 1.76 57 29.22 97 92 63 0 0 4 1DAYTON 67 48 78 45 57 -4 1.09 0.55 0.92 1.76 63 26.28 86 89 48 0 0 3 1MANSFIELD 63 46 74 42 55 -4 1.76 1.15 0.87 2.66 74 31.07 92 95 58 0 0 3 2Based on 1971-2000 normalsTEMPERATURE ˚FPRECIPITATIONRELATIVEHUMIDITYPERCENTTEMP. ˚F90 AND ABOVE32 AND BELOWPRECIP.01 INCHOR MORE*** Not Available.50 INCHOR MORE
14 Weekly Weather <strong>and</strong> Crop Bulletin October 5, 2010Weather Data for the Week Ending October 2, 2010STATESANDSTATIONSAVERAGEMAXIMUMTEMPERATURE ˚FAVERAGEMINIMUMEXTREMEHIGHEXTREMELOWAVERAGEDEPARTUREFROM NORMALWEEKLYTOTAL, IN.DEPARTUREFROM NORMALPRECIPITATIONGREATEST IN24-HOUR, IN.TOTAL, IN.,SINCE SEP 1PCT. NORMALSINCE SEP 1TOTAL, IN.,SINCE JAN01PCT. NORMALSINCE JAN01RELATIVEHUMIDITYPERCENTAVERAGEMAXIMUMAVERAGEMINIMUMNUMBER OF DAYSTEMP. ˚FTOLEDO 65 47 75 42 56 -3 0.76 0.22 0.37 1.87 63 29.09 114 92 64 0 0 3 0YOUNGSTOWN 62 47 68 37 55 -3 1.19 0.40 0.49 2.63 64 27.87 94 97 71 0 0 3 0OK OKLAHOMA CITY 79 53 85 50 66 -3 0.00 -1.01 0.00 3.60 85 30.48 107 78 34 0 0 0 0TULSA 77 49 83 45 63 -7 0.00 -1.12 0.00 2.88 57 30.75 94 92 53 0 0 0 0OR ASTORIA 69 54 78 45 62 5 0.79 0.10 0.61 4.79 170 48.11 118 95 82 0 0 6 1BURNS 88 37 91 32 63 12 0.00 -0.11 0.00 0.15 28 8.12 109 58 29 1 1 0 0EUGENE 77 54 86 46 65 6 0.00 -0.31 0.00 1.61 99 27.74 90 93 79 0 0 0 0MEDFORD 91 52 95 49 71 9 0.00 -0.17 0.00 0.80 96 13.00 115 82 34 5 0 0 0PENDLETON 81 52 85 49 66 7 0.00 -0.14 0.00 1.07 160 12.15 140 76 47 0 0 0 0PORTLAND 75 59 84 54 67 7 0.11 -0.28 0.10 3.54 200 27.62 120 90 77 0 0 2 0SALEM 77 56 87 51 67 8 0.15 -0.20 0.15 2.09 137 27.85 115 90 72 0 0 1 0PA ALLENTOWN 73 54 79 43 63 4 8.74 7.84 6.78 9.83 213 42.18 121 88 68 0 0 4 2ERIE 62 52 67 44 57 -3 1.96 0.96 1.24 4.94 99 28.82 92 87 72 0 0 5 2MIDDLETOWN 74 57 81 48 65 3 4.52 3.77 3.27 5.60 151 32.64 105 89 54 0 0 5 2PHILADELPHIA 76 62 81 51 69 5 5.72 4.91 2.85 6.49 158 37.46 113 86 63 0 0 5 2PITTSBURGH 65 51 66 40 58 -2 1.83 1.20 1.19 3.28 97 28.21 94 90 58 0 0 3 1WILKES-BARRE 71 52 78 42 61 3 4.24 3.40 3.96 4.79 117 23.16 80 90 58 0 0 3 1WILLIAMSPORT 71 52 77 42 61 2 6.42 5.57 4.14 7.61 181 32.30 101 94 69 0 0 5 3RI PROVIDENCE 75 61 82 51 68 8 0.96 0.19 0.47 2.78 71 41.95 122 89 70 0 0 4 0SC BEAUFORT 78 65 83 60 71 -2 2.34 1.47 0.96 2.39 43 33.70 82 97 66 0 0 4 2CHARLESTON 79 67 82 61 73 0 6.74 5.66 2.95 8.12 130 53.96 126 95 69 0 0 4 3COLUMBIA 78 62 83 53 70 -1 1.94 1.20 0.94 1.94 47 30.78 78 90 66 0 0 3 2GREENVILLE 74 57 83 49 66 -2 2.20 1.28 1.35 2.27 54 36.48 94 92 61 0 0 4 2SD ABERDEEN 71 42 78 33 57 2 0.00 -0.39 0.00 4.08 213 24.30 138 92 51 0 0 0 0HURON 73 43 79 34 58 2 0.00 -0.39 0.00 3.52 184 28.59 158 97 40 0 0 0 0RAPID CITY 77 42 89 36 60 4 0.00 -0.26 0.00 1.52 129 17.90 125 85 28 0 0 0 0SIOUX FALLS 71 45 76 39 58 1 0.00 -0.50 0.00 4.48 165 35.37 168 89 57 0 0 0 0TN BRISTOL 70 52 75 43 61 -1 1.92 1.26 1.00 4.05 124 27.53 84 97 58 0 0 5 2CHATTANOOGA 77 57 82 52 67 -1 0.66 -0.25 0.34 1.12 25 30.16 72 85 52 0 0 3 0KNOXVILLE 72 56 78 50 64 -3 1.37 0.69 0.94 4.35 135 32.74 88 93 57 0 0 4 1MEMPHIS 81 56 87 53 69 -2 0.00 -0.72 0.00 0.15 4 36.77 92 75 30 0 0 0 0NASHVILLE 77 51 83 42 64 -3 0.00 -0.75 0.00 1.17 31 49.31 135 82 36 0 0 0 0TX ABILENE 83 56 88 49 69 -3 0.00 -0.69 0.00 1.89 61 24.37 132 81 40 0 0 0 0AMARILLO 84 52 94 48 68 2 0.00 -0.35 0.00 1.80 91 22.68 133 78 30 2 0 0 0AUSTIN 86 55 89 48 71 -6 0.00 -0.79 0.00 8.50 270 30.00 121 76 43 0 0 0 0BEAUMONT 86 62 89 57 74 -2 0.00 -1.32 0.00 3.81 59 36.34 80 87 35 0 0 0 0BROWNSVILLE 89 67 92 63 78 -1 0.06 -1.14 0.06 10.12 179 33.91 160 90 58 3 0 1 0CORPUS CHRISTI 86 65 90 60 75 -4 0.00 -1.16 0.00 15.56 290 41.98 167 87 50 1 0 0 0DEL RIO 89 60 93 54 75 -2 0.00 -0.52 0.00 2.12 96 29.81 203 75 37 4 0 0 0EL PASO 88 62 95 59 75 3 0.00 -0.31 0.00 1.63 96 6.34 84 63 23 5 0 0 0FORT WORTH 82 58 87 53 70 -4 0.00 -0.76 0.00 9.11 344 27.01 105 81 36 0 0 0 0GALVESTON 83 69 86 65 76 -3 0.00 -1.16 0.00 3.44 57 22.83 68 80 41 0 0 0 0HOUSTON 88 62 91 57 75 -1 0.00 -0.96 0.00 4.83 105 36.98 103 80 45 3 0 0 0LUBBOCK 85 53 92 48 69 2 0.00 -0.54 0.00 0.93 34 23.79 151 79 38 1 0 0 0MIDLAND 84 55 90 49 70 -1 0.00 -0.55 0.00 2.36 96 16.06 135 85 37 1 0 0 0SAN ANGELO 87 54 92 49 70 -2 0.00 -0.69 0.00 1.73 55 16.63 101 85 44 2 0 0 0SAN ANTONIO 86 60 90 52 73 -4 0.04 -0.72 0.04 9.41 292 36.34 147 82 36 1 0 1 0VICTORIA 86 60 89 56 73 -4 0.00 -1.20 0.00 14.63 274 43.78 141 94 53 0 0 0 0WACO 85 55 90 48 70 -5 0.00 -0.83 0.00 9.49 304 37.29 152 86 42 1 0 0 0WICHITA FALLS 81 54 87 49 68 -4 0.00 -0.77 0.00 5.43 159 27.11 120 83 39 0 0 0 0UT SALT LAKE CITY 87 55 90 52 71 11 0.00 -0.35 0.00 0.09 6 10.96 88 45 13 1 0 0 0VT BURLINGTON 66 53 81 40 60 5 3.38 2.58 1.50 5.75 142 29.38 105 98 73 0 0 4 2VA LYNCHBURG 71 54 74 44 62 -1 6.24 5.34 2.76 6.83 165 39.10 116 92 66 0 0 5 4NORFOLK 76 68 82 62 72 4 11.76 10.88 7.81 12.24 285 45.07 123 92 73 0 0 6 4RICHMOND 76 61 83 50 69 3 6.27 5.36 2.97 6.50 153 29.23 85 92 61 0 0 6 2ROANOKE 69 54 75 45 61 -3 6.10 5.27 2.34 7.41 182 36.76 110 90 66 0 0 7 4WASH/DULLES 74 57 81 45 65 2 5.62 4.80 4.49 6.18 153 32.69 101 91 64 0 0 6 2WA OLYMPIA 69 52 78 44 60 5 0.34 -0.16 0.31 5.82 267 33.70 110 97 82 0 0 2 0QUILLAYUTE 67 50 78 40 58 4 2.61 1.35 1.30 8.89 196 74.20 118 96 82 0 0 3 2SEATTLE-TACOMA 67 55 71 51 61 3 0.42 0.02 0.39 4.80 274 28.00 125 93 86 0 0 2 0SPOKANE 79 53 81 49 66 11 0.00 -0.15 0.00 0.73 91 11.23 101 76 40 0 0 0 0YAKIMA 84 48 88 44 66 10 0.00 -0.06 0.00 0.88 215 7.18 135 89 54 0 0 0 0WV BECKLEY 64 49 69 38 56 -4 1.67 0.95 0.71 2.00 58 35.17 106 93 67 0 0 4 2CHARLESTON 70 52 76 43 61 -1 0.29 -0.39 0.19 1.09 30 35.31 102 91 52 0 0 4 0ELKINS 66 48 72 39 57 -1 2.79 2.01 1.83 4.05 100 31.75 87 99 62 0 0 6 2HUNTINGTON 69 50 78 42 60 -3 1.35 0.76 0.83 3.51 118 34.89 106 95 56 0 0 4 1WI EAU CLAIRE 66 39 77 32 52 -3 0.06 -0.60 0.03 7.64 195 32.02 118 97 47 0 1 4 0GREEN BAY 64 43 71 38 53 -2 0.27 -0.29 0.27 4.75 146 33.05 141 94 55 0 0 1 0LA CROSSE 68 44 82 38 56 -3 0.00 -0.61 0.00 5.60 157 35.04 130 96 46 0 0 0 0MADISON 67 41 74 35 54 -3 0.02 -0.52 0.02 2.76 85 33.10 123 95 55 0 0 1 0MILWAUKEE 66 48 75 43 57 -2 0.03 -0.59 0.03 2.12 61 30.50 111 84 57 0 0 1 0WY CASPER 82 41 92 34 62 9 0.00 -0.27 0.00 0.28 26 9.95 94 57 31 2 0 0 0CHEYENNE 76 46 89 39 61 8 0.00 -0.26 0.00 0.01 1 13.79 101 58 30 0 0 0 0LANDER 82 48 89 43 65 11 0.00 -0.30 0.00 0.02 2 12.78 121 49 15 0 0 0 0SHERIDAN 83 43 93 38 63 11 0.00 -0.36 0.00 0.25 17 12.50 105 75 35 2 0 0 0Based on 1971-2000 normals*** Not Available90 AND ABOVE32 AND BELOWPRECIP.01 INCHOR MORE.50 INCHOR MORE
October 5, 2010 Weekly Weather <strong>and</strong> Crop Bulletin 15Cooler <strong>weather</strong> reigned over much of the countryeast of the Great Plains during the week, withtemperatures averaging as much as 9 degrees Fbelow normal in parts of Missouri, Oklahoma, <strong>and</strong>Texas. Elsewhere, warm, dry conditions in much ofthe West provided ideal conditions for summer <strong>crop</strong>maturation <strong>and</strong> fall fieldwork. Additionally, dryNational Agricultural SummarySeptember 27 – October 3, 2010Weekly National Agricultural Summary provided by USDA/NASSHIGHLIGHTS<strong>weather</strong> across the Corn Belt promoted thecontinued rapid corn <strong>and</strong> soybean harvest.Conversely, heavy precipitation fell along much ofthe Atlantic Coast, helping to replenish soil moisturebut triggering localized flooding. Most notably,coastal locations in North Carolina <strong>and</strong> Virginiareceived more than 12 inches of rain during the week.Corn: Nationally, 93 percent of this year’s corn <strong>crop</strong> was at or beyondthe mature stage by week’s end, 39 percentage points ahead of last year<strong>and</strong> 14 points ahead of the 5-year average. Maturity was nearly completeacross much of the Corn Belt, where progress was well ahead of both lastyear <strong>and</strong> the average pace. By October 3, producers had harvested 37percent of the nation’s <strong>crop</strong>, 28 percentage points—or 36 days—ahead oflast year <strong>and</strong> 16 points ahead of the 5-year average. Harvest was mostadvanced <strong>and</strong> nearly complete in Tennessee, 62 percentage points aheadof last year <strong>and</strong> 21 points ahead of the average. In the Corn Belt, warm,dry conditions continued to promote a rapid harvest pace, with progress inIllinois <strong>and</strong> Indiana 59 points or more ahead of last year <strong>and</strong> 43 points ormore ahead of normal. Overall, 66 percent of the corn <strong>crop</strong> was reportedin good to excellent condition, unchanged from last week but 4 percentagepoints below the same time last year.Soybeans: By week’s end, leaves were dropping on 88 percent of thesoybean <strong>crop</strong>, 11 percentage points ahead of last year <strong>and</strong> 3 points ahead ofthe 5-year average. Double-digit progress was evident in most of the majorsoybean-producing areas of the country, as leaf drop neared completion inmuch of the Corn Belt, lower Delta, <strong>and</strong> Ohio Valley. With mostly dry<strong>weather</strong> providing nearly ideal conditions for fall fieldwork, harvestadvanced 20 points during the week to 37 percent complete by October 3.This was 23 percentage points ahead of last year <strong>and</strong> 9 points ahead of the 5-year average. Producers in Illinois, Indiana, Iowa, Minnesota, <strong>and</strong>Nebraska, the five largest soybean-producing states, harvested 22 percent ormore of their <strong>crop</strong> during the week. Overall, 64 percent of the soybean <strong>crop</strong>was reported in good to excellent condition, up slightly from last week but 3percentage points below the same time last year.Winter Wheat: Dry conditions <strong>and</strong> sunny skies provided ample time forproducers in the major winter wheat-producing areas to seed 20 percent ofthe 2011 <strong>crop</strong>. By October 3, fifty-three percent of the wheat was in theground, on par with last year but slightly behind the 5-year average.Emergence advanced to 22 percent complete by week’s end, 4 percentagepoints behind last year <strong>and</strong> 3 points behind the 5-year average.Emergence was most advanced in Washington, where warm <strong>weather</strong> <strong>and</strong>adequate soil moisture levels have provided ideal germination conditionsduring the past several weeks.Cotton: Nationwide, bolls were opening on 87 percent of this year’s cottonacreage, 21 percentage points—or 16 days—ahead of last year <strong>and</strong> 13 pointsahead of the 5-year average. Harvest was most advanced <strong>and</strong> well ahead ofboth last year <strong>and</strong> the average pace throughout the Delta. Nationally, 25percent of the <strong>crop</strong> was harvested by week’s end, 15 percentage pointsahead of last year <strong>and</strong> 7 points ahead of the 5-year average. In Texas,harvest had just begun on the Southern High Plains, while producers on theNorthern High Plains were busy applying defoliants with expectations ofstarting harvest within the next few weeks. Overall, 56 percent of the cotton<strong>crop</strong> was reported in good to excellent condition, up slightly from last week<strong>and</strong> 9 percentage points better than the same time last year.Sorghum: By week’s end, 77 percent of the nation’s sorghum <strong>crop</strong> wasat or beyond the mature stage, 25 percentage points ahead of last year <strong>and</strong>13 points ahead of the 5-year average. Warm <strong>weather</strong> continued topromote a rapid maturity pace in most of the major sorghum-producingareas of the country. Harvest advanced 7 points during the week, leavingprogress—at 39 percent complete—9 percentage points ahead of last year<strong>and</strong> slightly ahead of the 5-year average. In Texas, harvest was justbeginning on the Northern High Plains, while producers in the CoastalBend were waiting for their fields to dry out before continuing harvest.Overall, 60 percent of the sorghum <strong>crop</strong> was reported in good to excellentcondition, down slightly from last week but 11 percentage points betterthan the same time last year.Rice: Producers had harvested 78 percent of this year’s rice <strong>crop</strong> byOctober 3, eighteen percentage points ahead of last year <strong>and</strong> 6 pointsahead of the 5-year average. Harvest continued at a slow pace inCalifornia, with overall progress 51 percentage points behind last year <strong>and</strong>39 points behind the average.Small Grains: By October 3, ninety-four percent of this year’s barley<strong>crop</strong> was harvested, 5 percentage points behind both last year <strong>and</strong> the 5-year average. Improved <strong>weather</strong> conditions <strong>and</strong> 6 days suitable forfieldwork allowed producers in Montana time to harvest 8 percent of their<strong>crop</strong>, but overall progress remained 15 percentage points behind last year<strong>and</strong> 17 points behind the average.Nationally, 95 percent of the spring wheat <strong>crop</strong> was harvested by week’send, 2 percentage points behind last year <strong>and</strong> 4 points behind the 5-yearaverage. In Montana, producers harvested 16 percent of their <strong>crop</strong> duringthe week.Other Crops: Peanut harvest advanced to 24 percent complete byOctober 3, nine percentage points ahead of last year <strong>and</strong> 5 points ahead ofthe 5-year average. Excessive rainfall in North Carolina <strong>and</strong> Virginialimited harvest to 4 percent or less, leaving overall progress behind theaverage pace. Overall, 48 percent of the peanut <strong>crop</strong> was reported in goodto excellent condition, up slightly from last week but 22 percentage pointsbelow the same time last year.Sunflower producers had harvested 3 percent of this year’s <strong>crop</strong> byweek’s end, slightly behind last year <strong>and</strong> 2 percentage points behind the 5-year average. Overall progress was 3 percentage points behind theaverage in all estimating states except Colorado.Sugarbeet harvest advanced 15 points during the week to 30 percentcomplete by October 3. This was 12 percentage points ahead of lastyear <strong>and</strong> 10 points ahead of the 5-year average. Producers in Minnesota<strong>and</strong> North Dakota, the two largest sugarbeet-producing states, utilized 4<strong>and</strong> 6 days suitable, respectively, to harvest 18 <strong>and</strong> 22 percent of their<strong>crop</strong>.
16 Weekly Weather <strong>and</strong> Crop Bulletin October 5, 2010Crop Progress <strong>and</strong> ConditionWeek Ending October 3, 2010Weekly U.S. Progress <strong>and</strong> Condition Data provided by USDA/NASSCorn Percent Mature Corn Percent Harvested Soybeans Percent DroppingLeavesPrev Prev Oct 3 5-Yr Prev Prev Oct 3 5-YrYear Week 2010 Avg Year Week 2010 Avg Prev Prev Oct 3 5-YrCO 60 55 79 75 CO 19 9 19 16 Year Week 2010 AvgIL 39 97 98 80 IL 5 57 74 31 AR 56 62 71 65IN 48 94 98 75 IN 5 46 64 18 IL 59 80 91 83IA 68 91 97 83 IA 3 8 19 9 IN 76 89 95 86KS 87 93 98 92 KS 29 54 69 48 IA 88 75 90 91KY 85 96 99 95 KY 35 80 90 60 KS 73 54 73 78MI 35 90 96 73 MI 2 19 30 10 KY 72 84 93 78MN 34 79 92 74 MN 1 2 4 6 LA 85 89 95 90MO 77 90 96 89 MO 27 42 60 54 MI 74 86 96 85NE 59 78 90 76 NE 6 10 18 13 MN 93 90 97 96NC 100 100 100 100 NC 76 87 91 81 MS 72 87 95 89ND 21 71 89 70 ND 0 0 2 4 MO 57 44 64 67OH 43 85 90 71 OH 4 24 36 8 NE 89 81 92 90PA 51 69 81 74 PA 16 30 35 28 NC 36 38 49 45SD 54 67 84 76 SD 2 2 7 10 ND 90 81 96 97TN 92 99 100 98 TN 34 93 96 75 OH 86 88 95 93TX 90 91 92 94 TX 72 64 68 78 SD 95 84 99 97WI 31 63 83 63 WI 0 8 19 8 TN 71 84 91 8218 Sts 54 85 93 79 18 Sts 9 27 37 21 WI 70 72 88 86<strong>The</strong>se 18 States planted 92% <strong>The</strong>se 18 States harvested 92% 18 Sts 77 77 88 85of last year's corn acreage. of last year's corn acreage. <strong>The</strong>se 18 States planted 95%of last year's soybean acreage.Soybeans Percent HarvestedCotton Percent Bolls OpeningCotton Percent HarvestedPrev Prev Oct 3 5-YrYear Week 2010 Avg Prev Prev Oct 3 5-Yr Prev Prev Oct 3 5-YrAR 17 33 42 32 Year Week 2010 Avg Year Week 2010 AvgIL 5 22 50 28 AL 61 84 88 84 AL 0 22 32 13IN 8 41 63 22 AZ 89 85 94 94 AZ 24 15 18 20IA 18 7 38 37 AR 75 98 99 91 AR 3 39 55 23KS 16 7 19 18 CA 78 50 70 71 CA 3 0 0 3KY 9 18 38 16 GA 71 92 95 80 GA 2 12 17 9LA 56 67 76 71 KS 40 70 85 48 KS 0 0 1 1MI 3 17 35 17 LA 92 99 100 98 LA 15 69 75 40MN 17 6 29 36 MS 83 97 99 94 MS 1 51 71 32MS 39 65 77 67 MO 56 95 100 85 MO 0 31 50 21MO 10 4 13 14 NC 88 91 97 91 NC 3 11 15 7NE 24 9 32 29 OK 80 88 95 79 OK 3 0 11 3NC 0 4 4 3 SC 84 81 88 81 SC 10 10 18 9ND 12 3 28 40 TN 71 95 97 91 TN 1 26 47 18OH 9 29 43 20 TX 59 68 80 64 TX 17 14 16 21SD 14 3 25 26 VA 77 71 84 92 VA 6 12 20 11TN 8 29 46 24 15 Sts 66 78 87 74 15 Sts 10 19 25 18WI 3 4 23 15 <strong>The</strong>se 15 States planted 99% <strong>The</strong>se 15 States harvested 99%18 Sts 14 17 37 28 of last year's cotton acreage. of last year's cotton acreage.<strong>The</strong>se 18 States harvested 95%of last year's soybean acreage.
October 5, 2010 Weekly Weather <strong>and</strong> Crop Bulletin 17Sorghum Percent MatureCrop Progress <strong>and</strong> ConditionWeek Ending October 3, 2010Weekly U.S. Progress <strong>and</strong> Condition Data provided by USDA/NASSSorghum Percent HarvestedRice Percent HarvestedPrev Prev Oct 3 5-Yr Prev Prev Oct 3 5-Yr Prev Prev Oct 3 5-YrYear Week 2010 Avg Year Week 2010 Avg Year Week 2010 AvgAR 100 100 100 100 AR 64 99 100 86 AR 50 82 89 70CO 68 40 65 62 CO 15 1 4 13 CA 61 5 10 49IL 43 76 88 76 IL 6 32 54 28 LA 93 96 98 96KS 36 52 72 52 KS 4 13 24 15 MS 40 85 95 75LA 100 100 100 100 LA 98 100 100 99 MO 39 83 93 61MO 53 72 81 71 MO 12 25 43 37 TX 98 100 100 99NE 28 45 76 61 NE 2 2 6 7 6 Sts 60 72 78 72NM 14 10 24 19 NM 0 0 3 1 <strong>The</strong>se 6 States harvested 100%OK 38 55 65 48 OK 13 24 34 22 of last year's rice acreage.SD 63 66 86 74 SD 11 2 11 18TX 69 79 85 76 TX 67 60 61 7111 Sts 52 64 77 64 11 Sts 30 32 39 38 Spring Wheat Percent Harvested<strong>The</strong>se 11 States planted 98% <strong>The</strong>se 11 States harvested 98% Prev Prev Oct 3 5-Yrof last year's sorghum acreage. of last year's sorghum acreage. Year Week 2010 AvgID 100 94 97 100MN 99 100 100 100Winter Wheat Percent Planted Winter Wheat Percent Emerged MT 98 65 81 99Prev Prev Oct 3 5-Yr Prev Prev Oct 3 5-Yr ND 94 92 97 99Year Week 2010 Avg Year Week 2010 Avg SD 100 100 100 100AR 9 3 5 7 AR 4 0 1 2 WA 100 100 100 100CA 7 3 5 9 CA 2 0 0 1 6 Sts 97 89 95 99CO 80 65 90 83 CO 46 26 45 50 <strong>The</strong>se 6 States harvested 99%ID 61 35 60 59 ID 16 6 19 17 of last year's spring wheat acreage.IL 6 8 20 14 IL 2 0 1 2IN 5 10 27 14 IN 0 0 4 1KS 49 21 45 53 KS 20 4 12 23 Barley Percent HarvestedMI 26 19 39 31 MI 9 0 0 8 Prev Prev Oct 3 5-YrMO 7 4 11 11 MO 2 1 2 3 Year Week 2010 AvgMT 84 32 65 76 MT 35 6 18 25 ID 99 91 97 100NE 83 69 81 83 NE 49 25 44 50 MN 100 100 100 100NC 2 1 1 3 NC 0 0 0 0 MT 96 73 81 98OH 11 8 30 18 OH 0 0 2 2 ND 100 100 100 100OK 53 30 50 54 OK 25 8 23 25 WA 100 100 100 100OR 47 26 56 43 OR 21 6 20 17 5 Sts 99 91 94 99SD 76 61 76 79 SD 40 27 44 41 <strong>The</strong>se 5 States harvested 79%TX 51 36 54 50 TX 26 9 23 23 of last year's barley acreage.WA 82 72 86 75 WA 56 47 65 4718 Sts 53 33 53 54 18 Sts 26 10 22 25<strong>The</strong>se 18 States planted 89% <strong>The</strong>se 18 States planted 89%of last year's winter wheat acreage.of last year's winter wheat acreage.
18 Weekly Weather <strong>and</strong> Crop Bulletin October 5, 2010Sugarbeets Percent HarvestedCrop Progress <strong>and</strong> ConditionWeek Ending October 3, 2010Weekly U.S. Progress <strong>and</strong> Condition Data provided by USDA/NASSPrev Prev Oct 3 5-Yr Prev Prev Oct 3 5-YrYear Week 2010 Avg Year Week 2010 Avg VP P F G EXID 12 7 11 11 CO 19 NA 24 23 AR 5 20 33 34 8MI 11 21 28 10 KS 4 NA 6 9 IL 3 7 25 48 17MN 21 16 34 24 ND 5 NA 1 4 IN 5 12 29 41 13ND 22 15 37 25 SD 1 NA 1 4 IA 3 6 20 49 224 Sts 18 15 30 20 4 Sts 4 NA 3 5 KS 4 12 34 43 7<strong>The</strong>se 4 States harvested 84% <strong>The</strong>se 4 States harvested 84% KY 16 26 31 24 3of last year's sugarbeet acreage. of last year's sunflower acreage. LA 1 8 27 46 18MI 3 7 20 45 25MN 1 4 11 55 29Peanuts Percent HarvestedMS 7 14 29 38 12Prev Prev Oct 3 5-Yr MO 5 14 31 39 11Year Week 2010 Avg NE 2 4 16 53 25AL 4 10 23 16 NC 10 23 43 22 2FL 29 37 49 33 ND 2 2 10 59 27GA 10 13 19 18 OH 1 9 31 42 17NC 12 9 13 15 SD 1 10 20 50 19OK 5 0 11 7 TN 8 19 32 36 5SC 28 28 42 28 WI 1 3 13 48 35TX 32 21 27 13 18 Sts 3 9 24 46 18VA 8 4 6 15 Prev Wk 4 9 24 46 178 Sts 15 16 24 19 Prev Yr 3 6 24 51 16<strong>The</strong>se 8 States harvested 97%of last year's peanut acreage.Cotton Condition byPercentSunflowers Percent HarvestedSoybean Condition byPercentCorn Condition byPercentVP P F G EXCO 0 6 24 55 15VP P F G EX IL 5 13 29 43 10AL 10 27 38 24 1 IN 4 12 27 44 13AZ 0 0 17 64 19 IA 4 8 21 46 21AR 1 5 28 45 21 KS 3 9 29 48 11CA 0 0 15 55 30 KY 5 15 34 40 6GA 13 22 35 26 4 MI 2 6 16 45 31KS 1 4 23 63 9 MN 1 4 9 53 33LA 1 14 30 51 4 MO 8 17 29 37 9MS 3 9 28 45 15 NE 2 3 13 57 25MO 11 20 27 35 7 NC 17 17 31 28 7NC 3 22 41 31 3 ND 2 3 12 55 28OK 2 9 35 41 13 OH 2 8 24 47 19SC 3 13 31 47 6 PA 6 21 25 37 11TN 1 4 27 58 10 SD 1 8 18 52 21TX 2 7 30 45 16 TN 8 14 31 38 9VA 20 30 34 16 0 TX 10 9 19 45 1715 Sts 4 10 30 43 13 WI 1 3 12 45 39Prev Wk 4 10 31 41 14 18 Sts 4 9 21 46 20Prev Yr 10 13 30 38 9 Prev Wk 4 9 21 47 19Prev Yr 3 6 21 51 19
October 5, 2010 Weekly Weather <strong>and</strong> Crop Bulletin 19Crop Progress <strong>and</strong> ConditionWeek Ending October 3, 2010Weekly U.S. Progress <strong>and</strong> Condition Data provided by USDA/NASSPeanut Condition byPercentPasture <strong>and</strong> Range Condition by PercentWeek Ending Oct 3, 2010VP P F G EX VP P F G EX VP P F G EXAL 15 16 44 23 2 AL 19 40 31 10 0 NH 12 7 19 62 0FL 1 22 20 45 12 AZ 17 10 32 29 12 NJ 0 5 50 40 5GA 6 14 37 36 7 AR 15 34 34 16 1 NM 6 11 24 52 7NC 3 16 59 21 1 CA 5 30 25 40 0 NY 3 19 26 44 8OK 1 2 21 61 15 CO 1 19 46 33 1 NC 8 28 40 23 1SC 0 3 33 56 8 CT 7 35 31 22 5 ND 0 5 27 56 12TX 0 1 10 69 20 DE 7 19 42 29 3 OH 8 26 39 23 4VA 38 37 19 6 0 FL 1 4 25 55 15 OK 5 16 42 34 38 Sts 6 13 33 40 8 GA 10 28 41 19 2 OR 4 19 55 21 1Prev Wk 5 13 35 39 8 ID 2 17 38 43 0 PA 18 25 38 18 1Prev Yr 0 2 28 57 13 IL 5 9 40 41 5 RI 0 0 16 84 0IN 36 29 25 9 1 SC 11 18 49 22 0IA 2 6 27 50 15 SD 2 11 22 53 12KS 5 14 36 42 3 TN 24 25 33 18 0Sorghum Condition byKY 37 29 20 13 1 TX 6 13 34 38 9PercentLA 17 34 34 14 1 UT 1 20 33 42 4VP P F G EX ME 2 7 22 68 1 VT 0 38 51 11 0AR 4 20 55 19 2 MD 17 24 33 25 1 VA 21 32 33 14 0CO 1 5 27 60 7 MA 0 2 69 29 0 WA 10 11 31 45 3IL 2 5 27 54 12 MI 1 14 29 44 12 WV 23 34 37 5 1KS 3 9 29 50 9 MN 0 4 21 56 19 WI 0 3 21 51 25LA 1 1 30 68 0 MS 28 39 27 5 1 WY 1 13 37 41 8MO 2 7 28 57 6 MO 8 11 31 42 8 48 Sts 8 16 32 37 7NE 0 2 25 54 19 MT 2 9 39 41 9NM 0 0 51 41 8 NE 1 3 22 64 10 Prev Wk 8 17 31 37 7OK 1 3 32 49 15 NV 5 12 61 21 1 Prev Yr 9 13 30 40 8SD 1 4 20 61 14TX 2 10 29 52 711 Sts 2 9 29 51 9Prev Wk 2 8 29 53 8Prev Yr 11 10 30 40 9
20 Weekly Weather <strong>and</strong> Crop Bulletin October 5, 2010U.S. Corn ProgressPercent HarvestedOctober 3, 201019[+3]2[-2]7[-3]18[+5]69[+21]4[-2]19[+10]60[+6]19[+11]74[+43]30[+20]64[+46]96[+21]36[+28]90[+30]35[+7]91[+10]Data obtained from preliminary National Agricultural StatisticsService (NASS) <strong>weekly</strong> <strong>crop</strong> progress <strong>and</strong> condition tables68[-10]National ProgressHarvestedChange from 5-year Average37+16TOP ## - Percent Harvested[BOTTOM ##] - Change from 5-year AverageJoint Agricultural Weather Facility (JAWF)56[+13]86[+11]60[+1]U.S. Winter Wheat Progress65[-11]Percent PlantedOctober 3, 201076[-3]39[+8]5[-4]90[+7]81[-2]45[-8]11[0]20[+6]27[+13]30[+12]50[-4]5[-2]1[-2]Data obtained from preliminary National Agricultural StatisticsService (NASS) <strong>weekly</strong> <strong>crop</strong> progress <strong>and</strong> condition tables54[+4]National ProgressPlantedChange from 5-year Average53-1TOP ## - Percent Planted[BOTTOM ##] - Change from 5-year AverageJoint Agricultural Weather Facility (JAWF)
October 5, 2010 Weekly Weather <strong>and</strong> Crop Bulletin 21State Agricultural Summaries<strong>The</strong>se summaries, issued <strong>weekly</strong> through the summer growing season, provide brief descriptions of <strong>crop</strong> <strong>and</strong> <strong>weather</strong> conditions important on a nationalscale. More detailed data are available in Crop Progress <strong>and</strong> Condition Reports published each Monday by NASS State Statistical Offices in cooperationwith the National Weather Service. <strong>The</strong> <strong>crop</strong> reports are available on the Internet through the NASS Home Page on the <strong>World</strong> Wide Web athttp://www.nass.usda.gov.ALABAMA: Days suitable for fieldwork 6.5. Topsoil moisture43% very short, 42% short, 15% adequate, <strong>and</strong> 0% surplus. Corn94% harvested, 49% 2009, 83% avg.; conditions 5% very poor,14% poor, 29% fair, 46% good <strong>and</strong> 6% excellent. Soybeansdropping leaves 75%, 59% 2009, 76% avg.; conditions 9% verypoor, 25% poor, 45% fair, 21% good, 0% excellent. Livestockcondition 2% very poor, 14% poor, 44% fair, 37% good, <strong>and</strong> 3%excellent. Pasture <strong>and</strong> range condition 19% very poor, 40% poor,31% fair, 10% good <strong>and</strong> 0% excellent. Almost the entire state ofAlabama is still considered to be in some sort of drought conditionaccording to the September 28, 2010, U.S. Drought Monitor.Overall, the state is 96.4 percent abnormally dry, with 66.3 percentmoderately dry, 25.2 percent severely dry, <strong>and</strong> 4.4 percentextremely dry. This is compared with 44.4 percent abnormally dryconditions three months ago, <strong>and</strong> no drought conditions one yearago. Daytime highs ranged from 87 degrees in Tuscaloosa <strong>and</strong>Mobile Bates to 78 degrees in S<strong>and</strong> Mountain. Overnight lowsranged from 40 degrees in Hamilton to 58 degrees in Headl<strong>and</strong>.<strong>The</strong> largest amount of precipitation occurred in Troy Municipal with4.16 inches of rain over a period of one day. <strong>The</strong>re was hot, dry<strong>weather</strong> over much of the state, <strong>and</strong> a good, slow, all-day rain isneeded as creeks are dry <strong>and</strong> winter grazing areas need to beplanted. Some rain was received last weekend, but not enough, asmost counties are still short on moisture. Most all of the corn hasbeen harvested, <strong>and</strong> in most cases the yield was very good;however, the dry <strong>weather</strong> <strong>and</strong> hot temperatures took a toll onsoybeans. An early harvest is anticipated because soybeans havea lot of small pods that are not filled out, <strong>and</strong> some plants haveeven dropped their pods. Peanuts are showing a wide ranging yieldwith a lot of the peanuts being harvested as Seg 3’s due to thealpha toxins, which equates to poor quality. Cotton yields areexpected to vary widely across the state. Dry <strong>weather</strong> has causeda lot of the top <strong>crop</strong> on the cotton plant to be lost. Hot temperaturesat night decreased cotton yields even in the irrigated fields becausethey couldn’t be watered enough. Producers are already feedinghay, <strong>and</strong> a shortage is expected this winter.ALASKA:DATA NOT AVAILABLEARIZONA: Temperatures were above normal across the Statefor the week ending October 3, ranging from 3 degrees abovenormal at Parker to 14 degrees above normal at Gr<strong>and</strong> Canyon<strong>and</strong> Prescott. <strong>The</strong> highest temperature of the week was 111degrees at Yuma. <strong>The</strong> lowest reading at 36 degrees occurred atGr<strong>and</strong> Canyon. Precipitation was recorded in 9 of the 22 stationsthis week. Roll received the least at 0.01 inches of precipitation <strong>and</strong>Prescott received the most at 0.87 inches. Cotton bolls opening isat 94 percent complete, ahead of last year’s 89 percent but thesame as the 5-year average. Cotton conditions are mostly good toexcellent. Harvesting remains active in the Yuma area. Most alfalfais in fair to good condition. Harvesting is active on over threequartersof the State’s acreage. Range <strong>and</strong> pasture conditions varyfrom very poor to excellent, depending on location.ARKANSAS: Days suitable for fieldwork 6.9. Topsoil moisture33% very short, 39% short, 28% adequate. Subsoil moisture 32%very short, 40% short, 28% adequate. Corn 99% harvested, 77%2009, 91% avg. Rice 100% ripe, 88% 2009, 95% avg. Soybeans84% yellowing, 77% 2009, 81% avg.; 59% mature, 36% 2009, 49%avg. Dry conditions were good for harvesting last week, but therewere reports of dust causing machinery fires in pickers <strong>and</strong>combines. Harvest continued for corn, cotton, rice, <strong>and</strong> soybeans.Some producers were preparing their fields for next season orwinter wheat. Late season soybeans were still being irrigated inmany parts of the state. Livestock were mostly in fair to goodcondition last week. Pasture <strong>and</strong> range <strong>and</strong> hay <strong>crop</strong> conditionswere mostly poor to fair. Some farmers were seeding cool seasonforages to their pastures while others were waiting for moremoisture. More cattle producers began feeding hay last week, butsome producers were reported as reducing herd size to lessen thefeeding burden.CALIFORNIA: Rice harvest was ongoing. Cotton fields were inthe final stages of harvest preparation with many fields in theprocess of defoliation. Alfalfa <strong>and</strong> Sudan grass continued to be cut<strong>and</strong> baled. <strong>The</strong> last alfalfa cuttings of the season took place inNorthern California, while areas of the San Joaquin Valley rangedfrom the sixth to seventh cutting. Potato harvest progressed inSiskiyou County. Sunflower harvest slowed in Sutter County.Harvest started in corn fields for grain in San Joaquin County. Cornsilage harvest continued throughout the State. Harvested silagefields were being prepared for winter grain planting in the SanJoaquin Valley. Early planted small grain fields were germinating.<strong>The</strong> apple <strong>and</strong> fig harvests were ongoing in the Central Valley asthe pear harvest neared completion. Valencia oranges continued tobe picked in the Central Valley <strong>and</strong> along the southern coast. <strong>The</strong>lemon harvest along the southern coast was completed while lightpicking continued in the desert region. <strong>The</strong> table grape harvest wasongoing in the San Joaquin Valley while the raisin <strong>and</strong> wine grapeharvests neared completion. Several fields of globe table grapeswere covered with plastic to allow for later harvesting in KernCounty. <strong>The</strong> olive harvest began in the San Joaquin Valley. Plantswere harvested <strong>and</strong> shipped from strawberry nurseries in SiskiyouCounty. Post-harvest irrigation was ongoing in orchards. Shaking<strong>and</strong> harvesting of almonds in the Central Valley was ongoing.Harvesting of early variety walnuts continued in the Central Valleyas harvesting began for some later varieties. <strong>The</strong> full-scalepistachio harvest started as early harvesting was nearingcompletion. Irrigation <strong>and</strong> pest control was ongoing in pecanorchards. Kern County reported carrots being harvested <strong>and</strong> fallasparagus being cut. Tulare County reported cucumbers, peppers,tomatoes, eggplant, sweet corn <strong>and</strong> squash harvest continued. InFresno County, processing tomatoes, garlic <strong>and</strong> onion harvestwinding down <strong>and</strong> winter vegetables being planted. StanislausCounty reported tomatoes <strong>and</strong> melons still being harvested. SanJoaquin County continued harvest of watermelons, melons,cucumbers, <strong>and</strong> pumpkins. Sutter County reported continued fieldwork <strong>and</strong> ground preparation, as well as continued harvest ofprocessing tomatoes <strong>and</strong> honeydew melons. Siskiyou Countyreported dehydrator onion harvest started, <strong>crop</strong> looks good eventhough hampered by late season problems. Rangel<strong>and</strong> forage <strong>and</strong>non-irrigated pasture conditions ranged from fair to poor. Irrigatedpastures were in good shape <strong>and</strong> quality. Ranchers continuedsupplemental feeding as range continued to deteriorate. Bees weremoving from vineseed fields in Sutter County.COLORADO: Days suitable for field work 6.9. Topsoil moisture34% very short, 42% short, 24% adequate, 0% surplus. Subsoilmoisture 16% very short, 40% short, 43% adequate, 1% surplus.Barley 100% harvested, 100% 2009, 100% avg.; condition 2%poor, 21% fair, 66% good, 11% excellent. Spring wheat 99%harvested, 85% 2009, 96% avg.; condition 1% very poor, 3% poor,24% fair, 60% good, 12% excellent. Dry Beans 93% cut, 82%2009, 85% avg., 75% harvested, 58% 2009, 60% avg.; condition
22 Weekly Weather <strong>and</strong> Crop Bulletin October 5, 20104% very poor, 10% poor, 38% fair, 46% good, 2% excellent. Dryonions 85% harvested, 77% 2009, 81% avg.; condition 1% verypoor, 1% poor, 15% fair, 65% good, 18% excellent. Sugarbeets19% harvested, 34% 2009, 15% avg.; condition 4% poor, 16% fair,57% good, 23% excellent. Summer potatoes 95% harvested, 75%2009, 81% avg.; condition 2% poor, 8% fair, 77% good, 13%excellent. Fall potatoes 72% harvested, 67% 2009, 59% avg.;condition 1% poor, 14% fair, 59% good, 26% excellent. Alfalfa 92%3rd cutting, 76% 2009, 90% avg., 41% 4th cutting, 18 2009, 28%avg.; condition 4% poor, 28% fair, 52% good, 16% excellent.Sunflowers 24% harvested, 19% 2009, 23% avg.; condition 1%very poor, 4% poor, 34% fair, 52% good, 9% excellent. Corn Silage95% harvested, 81% 2009, 88% avg. Most of Coloradoexperienced above average temperatures with little to noprecipitation arriving last week according to USDA, NASS ColoradoField Office.DELAWARE: Days suitable for fieldwork 3.6. Topsoil moisture0% very short, 2% short, 68% adequate, 30% surplus. Subsoilmoisture 5% very short, 20% short, 68% adequate, 7% surplus.Hay supplies 2% very short, 10% short, 65% adequate, 23%surplus. Other hay fourth cutting 54%, 32% 2009, 20% avg.Alfalfa hay fourth cutting 62%, 92% 2009, 72% avg. Pasturecondition 7% very poor, 19% poor, 42% fair, 29% good, 3%excellent. Corn condition 7% very poor, 41% poor, 38% fair, 12%good, 2% excellent; 100% mature,88% 2009, 96% avg.;harvested for grain 86%, 31% 2009, 55% avg.; harvested forsilage 100%, 90% 2009, 77% avg. Soybean condition 15% verypoor, 14% poor, 46% fair, 22% good, 3% excellent; turning color97%, 69% 2009, 76% avg.; dropping leaves 64%, 31% 2009,51% avg.; 7% harvested, 1% 2009, 6% avg. Barley 25% planted,16% 2009, 19% avg. Winter wheat 33% planted, 0% 2009, 3%avg.; 28% emerged, 0% 2009, 0% avg. Cantaloupes 100%harvested, 100% 2009, 99% avg. Cucumbers 100% harvested,100% 2009, 99% avg. Lima Beans 89% harvested, 88% 2009,75% avg. Snap beans 100% harvested, 99% 2009, 100% avg.Sweet corn 100% harvested, 99% 2009, 98% avg. Tomatoes99% harvested, 99% 2009, 99% avg. Watermelons 100%harvested, 100% 2009, 99% avg. Apples 83% harvested, 74%2009, 63% avg. Storms rolled through this week, too late for Corn<strong>and</strong> Soybeans but will help the cover <strong>crop</strong>s that have beenplanted. <strong>The</strong> added moisture will help pasture <strong>and</strong> hay fieldsrecover for the winter but will offer little hope to soybeans.FLORIDA: Topsoil moisture 3% very short, 25% short, 68%adequate, 4% surplus. Subsoil moisture 2% very short, 25% short,66% adequate, 7% surplus. Peanut 49% harvested, 29% 2009,33% 5-yr avg.; condition 1% very poor, 22% poor, 20% fair, 45%good, 12% excellent. Low soil moisture hindered forage growth.Rains from Tropical Storm Nicole delayed sugarcane harvesting.South growers preparing l<strong>and</strong> for fall vegetables. Cucumbers <strong>and</strong>squash harvest began. Moving through market avocados,cucumbers, okra, squash. Citrus drought conditions severe inIndian River County, moderate in surrounding counties. Growingconditions good across remainder of citrus region. Culturalpractices general grove work, tree removal, irrigation, groundspraying of fall miticide, care of young trees. Pasture feed 1% verypoor, 4% poor, 25% fair, 55% good, 15% excellent. Cattle condition2% poor, 20% fair, 55% good, 23% excellent. Panh<strong>and</strong>le pasturecondition very poor to excellent, most poor to fair. Pasture conditionlow due to previous long, dry spell. Summer pasture conditiondeclined seasonally from cooler nighttime <strong>weather</strong>, shorter days.Small grains for winter forage planting activity increased. Cattlecondition poor to excellent, most fair to good. Supplemental hayfed. North pasture condition fair to good, most good. Cattlecondition mostly good. Central pasture condition poor to excellent,most fair to good. Some insect damage on pasture. Cattle conditionmostly good. Southwest pastures condition poor to excellent, mostgood. Cattle condition poor to excellent. Statewide cattle conditionpoor to excellent, most good.GEORGIA: Days suitable for fieldwork 4.6. Topsoil moisture 7%very short, 27% short, 59% adequate, 7% surplus. Soybeans 9%very poor, 19% poor, 44% fair, 26% good, 2% excellent; droppingleaves 50%, 42% 2009, 42% avg.; 2% harvested, 1% 2009, 1%avg. Sorghum 3% very poor, 18% poor, 39% fair, 39% good, 1%excellent; harvested for grain 37%, 19% 2009, 37% avg. Hay 10%very poor, 24% poor, 46% fair, 19% good, 1% excellent. Pecans2% very poor, 5% poor, 42% fair, 42% good, 9% excellent. Winterwheat 5% planted, 3% 2009, 3% avg. Peanuts dug 32%, 21%2009, 30% avg. Pecans 1% harvested, 1% 2009, 0% avg. Ryeplanted for all purposes 11%, 20% 2009, 16% avg. Other smallgrains planted 13%, 13% 2009, 11% avg. Precipitation waswidespread with the statewide <strong>weekly</strong> total averaging nearly twoinches. Daily average high temperatures were in the mid 70's tolower 80’s. Low temperatures were in the lower 50's to lower 60’s.Half of the soybean <strong>crop</strong> has dropped leaves <strong>and</strong> the harvest isunderway. Over one third of the sorghum has been harvested.Most of the cotton bolls are open, <strong>and</strong> 17 percent of the cotton hasbeen harvested. <strong>The</strong> first fields of winter wheat have been planted.Nearly a third of peanuts have been dug <strong>and</strong> 19 percent has beenharvested. Rye <strong>and</strong> Oats are being planted. Other activities for theweek included routine care of livestock <strong>and</strong> cutting hay.HAWAII: Days suitable for fieldwork 7. Soil moisture was atshort to adequate levels. Rainfall for the northern isl<strong>and</strong>s was good<strong>and</strong> much improved over previous weeks. Early in the week, therewas little rain for most areas with partly cloudy skies <strong>and</strong> light <strong>and</strong>variable trades. As the week progressed showers, some heavy attimes, moved across the isl<strong>and</strong>s, with the northern isl<strong>and</strong>sreceiving the greatest amount of precipitation early in the week.Over the weekend, the Isl<strong>and</strong> of Hawaii also received a goodamount of rain. Rainfall over the week led to a slight overallincrease in the Waimanalo irrigation system on Oahu. <strong>The</strong> Isl<strong>and</strong> ofMolokai as well as the Isl<strong>and</strong> of Hawaii showed minor decreases intheir irrigation system levels. <strong>The</strong> Drought Monitor indicationsshifted, indicating more intense drought on Kauai as extreme [D3]drought levels exp<strong>and</strong>ed slightly in the southern areas of theIsl<strong>and</strong>. No major changes in <strong>crop</strong> conditions.IDAHO: Days suitable for field work 6.6. Topsoil moisture 6%very short, 28% short, 66% adequate, 0% surplus. Field cornharvested for silage 43%, 79% 2009, 76% avg. Onions 84%harvested, 93% 2009, 82% avg. Potato vines killed 97%, 98%2009, 99% avg. Potatoes 38% harvested, 50% 2009, 46% avg.Oats harvested for grain 99%, 100% 2009, 99% avg. Dry beans67% harvested, 93% 2009, 89% avg. Peaches 97% harvested,99% 2009, 100% avg. Plums <strong>and</strong> prunes harvested 97%, 99%2009, 97% avg. Alfalfa hay 3rd cutting harvested 93%, 89% 2009,95% avg.; 4th cutting harvested 52%, 58% 2009, 70% avg.Irrigation water supply 1% very poor, 5% poor, 28% fair, 57% good,9% excellent. Potato condition 0% very poor, 7% poor, 16% fair,57% good, 20% excellent. Sugarbeets 11% harvested, 12% 2009,11% avg. <strong>The</strong> Caribou County extension reports warm <strong>weather</strong>helped farm operators during harvest. Franklin County extensionreports that some corn harvests are delayed due to maturity <strong>and</strong>moisture issues. Winter wheat planting <strong>and</strong> emergence is at 60 <strong>and</strong>19 percent complete, respectively. Potato harvest is at 38 percentcomplete. This is 12 percentage points behind last year <strong>and</strong> 8percentage points behind the 5 year average.ILLINOIS: Days suitable for fieldwork 6.3. Topsoil moisture 7%very short, 26% short, 63% adequate, 4% surplus. Soybeans 97%turning yellow, 84% 2009, 94% avg. Sorghum 98% coloring, 89%2009, 96% avg. Last week was cool <strong>and</strong> dry for much of the state,allowing harvest to continue at an exceptional rate. With harvestprogressing, many producers have started fall tillage, fertilizerapplications, <strong>and</strong> wheat seeding. Temperatures averaged 57degrees across the state, 4.4 degrees below average. Precipitationaveraged .14 inches, .54 inches below normal. Activities harvestingcorn, soybeans, <strong>and</strong> sorghum, seeding wheat, fall tillage, <strong>and</strong>
October 5, 2010 Weekly Weather <strong>and</strong> Crop Bulletin 23fertilizer application.INDIANA: Days suitable for fieldwork 6.4. Topsoil moisture 50%very short, 36% short, 14% adequate. Subsoil moisture 43% veryshort, 42% short, 15% adequate. Corn 98% mature, 48% 2009,75% avg.; 64% harvested, 5% 2009, 18% avg. Moisture in cornharvested averaged 15.5%. Corn condition 4% very poor, 12%poor, 27% fair, 44% good, 13% excellent. Soybeans sheddingleaves 95%, 76% 2009, 86% avg.; 63% harvested, 8% 2009, 22%avg. Moisture in soybeans harvested averaged 10.5%. Soybeancondition 5% very poor, 12% poor, 29% fair, 41% good, 13%excellent. Pasture condition 36% very poor, 29% poor, 25% fair,9% good, 1% excellent. Tobacco 95% harvested, 79% 2009, 82%avg. Winter wheat 27% planted, 5% 2009, 14% avg.; 4% emerged,0% 2009, 1% avg. Temperatures ranged from 1o to 7o belownormal with a low of 36o <strong>and</strong> a high of 85o. Total precipitationranged from 0.04 inches to 0.81 inches. Weekend rain showers didlittle to alleviate the drought conditions in many central <strong>and</strong>southern portions of the state. In fact, precipitation amounts insome southeastern counties were only 20 to 25 percent of normalduring September. Multiple field <strong>and</strong> combine fires have beenreported this fall, <strong>and</strong> currently 62 counties have active burn bansin place. Harvest of both corn <strong>and</strong> soybeans forged ahead at ablistering pace. Corn harvest continued moving ahead of theprevious record of 57 percent established in 1991. Soybeanharvest is approaching the record pace which occurred in 1987when 65 percent had been harvested. Other activities included. falltillage, spreading lime <strong>and</strong> fertilizer, seeding cover <strong>crop</strong>s, hauling<strong>and</strong> spreading manure <strong>and</strong> taking care of livestock.IOWA: Days suitable for fieldwork 6.3. Topsoil moisture 0% veryshort, 2% short, 85% adequate, <strong>and</strong> 13% surplus. Subsoil moisture0% very short, 2% short, 80% adequate, <strong>and</strong> 18% surplus. Cornlodging 76% none, 19% light, 4% moderate, <strong>and</strong> 1% heavy. Eardroppage rated 82% none, 15% light, 3% moderate, <strong>and</strong> 0%heavy. Soybean lodging 80% none, 16% light, 4% moderate, <strong>and</strong>0% heavy. Soybeans shattering 78% none, 15% light, 5%moderate, <strong>and</strong> 2% heavy. After a week of wet <strong>weather</strong>, almost theentire state escaped rainfall this week, with Eastern Iowa receivingonly trace amounts. Throughout Iowa, conditions were mostlysunny <strong>and</strong> breezy during the week, ideal for drying <strong>crop</strong>s <strong>and</strong> farmground. Farmers entered fields early in the week <strong>and</strong> capitalized onfavorable <strong>weather</strong> conditions through the weekend.KANSAS: Days suitable for fieldwork 6.6. Topsoil moisture 11%very short, 23% short, 64% adequate, <strong>and</strong> 2% surplus. Subsoilmoisture 9% very short, 26% short, 64% adequate, 1% surplus.Sunflowers ray flowers dry 89%, 85% 2009, 91% avg.; bractsyellow 71%, 70% 2009, 80% avg.; turned brown 42%, 26% 2009,39% avg.; condition 1% very poor, 5% poor, 28% fair, 58% good,8% excellent. Alfalfa 4th cutting 86%, 72% 2009, 80% avg. Feedgrain supplies 5% short, 87% adequate, <strong>and</strong> 8% surplus. Hay <strong>and</strong>forage supplies 1% very short, 5% short, 82% adequate, <strong>and</strong> 12%surplus. Stock water supplies are 2% very short, 9% short, 86%adequate, <strong>and</strong> 3% surplus. Dry conditions <strong>and</strong> warm daytimetemperatures covered the State in the early part of last week, whilethe State also experienced the lowest nighttime temperatures yetthis fall season as a cold front moved through on Saturday. A fewareas even saw their first frost. Highs were in the 80’s <strong>and</strong> 90’s,reaching 97 degrees Fahrenheit at the <strong>weather</strong> station in GardenCity. Night time lows reached into the 30’s <strong>and</strong> 40’s. It was dry allweek across Kansas as all but three counties reported noprecipitation for the week, <strong>and</strong> those three reported 0.1 inch orless. Excellent harvest <strong>weather</strong> <strong>and</strong> good drying conditions allowedfarmers to rapidly get their <strong>crop</strong>s out of the field last week. At thesame time, the dry conditions have caused some of the wheatproducers to delay planting until moisture conditions improve. Cornis about 2 weeks ahead of the average <strong>and</strong> 5 weeks ahead of2009’s delayed harvest. Sorghum is about 1 week ahead of theaverage <strong>and</strong> 5 weeks ahead of last year’s delayed harvest.KENTUCKY: Days suitable for field work 6.5. Topsoil moisture65% very short, 25% short, 10% adequate. Subsoil moisture 65%very short, 24% short, 11% adequate. Soybeans 88% sufficientlymature to be safe from frost damage. Burley tobacco cut 95%, darktobacco cut 92%. Housed tobacco condition 4% very poor, 12%poor, 35% fair, 44% good, 5% excellent. Winter wheat seeded12%, 4% last year, 8% average. Temperatures in Kentuckyaveraged 4 degrees below normal. <strong>The</strong> week brought cooler<strong>weather</strong>, but little to no rain. Farmers are still contending withabnormally dry conditions as they proceed through the fall harvest.LOUISIANA: Days suitable for fieldwork 7.0. Soil moisture 35%very short, 46% short; <strong>and</strong> 19% adequate. Hay 99% secondcutting, 96% 2009, <strong>and</strong> 98% avg. Pecans 5% harvested, 3% 2009,<strong>and</strong> 2% avg.; Sugarcane 99% planted, 94% 2009, 90% avg.; 4%harvested, 1% 2009, <strong>and</strong> 1% avg.; 1% very poor, 10% poor, 27%fair, 38% good, 24% excellent. Sweet potatoes 40% harvested,22% 2009, 34% avg.; 4% very poor, 6% poor, 31% fair, 58% good,1% excellent. Livestock 5% very poor, 18% poor, 39% fair, 35%good, 3% excellent. Vegetable 18% very poor, 28% poor, 37% fair,16% good, 1% excellent. Range <strong>and</strong> pasture 17% very poor, 34%poor, 34% fair, 14% good, 1% excellent.MARYLAND: Days suitable for field work 2.7. Topsoil moisture0% very short, 7% short, 78% adequate, 15% surplus. Subsoilmoisture 8% very short, 24% short, 60% adequate, 8% surplus.Hay supplies 5% very short, 32% short, 63% adequate, 0%surplus. Other hay fourth cutting 35%, 21% 2009, 29% avg. Alfalfahay fourth cutting 71%, 82% 2009, 79% avg. Pasture condition17% very poor, 24% poor, 33% fair, 25% good, 1% excellent. Corncondition 18% very poor, 23% poor, 32% fair, 23% good, 4%excellent; 96% mature, 85% 2009, 92% avg.; harvest for grain68%, 29% 2009, 47% avg.; harvested for silage 94%, 88% 2009,85% avg. Soybean condition 5% very poor, 28% poor, 37% fair,25% good, 5% excellent; turning color 84%, 69% 2009, 77% avg.;dropping leaves 58%, 37% 2009, 53% avg.; 12% harvested, 3%2009, 8% avg. Barley 54% planted, 50% 2009, 42% avg. Winterwheat 38% planted, 16% 2009, 17% avg.; 8% emerged, 0% 2009,0% avg. Cantaloupes 100% harvested, 100% 2009, 98% avg.Cucumbers 100% harvested, 99% 2009, 99% avg. Lima beans90% harvested, 86% 2009, 78% avg. Snap beans 100% harvested,100% 2009, 98% avg. Sweet corn 100% harvested, 99% 2009,97% avg. Tomatoes 99% harvested, 99% 2009, 98% avg.Watermelons 100% harvested, 100% 2009, 98% avg. Apples 73%harvested, 80% 2009, 80% avg. Storms rolled through this week,too late for Corn <strong>and</strong> Soybeans but will help the cover <strong>crop</strong>s thathave been planted. <strong>The</strong> added moisture will help pasture <strong>and</strong> hayfields recover for the winter but will offer little hope to soybeans.MICHIGAN: Days suitable for fieldwork 5. Topsoil 5% very short,14% short, 72% adequate, 9% surplus. Subsoil 5% very short, 29%short, 63% adequate, 3% surplus. Barley 100% harvested, 100%2009, 100% avg. Potatoes 47% harvested, 47% 2009, 54% avg. Allhay 1% very poor, 4% poor, 25% fair, 49% good, 21% excellent.Third cutting hay 91%, 86% 2009, 90% avg. Fourth cutting hay59%, 41% 2009, 40% avg. Dry beans 89% harvested, 55% 2009,65% avg. Apples 77% harvested, 38% 2009, 51% avg.Precipitation ranged from 0.29 inches to 0.32 inches UpperPeninsula <strong>and</strong> varied from 0.18 inches to 1.14 inches LowerPeninsula. Temperatures Upper Peninsula averaged 1 degreebelow normal, while temperatures Lower Peninsula ranged from 2to 4 degrees below normal. Another cool <strong>and</strong> windy week withscattered precipitation. <strong>The</strong>re was report of having first frost overweekend Upper Peninsula, <strong>and</strong> reports of very light scattered frostLower Peninsula. Harvest of <strong>crop</strong>s continued, along with winterwheat planting, <strong>and</strong> fall plowing. Some fall manure hauling began.Harvesting of field <strong>crop</strong>s continued mid to southern counties whileharvest began counties farther north. Progress remained ahead ofnormal. Signs of lodging slowed harvest <strong>and</strong> reduced yieldpotential in Gratiot <strong>and</strong> Saginaw Counties. Overall, corn harvest
24 Weekly Weather <strong>and</strong> Crop Bulletin October 5, 2010progress considerably ahead of average. Soybean harvest beganin counties along Lake Michigan <strong>and</strong> going well. Farmers insoutheastern counties continued to be well ahead of normal. Wheatseed was planted as soon as possible after soybeans harvested.Apple harvest continued. Honeycrisp harvest has ended. Cortl<strong>and</strong>,Empire, Jonathan, <strong>and</strong> Red <strong>and</strong> Golden Delicious continued to beharvested. Idared harvest has begun west central; harvest ofNorthern Spy has started southeast <strong>and</strong> west central. Fruit colorcontinued to improve southeast <strong>and</strong> northwest. Harvest of juicegrapes has ended. Harvest of fall raspberries continued. Coolertemperatures slowed development of warm season vegetablessoutheast while frost southwest brought production of these <strong>crop</strong>sto end. Growers continued to remove stakes, black plastic <strong>and</strong> driptape preparation for planting of fall cover <strong>crop</strong>s. Crops harvestedincluded pumpkins, gourds, hard squash, carrots, winter squash,yellow squash, zucchini for fresh <strong>and</strong> processing, cucumbers forpickles, potatoes, snap beans, peppers, cool season <strong>crop</strong>s, <strong>and</strong>tomatoes for fresh <strong>and</strong> processing. Wholesale pumpkin harvest allbut complete, throughout Michigan, with growers beginning directsales. Pumpkins are of excellent quality, but smaller than averagesize. Quality of cool season <strong>crop</strong>s high. Sweet corn, peppers, snapbeans, <strong>and</strong> tomatoes still available Macomb County area.MINNESOTA: Days suitable for fieldwork 4.6. Topsoil moisture53% adequate, 47% surplus. Pasture condition 4% poor, 21% fair,56% good, 19% excellent. Corn 97% silage harvested, 78% 2009,90% avg. Soybeans 88% mature, 66% 2009, 83% avg.; 13%moisture content, 13% 2009, 13% avg. Potatoes 76% harvested,71% 2009, 73% avg. Dry Beans 85% harvested, 67% 2009, 79%avg. Sunflower condition 2% very poor, 4% poor, 20% fair, 60%good, 14% excellent. Sugarbeet condition 1% very poor, 2% poor,6% fair, 58% good, 33% excellent. Dry <strong>weather</strong> prevailed thisweek, allowing harvest activity to resume in higher, drier areas.Precipitation amounts were light for most reporting stations. <strong>The</strong>northern third of the state reported accumulation from 0.10 inch inthe northwest to 0.30 inch in the northeast. Several reporters notedthat fields dried rapidly <strong>and</strong> fieldwork has resumed across the state,even in southern areas that received heavy rainfall the previousweek. Temperatures were above normal for the week. Daytimehighs were in the 70s throughout most of the state with overnightlows falling into the 20s in some areas. <strong>The</strong> average statewidetemperature was 54.4 degrees.MISSISSIPPI: Days suitable for fieldwork 6.5. Soil moisture 54%very short, 38% short, <strong>and</strong> 8% adequate. Corn 100% harvested,82% 2009, 94% avg. Cotton 99% open bolls, 83% 2009, 94% avg.;71% harvested, 1% 2009, 32% avg. Peanuts 40% harvested, 2%2009, 22% avg.; 0% very poor, 0% poor, 17% fair, 62% good, 21%excellent. Rice 95% harvested, 40% 2009, 75% avg. Sorghum100% mature, 100% 2009, 99% avg.; 100% harvested, 56% 2009,87% avg. Soybeans 99% turning color, 90% 2009, 97% avg.; 95%shedding leaves, 72 2009, 89% avg.; 77% harvested, 39% 2009,67% avg. Hay (harvested-warm) 98%, 96% 2009, 97% avg. Wheat10% planted, 0% 2009, 4% avg.; 5% emerged, 0% 2009, 1% avg.Sweetpotatoes 72% harvested, 26% 2009, 52% avg. Cattle 3%very poor, 14% poor, 50% fair, 28% good, 5% excellent. Pasture28% very poor, 39% poor, 27% fair, 5% good, 1% excellent.Another week of dry <strong>weather</strong> helped farmers harvesting row <strong>crop</strong>s,but stymied fall planting of wheat <strong>and</strong> forage. <strong>The</strong> cotton harvest ismoving forward rapidly, around a month ahead of last year’s rainyharvest. <strong>The</strong> first of the winter wheat has begun to emerge.MISSOURI: Days suitable for fieldwork 6.4. Topsoil moisture 5%very short, 13% short, 74% adequate <strong>and</strong> 8% surplus. Subsoilmoisture 6% very short, 11% short, 78% adequate, <strong>and</strong> 5%surplus. Corn moisture harvest 16.4%. On-farm storage availability19% short, 77% adequate, 4% surplus. Pasture condition 8% verypoor, 11% poor, 31% fair, 42% good, <strong>and</strong> 8% excellent. Supplies ofhay <strong>and</strong> other roughages 2% very short, 6% short, 79% adequate,<strong>and</strong> 13% surplus. Stock water supplies 1% very short, 7% short,86% adequate, <strong>and</strong> 6% surplus. Fair <strong>weather</strong> conditions allowedfarmers back into their fields for a very good week of harvest.Statewide, rainfall averaged 0.02 of an inch during the week.Temperatures were 3 to 7 degrees below normal across the State.MONTANA: Days suitable for field work 6.4. Topsoil moisture1% very short, 21% last year; 12% short, 37% last year; 78%adequate, 42% last year; 9% surplus, 0% last year. Subsoilmoisture 2% very short, 25% last year; 13% short, 42% last year;83% adequate, 33% last year; 2% surplus, 0% last year. Barley81% harvested, 96% last year. Corn harvested for grain 5%, 5%last year. Corn chopped for silage 60%, 83% last year. Corncondition 0% very poor, 1% last year; 2% poor, 2% last year; 20%fair, 30% last year; 62% good, 50% last year; 16% excellent, 17%last year. Dry beans 70% harvested, 94% last year. Durum wheat83% harvested, 90% last year. Lentils 98% harvested, 99% lastyear. Mustard seed harvested 78%, 97% last year. Oats 94%harvested, 100% last year. Spring wheat 81% harvested, 98% lastyear. Alfalfa hay harvested second cutting 95%, 100% last year.Other hay harvested second cutting 87%, 88% last year.Sugarbeets 21% harvested, 8% last year. Sugarbeets condition 1%very poor, 0% last year; 4% poor, 1% last year; 22% fair, 19% lastyear; 58% good, 35% last year; 15% excellent, 45% last year.Winter wheat 65% planted, 84% last year. Winter wheat 18%emerged, 35% last year. Range <strong>and</strong> Pasture feed condition 2%very poor, 14% last year; 9% poor, 34% last year; 39% fair, 36%last year; 41% good, 14% last year; 9% excellent, 2% last year.Cattle <strong>and</strong> calves moved from summer ranges 35%, 44% last year.Sheep <strong>and</strong> lambs moved from summer ranges 38%, 45% last year.A high pressure system brought high temperatures <strong>and</strong> only tracesof precipitation across Big Sky country for the week ending October3rd. West Glacier received six hundredths of one inch of rain, asonly stations in the northwest <strong>and</strong> northcentral districts reportedany precipitation. High temperatures were mainly in the mid toupper 80s <strong>and</strong> low 90s, with lows in the mid to upper 30s. Hardin<strong>and</strong> Huntley both reached 94 degrees for the <strong>weekly</strong> high, <strong>and</strong>Wisdom had the low temperature for the week at 24 degrees.NEBRASKA: Days suitable for fieldwork 6.7. Topsoil moisture11% very short, 32% short, 56% adequate, 1% surplus. Subsoilmoisture 2% very short, 33% short, 64% adequate, 1% surplus.Irrigated corn conditions 84% good or excellent. Dryl<strong>and</strong> cornconditions 79% good or excellent. Dry beans dropping leaves 97%,99% 2009, 94% avg.; 83% harvested, 81% 2009, 72% avg. Alfalfa2% very poor, 4% poor, 17% fair, 61% good, 16% excellent; 4thcutting 83% complete, 78% 2009, 77% avg. Proso millet 72%harvest, 46% 2009 <strong>and</strong> 67% avg. No rainfall during the week madefor ideal harvest conditions as progress advanced ahead of lastyear <strong>and</strong> average. Soybean harvest was in full swing, reaching theone-third mark, with good advancement in corn also. Winter wheatseeding in the Panh<strong>and</strong>le approached 95 percent, however,emergence has been spotty due to dry soils. <strong>The</strong> first fields ofsugarbeets have been harvested. Cattle were being moved intocorn stalks as fields became available.NEVADA: Days suitable for fieldwork 7. Unseasonably warm<strong>weather</strong> dominated the week. <strong>The</strong> week ended with wet <strong>weather</strong>moving across the State. Temperatures warmed throughout theweek <strong>and</strong> ranged from 10 to 15 degrees above normal. Severalrecord high temperatures were set during the week. Las Vegasrecorded a high of 103 degrees. Most stations recorded a high forthe week in the 90’s. Winnemucca recorded a low of 35 degrees.All stations recorded some precipitation. Winnemucca recorded0.97 inches of rain. Rangel<strong>and</strong> forages continued to show seasonaldecline. Alfalfa third cutting was in full swing. Potato harveststarted. Onion harvest was also underway. Winter wheat plantingstarted in some areas. Cattle <strong>and</strong> sheep were being rotated to bestutilize available range. Grasshopper populations remained high inthe North but damage to <strong>crop</strong>s remained limited Main farm <strong>and</strong>ranch activities: hay harvest <strong>and</strong> shipping, weed <strong>and</strong> pest control,
October 5, 2010 Weekly Weather <strong>and</strong> Crop Bulletin 25irrigation, livestock movement, <strong>and</strong> equipment maintenance.NEW ENGLAND: Days suitable for field work 4.4. Topsoilmoisture 2% very short, 7% short, 64% adequate, <strong>and</strong> 27%surplus. Subsoil moisture 4% very short, 11% short, 75%adequate, <strong>and</strong> 10% surplus. Pasture condition 3% very poor, 21%poor, 41% fair, 34% good, <strong>and</strong> 1% excellent. Maine Potatoes 60%harvested, 25% 2009, 60% average. Massachusetts Potatoes 80%harvested, 85% 2009, 75% average. Rhode Isl<strong>and</strong> Potatoes 70%harvested; 75% 2009, 90% average. Maine Oats 100% harvested,100% 2009, 95% average. Maine Barley 100% harvested, 100%2009, 99% average. Field Corn 80% harvested, 45% 2009, 60%average. Sweet Corn 95% harvested, 99% 2009, 99% average.Second Crop Hay 99% harvested, 99% 2009, 99% average. ThirdCrop Hay 90% harvested, 85% 2009, 80% average. Apples 70%harvested, 60% 2009, 65% average. Peaches 100% harvested,100% 2009, 100% average. Pears 90% harvested, 85% 2009, 85%average. Massachusetts Cranberries 25% harvested, 15% 2009,25% average; Fruit Size average; condition good. <strong>The</strong> week beganwith light rains <strong>and</strong> temperatures ranging from the upper 50s to low70s. On Tuesday, high temperatures rose into the 70s throughoutmuch of New Engl<strong>and</strong> <strong>and</strong> persisted until the weekend. Heavyrains <strong>and</strong> wind were experienced Thursday <strong>and</strong> Friday across thesix States. Nighttime temperatures for the week ranged from thelow 50s to mid 60s. <strong>The</strong> weekend brought average to belowaverage daytime temperatures ranging from the mid 50s to upper60s with cloudy skies. Nighttime temperatures ranged from the low30s in Maine <strong>and</strong> New Hampshire to the low 50s in southernStates. <strong>The</strong> week’s total precipitation ranged from 0.91 to 5.70inches. Farmers were harvesting apples, pears, cranberries,grapes, potatoes, sweet corn <strong>and</strong> fall vegetables, hay <strong>and</strong> fieldcorn. Farmers were also disking, cleaning fields, applying manure,<strong>and</strong> planting cover <strong>crop</strong>s.NEW JERSEY: Days suitable for field work 4.0. Topsoil moisture5% short, 65% adequate, 30% surplus. Subsoil moisture 10%short, 80% adequate, 10% surplus. <strong>The</strong>re were measurableamounts of rainfall during the week in all localities. Temperatureswere above normal across the Garden State. Soil conditionsimproved for planting fall-cover <strong>crop</strong>s. Corn <strong>and</strong> soybeanharvesting continued. Farmers finished third-cuttings of alfalfa hay<strong>and</strong> continued cutting other hay varieties. Rainfall aided pasture regrowth.Fall-vegetables nearly all harvested included eggplant,cucumbers, peppers, <strong>and</strong> tomatoes. Pumpkin <strong>and</strong> sweet potatoharvest progressed. Apple growers continued picking fruit, sprayingpesticides, <strong>and</strong> maintaining orchards.NEW MEXICO: Days suitable for fieldwork 6.9. Topsoil moisture9% very short, 37% short <strong>and</strong> 54% adequate. Wind damage 7%light; with 25% of cotton <strong>crop</strong>s damaged by wind to date. No freezedamage this week. Hail damage 1%; with 7% of cotton, 5% of corn,4% of sorghum, <strong>and</strong> 4% of peanuts damaged by hail to date.Alfalfa 6% very poor, 13% poor, 11% fair, 47% good, <strong>and</strong> 23%excellent; 99% of the fourth cutting complete, 71% of the fifthcutting complete, 42% of the sixth cutting complete <strong>and</strong> 2% of theseventh cutting complete. Cotton 7% poor, 35% fair, 38% good,<strong>and</strong> 20% excellent; 68% bolls opening. Corn 13% fair, 77% good<strong>and</strong> 10% excellent; 93% dent <strong>and</strong> 66% mature; 84% harvested forsilage <strong>and</strong> 16% harvested for grain. Irrigated sorghum 9% fair, 82%good <strong>and</strong> 9% excellent; 93% coloring <strong>and</strong> 19% mature. Drysorghum 74% fair, 19% good <strong>and</strong> 7% excellent; 87% coloring, 26%mature <strong>and</strong> 4% harvested for grain. Total sorghum 51% fair, 41%good <strong>and</strong> 8% excellent; 89% coloring, 24% mature <strong>and</strong> 3%harvested. Irrigated winter wheat 1% poor, 33% fair, 62% good <strong>and</strong>4% excellent; 83% planted <strong>and</strong> 66% emerged. Dry winter wheat3% poor, 33% fair <strong>and</strong> 64% good; 89% planted <strong>and</strong> 68% emerged.Total winter wheat 2% poor, 33% fair, 63% good, <strong>and</strong> 2% excellent;87% planted <strong>and</strong> 67% emerged. Peanuts 21% fair <strong>and</strong> 79% good;24% harvested. Lettuce 37% poor, 19% fair <strong>and</strong> 44% good; 98%planted. Chile 8% poor, 47% fair, 21% good <strong>and</strong> 24% excellent;93% harvested green <strong>and</strong> 8% harvested red. Apples 100% good;63% harvested. Pecans 2% fair, 53% good <strong>and</strong> 45% excellent.Cattle 1% very poor, 6% poor, 21% fair, 66% good <strong>and</strong> 6%excellent. Sheep 14% very poor, 16% poor, 16% fair, 53% good<strong>and</strong> 1% excellent. Range <strong>and</strong> pasture 6% very poor, 11% poor,24% fair, 52% good <strong>and</strong> 7% excellent. <strong>The</strong> week started withtemperatures near record highs <strong>and</strong> 5 to 20 degrees above normal.A cold front on Thursday over the eastern plains droppedtemperatures back closer to normal. A Trough of low pressure <strong>and</strong>another cold front moved in over the weekend bringing someshowers <strong>and</strong> thunderstorms around the state.NEW YORK: Days suitable for fieldwork 3.9. Soil moisture 2%short, 51% adequate <strong>and</strong> 47% surplus. Pastures were rated 3%very poor, 19% poor, 26% fair, 44% good, <strong>and</strong> 8% excellent.Soybean condition 2% poor, 15% fair, 44% good, 39% excellent.Hay 8% poor, 23% fair, 48% good, 21% excellent. Corn 1% poor,13% fair, 52% good, 34% excellent. Potatoes 67% harvested, 71%2009, 73% average. Alfalfa 3rd cutting 98%, 95% 2009, 94%average. Clover-timothy 3rd cutting 90%. Silage corn 84%, 48%2009, 63% average. Grain corn 13%. Dry beans 42%, 65% 2009,43% average. Soybeans 14%, 5% 2009, 11% average. Applecondition 13% fair, 67% good, 20% excellent. Grapes 2% poor, 6%fair, 54% good, 38% excellent. Pears 9% poor, 13% fair, 78%good. Peaches 4% poor, 19% fair, 76% good, 1% excellent. Apples74% harvested, 43% 2009, 55% average. Grapes 52%, 39% 2009,51% average. Pears 98%, 97% 2009, 89% average. Peaches100%. <strong>The</strong> Lake Erie grape region, Niagara harvest finished upwhile Concord harvest continued in full swing. In Long Isl<strong>and</strong>vineyards, growers are monitoring fruit integrity, flavors <strong>and</strong>phenolic ripeness to gauge the optimal time to harvest. Tomatoharvest 95%, 93% average. Onions 80%, 92% average. Sweetcorn 97%, 91% 2009, 95% average. Snap beans 97%, 96%average. Cabbage 85%, 88% 2009, 83% average. Tomatocondition 6% poor, 20% fair, 57% good, 17% excellent. Lettuce18% fair, 34% good, 48% excellent. Onions 24% fair, 49% good,27% excellent. Sweet corn 1% poor, 18% fair, 66% good, 15%excellent. Snap beans 13% poor, 23% fair, 42% good, 22%excellent. Cabbage 20% fair, 63% good, 17% excellent.Temperatures were slightly below average West of Syracuse <strong>and</strong>above average across the rest of the state. Precipitation was wellabove average across much of the state due to rain storms.NORTH CAROLINA: Days suitable for field work 2.0. NorthCarolina made national headlines with the rainfall that wereceived last week from Tropical Statewide soil moisture levelschanged dramatically <strong>and</strong> are rated at 7% short, 53% adequate<strong>and</strong> 40% surplus. Average temperatures were below normalranging from 56 to 75 degrees. <strong>The</strong> rain halted all field work inthe coastal part of the state <strong>and</strong> the full impact from the storm isyet to be determined.NORTH DAKOTA: Days suitable for fieldwork 6.4. Topsoilmoisture 4% short, 83% adequate, <strong>and</strong> 13% surplus. Subsoilmoisture 5% short, 81% adequate, <strong>and</strong> 14% surplus. Durum wheat89% harvested, 92% 2009, 98% average. Canola 95% harvested,93% 2009, 98% average. Corn for silage 72% chopped, 48% 2009,77% average. Dry edible beans 75% cut <strong>and</strong> beyond, 52% 2009,81% average; 65% harvested, 38% 2009, 67% average. Flaxseed79% harvested, 76% 2009, 92% average. Potatoes 95% vineskilled, 87% 2009, 95% average; 65% dug, 54% 2009, 72%average. Sugarbeet condition 2% very poor, 2% poor, 7% fair, 52%good, 37% excellent. Sunflower 96% bracts turned yellow, 90%2009, 97% average; 65% bracts turned brown, 56% 2009, 76%average; condition 1% very poor, 7% poor, 23% fair, 56% good,13% excellent. Stockwater supplies 4% short, 87% adequate, 9%surplus. Favorable <strong>weather</strong> allowed producers to make goodharvest progress during the week. Warmer temperatures <strong>and</strong> dryconditions provided farmers across the state with a much neededreprieve from the precipitation.
26 Weekly Weather <strong>and</strong> Crop Bulletin October 5, 2010OHIO: Days suitable for field work 5.2. Topsoil moisture 29%very short, 35% short, 35% adequate, 1% surplus. Corn 2% verypoor, 8% poor, 24% fair, 47% good, 19% excellent; 90% mature,43% 2009, 71% avg. Corn for grain 36% harvested 4% 2009, 8%avg. Livestock condition 0% very poor, 3% poor, 17% fair, 68%good, 12% excellent. Range <strong>and</strong> pasture 8% very poor, 26% poor,39% fair, 23% good, 4% excellent. Soybeans 1% very poor, 9%poor, 31% fair, 42% good, 17% excellent; 95% dropping leaves,86% 2009, 93% avg.; 80% mature, 48% 2009, 63% avg. Soybeansfor grain 43% harvested, 9% 2009, 20% avg. Winter wheat 30%planted, 11% 2009, 18% avg.; 2% emerged, 0% 2009, 2% avg.,Alfalfa hay 83% 4th cutting, 71% 2009, 77% avg. Other hay 95%3rd cutting, 81% 2009, 87% avg. Grapes 71% harvested, 64%2009, 61% avg. Fall <strong>and</strong> winter apples 67% harvested, 52% 2009,51% avg. Potatoes 92% harvested, 72% 2009, 81% avg.Processing tomatoes 91% harvested, 84% 2009, 87% avg.OKLAHOMA: Days suitable for fieldwork 6.7. Topsoil moisture14% very short, 39% short, 47% adequate. Subsoil moisture 15%very short, 41% short, 44% adequate. Wheat seedbed prepared90% this week, 81% last week, 92% last year, 93% average. Ryeseedbed prepared 97% this week, 91% last week, 97% last year,96% average; 73% planted this week, 50% last week, 82% lastyear, 78% average; 42% emerged this week, N/A last week, 45%last year, 46% average. Oats seedbed prepared 72% this week,67% last week, 76% last year, 74% average; 21% planted thisweek, 10% last week, 21% last year, 25% average; 5% emergedthis week, N/A last week, 8% last year, 6% average. Corn 92%harvested this week, 76% last week, 52% last year, 72%average. Sorghum coloring 96% this week, 90% last week, 93%last year, 87% average. Soybean condition 2% very poor, 10%poor, 43% fair, 37% good, 8% excellent; mature 48% this week,36% last week, 38% last year, 47% average; 19% harvested thisweek, 9% last week, 12% last year, 20% average. Peanuts 81%mature this week, 63% last week, 60% last year, 66% average;dug 26% this week, 8% last week, 15% last year, 16% average.Alfalfa condition 3% very poor, 8% poor, 44% fair, 42% good, 3%excellent; 4th cutting 95% this week, 92% last week, 93% lastyear, 95% average; 5th cutting 54% this week, 46% last week,46% last year, 58% average. Other hay condition 3% very poor,11% poor, 46% fair, 37% good, 3% excellent; 2nd cutting 83%this week, 80% last week, 74% last year, 76% average. Livestockcondition 5% poor, 32% fair, 55% good, 8% excellent. Pasture<strong>and</strong> range condition 5% very poor, 16% poor, 42% fair, 34%good, 3% excellent. Livestock conditions continue to rate mostlyin the good to fair range. Prices for feeder steers less than 800pounds averaged $111 per cwt. Prices for heifers less than 800pounds averaged $103 per cwt.OREGON: Days suitable for fieldwork 6.6. Topsoil moisture 2%very short, 34% short, 63% adequate, 1% surplus. Subsoilmoisture 3% very short, 46% short, 51% adequate, 0% surplus.Winter wheat 56% planted, 49% 2009, 43% avg.; 20% emerged,24% 2009, 17% average. Corn condition 0% very poor, 1% poor,29% fair, 70% good, 0% excellent. Range <strong>and</strong> Pasture 4% verypoor, 19% poor, 55% fair, 21% good, 1% excellent. Weather;Warm <strong>and</strong> dry conditions with some moisture reported. Hightemperatures ranged from 72 degrees in B<strong>and</strong>on to 94 degrees inMedford. Nine stations reported temperatures in the 90s. Lowtemperatures ranged from 28 degrees in Lorella to 54 degrees inPortl<strong>and</strong>. Twelve out of forty-three stations reported measurableprecipitation. <strong>The</strong> Astoria/Clatsop station reported the most with0.23 inches, followed by the Christmas Valley station with 0.18inches. Field Crops; <strong>The</strong> warmer <strong>weather</strong> allowed for goodharvesting conditions as grain, potatoes, mint, <strong>and</strong> alfalfa harvestcontinued. Wet soils across most parts of the state had driedenough for seeding of fall grain to resume. Field cultivation <strong>and</strong>fertilization were also active throughout the state. Fog was reportedto slow activities in the morning throughout the southern part of thestate. Warm <strong>and</strong> dry conditions in Marion County allowed lateharvesting of red clover seed, while Clackamas County reported aneed for more sunshine to finish red clover seed harvest. Redclover harvest was almost completed in Washington County.Washington County reported that field corn was slow in maturing,while Malheur County had started harvesting field corn.Vegetables; Vegetable harvest continued to progress across theState. Pumpkins began showing up in farmer’s markets. Cole <strong>crop</strong>scontinued to thrive <strong>and</strong> are reportedly set for a good harvestseason. Fruits <strong>and</strong> Nuts; Grape growers in the Willamette Valleycontinued to hold out on harvest in hopes of good <strong>weather</strong> toimprove brix levels. Grape harvest was getting started in otherparts of the state. Apples, pears, <strong>and</strong> prunes continued to bepicked, with some varieties finishing up, <strong>and</strong> others just gettingstarted. Fall berries also continued to be harvested. More hazelnutsstarted falling this week, <strong>and</strong> harvest has begun in some areas.<strong>The</strong> <strong>crop</strong> was reported to be good, but with lower yields expectedcompared to last year. Nurseries <strong>and</strong> Greenhouses; Nurseries inWashington County continued irrigating, digging <strong>and</strong> shipping smallshrubs. Some seasonal greenhouses were shutting down.Livestock, Range <strong>and</strong> Pasture; Livestock were being moved tofresher pastures <strong>and</strong> grain stubble. Cattle were doing well as fallcalving continued.PENNSYLVANIA: Days suitable for fieldwork 3. Soil moisture5% very short, 7% short, 52% adequate, <strong>and</strong> 36% surplus. Fallplowing 39%, 46% pr. yr., 50% avg. Corn 95% dent, 86% pr. yr.,95% 5yr.; 81% mature, 51% pr. yr, 74% 5 yr. avg.; 35%harvested, 16% pr. yr., 28% 5yr. avg. Corn silage harvest 91%,67% pr. yr., 84% 5 yr. avg. Barley 57% planted, 58% pr. yr., 58%avg.; 38% emerged, 35% pr. yr., 31% 5 yr. avg. Winter wheat32% planted, 33% pr. yr., 34% 5 yr. avg.; 16% emerged, 14% pr.yr., 13% 5 yr. avg. Soybeans 18% harvested, 4% pr. yr., 10% 5yr.avg. Potatoes 72% harvested, 75% pr. yr., 80% avg. Alfalfa fourthcutting 88%, 67% pr. yr., 72% avg. Apples 81% harvested, 68%pr. yr., 64% avg. Grapes 40% harvested, 34% pr. yr., 31% avg.Corn <strong>crop</strong> condition, 6% very poor, 21% poor, 25% fair, 37%good, 11% excellent. Soybeans condition 7% very poor, 15%poor, 24% fair, 43% good, 11% excellent. Quality of hay made7% very poor, 18% poor, 18% fair, 48% good, <strong>and</strong> 9% excellent.Pasture condition 18% very poor, 25% poor, 38% fair, 18% good,1% excellent. Primary field activities were harvesting vegetables,apples, corn silage, soybeans, <strong>and</strong> cutting hay. <strong>The</strong> primary<strong>crop</strong>s planted were wheat, barley, <strong>and</strong> alfalfa seedings.SOUTH CAROLINA: Days suitable for fieldwork 4.8. Soilmoisture 7% very short, 18% short, 63% adequate, 12% surplus.Corn 5% very poor, 21% poor, 41% fair, 31% good, 2% excellent;100% matured, 100% 2009, 100% avg.; 97% harvested, 98%2009, 97% avg. Soybeans 5% very poor, 19% poor, 41% fair,34% good, 1% excellent; pods set 98%, 100% 2009, 98% avg.;leaves turning color 48%, 43% 2009, 39% avg.; leaves dropped25%, 16% 2009, 14% avg.; 11% mature, 10% 2009, 6% avg.; 3%harvested, 3% 2009, 1% avg. Livestock condition 2% very poor,5% poor, 30% fair, 63% good, 0% excellent. Winter wheat 12%planted, 8% 2009, 4% avg.; 2% emerged, 0% 2009, 0% avg.Oats 8% planted, 6% 2009, 3% avg. Tobacco 100% harvested,100% 2009, 100% avg.; stalks destroyed 88%, 97% 2009, 90%avg. Winter grazings planted 28%, 30% 2009, 33% avg. Wintergrazings 3% emerged, 0% 2009, 1% avg. <strong>The</strong> remnants ofTropical Storm Nicole brought substantial amounts of rain <strong>and</strong>high winds to the coastal counties <strong>and</strong> the eastern midl<strong>and</strong>s. <strong>The</strong>storm system helped to further alleviate dry conditions but didbring some damage to the agriculture industry. Farmers reported20% of light to moderate damage <strong>and</strong> 8% of heavy to severedamage resulting from the storm. Cooler temperatures were alsoobserved. For the first time since July 4th, South Carolina’saverage temperature for the weeklong period was below normal.<strong>The</strong> heavy rainfall stalled harvesting activities for many growers,but the moisture is expected to encourage the planting of smallgrains <strong>and</strong> winter grazings. Soil moisture conditions improved this
October 5, 2010 Weekly Weather <strong>and</strong> Crop Bulletin 27past week. Nearly all corn had been harvested by the end of theweek. Eighty-eight percent of cotton had bolls open <strong>and</strong> 18% ofthe <strong>crop</strong> had been harvested, ahead of historical numbers. Somecotton was exposed to water damage in the areas that receivedthe heaviest rainfall. Peanut harvest remained well ahead of theaverage for this time of year. Some growers were concernedabout the quality of their peanuts due to the increased moisture.Forty-eight percent of soybeans had turned color <strong>and</strong> one quarterof the <strong>crop</strong> had dropped leaves. Soybeans were just beginning tobe harvested. Conditions showed some signs of improvement. Alltobacco had reportedly been harvested for 2010. Eighty-eightpercent of tobacco stalks had been destroyed. Winter grazingshad just begun to emerge. Twelve percent of winter wheat hadbeen planted <strong>and</strong> 2% had emerged. Livestock conditionsimproved. Likewise, pastures improved.SOUTH DAKOTA: Days suitable for fieldwork 6.4. Topsoilmoisture 5% very short, 12% short, 64% adequate, 19% surplus.Subsoil moisture 5% very short, 14% short, 59% adequate, 22%surplus. Corn silage harvested 91%, 68% 2009, 88% avg.Sorghum silage harvested 95%, 68% 2009, 87% avg. Soybeans88% mature, 53% 2009, 74% avg. Sunflower bracts yellow 95%,90% 2009, 94% avg. Sunflower 49% mature, 38% 2009, 42%avg. Sunflower 1% very poor, 6% poor, 31% fair, 52% good, 10%excellent. Alfalfa hay 3rd cutting harvested 90%, 86% 2009, 88%avg.; 5% very poor, 5% poor, 21% fair, 61% good, 8% excellent.Feed supplies 1% very short, 3% short, 80% adequate, 16%surplus. Stock water supplies 5% short, 75% adequate, 20%surplus. Cattle condition 1% poor, 9% fair, 69% good, 21%excellent. Sheep condition 1% very poor, 1% poor, 10% fair, 56%good, 32% excellent. An ideal week of dry <strong>weather</strong> helpedproducers make progress on row <strong>crop</strong> harvest <strong>and</strong> dry out fields.Major farm activities included harvesting row <strong>crop</strong>s, cuttingsilage, seeding winter wheat, <strong>and</strong> general care of livestock.TENNESSEE: Days suitable for fieldwork 6. Topsoil moisture35% very short, 41% short, <strong>and</strong> 24% adequate. Subsoil moisture33% very short, 44% short, <strong>and</strong> 23% adequate. Pastures 24%very poor, 25% poor, 33% fair, 18% good. Tobacco 90% burleyharvested, 78% 2009, 88% average; 92% dark fire-curedharvested, 85% 2009, 91% average. Two separate cold frontsmoved through Tennessee last week, bringing coolertemperatures but little-to-no precipitation. By week’s end, almostall corn acreage had been harvested. Both cotton <strong>and</strong> soybeanharvests were nearing the halfway point about two weeks aheadof the five-year average. Wheat seeding was underway last weekwith 10 percent of the <strong>crop</strong> seeded. Some producers are waitingto seed until soil moisture levels become favorable. Pasturesreceived little in the way of substantial rainfall last week <strong>and</strong>remain rated in mostly poor-to-fair condition, <strong>and</strong> many cattleproducers continue to feed hay. Temperatures averaged 2 to 4degrees below normal last week. East Tennessee receivedslightly above normal precipitation, while Middle <strong>and</strong> WestTennessee were mostly dry.TEXAS: Topsoil moisture was mostly short to adequate acrossthe state. Cotton condition was mostly fair to good statewide.Statewide, corn condition was mostly fair to good. Sorghumcondition was mostly fair to good statewide. Statewide, soybeancondition was mostly fair to good. Statewide, peanut conditionwas mostly good to excellent. Range <strong>and</strong> pasture condition wasmostly fair to good. Most areas of the state received 0.01 to 1.0inch of rain. In the Northern High Plains some wheat is being drysowed in hopes of rain. Early planted fields have emerged but agood general rain is still needed. In the Northern Low Plainscotton producers are beginning to defoliate <strong>and</strong> expect to beharvesting within the next few weeks. Corn harvest in NorthernHigh Plains is well under way with some excellent yields onirrigated <strong>and</strong> dryl<strong>and</strong> corn being reported. In the Northern HighPlains sorghum is being harvested. Some early yields reportsindicate average to above average yields. Generally, livestockremained in good condition throughout the state.UTAH: Days suitable for field work 7. Subsoil moisture 9%very short, 52% short, 39% adequate, 0% surplus. Winter wheat,planted for harvest next year 75%, 71% 2009, 65% avg. Oatsharvested (grain) 98%, 99% 2009, 99% avg. Corn dough 96%,98% 2009, 97% avg.; 70% dent, 99% 2009, 94% avg.; 40%mature, 74% 2009, 70% avg.; silage, harvested (silage) 58%.Corn condition 1% very poor, 2% poor, 22% fair, 66% good, 9%excellent. Alfalfa hay 3rd cutting 90%, 95% 2009, 98% avg.Onions 50% harvested, 75% 2009, 74% avg. Cattle <strong>and</strong> calvesmoved From summer range 44%, 38% 2009, 46% avg. Cattle<strong>and</strong> calves condition 0% very poor, 0% poor, 7% fair, 71% good,22% excellent. Sheep <strong>and</strong> lambs moved from summer range50%, 50% 2009, 49% avg. Sheep condition 0% very poor, 0%poor, 4% fair, 70% good, 26% excellent. Stock water supplies 4%very short, 18% short, 78% adequate, 0% surplus. Apples 53%harvested, 57% 2009, 57% avg. Peaches 94% harvested, 90%2009, 96% avg. Above average temperatures were experiencedacross the state of Utah last week. Soil moisture contentdecreased from the previous week. Box Elder County producersare busy harvesting silage corn, safflower, alfalfa hay, <strong>and</strong>onions. Most of the <strong>crop</strong>s are producing good yields so far. <strong>The</strong>2011 <strong>crop</strong> of dryl<strong>and</strong> winter wheat is somewhat spotty becausesoil moisture has varied widely from farm to farm <strong>and</strong> there hasbeen little rain in September. Cache County growers continued toenjoy near perfect <strong>weather</strong> for harvesting <strong>crop</strong>s. Corn silage <strong>and</strong>alfalfa hay harvest are in full swing. Winter wheat planting alsocontinues even though there is concern about dry soil conditions.Growers continue to irrigate <strong>crop</strong>s wherever possible. Whereirrigation water is not available, <strong>crop</strong>s are showing obvious signsof stress from a prolonged season with virtually no rain. MorganCounty’s corn <strong>crop</strong> has been disappointing so far this season,due to a short growing season <strong>and</strong> frost damage. <strong>The</strong> alfalfa <strong>crop</strong>was also lighter than normal this year due to the cold spring <strong>and</strong>early frosts in September. Weber County <strong>weather</strong> has stayedwarm <strong>and</strong> dry, allowing corn fields to mature, thus improving thecorn silage <strong>crop</strong> substantially. Corn silage harvest is in full swingright now <strong>and</strong> should be finished in the next couple of weeks.Utah County corn silage harvest is almost complete. Very littlefourth <strong>crop</strong> hay is being cut. Peach harvest was excellent thisyear. In Duchesne County corn <strong>crop</strong> delay continues; manyproducers have just begun harvesting corn silage. Farmers arealso working hard to get the third cutting of alfalfa hay completed.Summit County farmers continue to prepare fields for planting.Box Elder County cattle <strong>and</strong> sheep are coming off of summerranges. Calves are lighter than average this year. In MorganCounty there is still adequate feed on ranges for some livestock.Duchesne <strong>and</strong> Emery County livestock producers have begun toremove livestock from summer ranges. <strong>The</strong> livestock seem to bein very good condition even though much of the feed has begunto dry down. Summit County producers continue to movelivestock off of summer ranges. Lambs <strong>and</strong> calves are in goodcondition <strong>and</strong> are at healthy weights.VIRGINIA: Days suitable for fieldwork 2.6. Topsoil moisture4% very short, 18% short, 55% adequate, 23% Surplus. Subsoilmoisture 29% very short, 30% short, 29% adequate, 12%surplus. Pasture 21% very poor, 32% poor, 33% fair, 14% good.Livestock 2% very poor, 10% poor, 34% fair, 46% good, 8%excellent. Other hay 28% very poor, 33% poor, 27% fair, 11%good, 1% excellent. Alfalfa hay 15% very poor, 18% poor, 40%fair, 23% good, 4% excellent. Corn 94% mature; 93% 2009; 95%5-yr avg.; 85% harvested; 43% 2009; 51% 5-yr avg. Soybeansdropping leaves 76%; 51% 2009; 56% 5-yr avg.; 8% harvested;3% 2009; 5% 5-yr avg.; 17% very poor, 30% poor, 44% fair, 9%good. Winter wheat seeded 14%; 11% 2009; 10% 5-yr avg.Barley seeded 24%; 27% 2009; 34% 5-yr avg. Flue-curedtobacco harvested 70%; 82% 2009; 80% 5-yr avg. Burley tobacco
28 Weekly Weather <strong>and</strong> Crop Bulletin October 5, 2010harvested 94%; 89% 2009; 90% 5-yr avg. Dark Fire-curedtobacco harvested 99%; 100% 2009; 100% 5-yr avg. Peanutsdug 18%; 18% 2009; 24% 5-yr avg. Peanuts combined 6%; 8%2009; 15% 5-yr avg.; 38% very poor, 37% poor, 19% fair, 6%good. Cotton Bolls opening 84%; 77% 2009; 92% 5-yr avg.; 20%harvested; 6% 2009; 11% 5-yr avg.; 20% very poor, 30% poor,34% fair, 16% good. Fall Apples 60% harvested; 64% 2009; 72%5-yr avg. Winter Apples 60%; 35% 2009; 28% 5-yr avg. AllApples 37% poor, 43% fair, 13% good, 7% excellent. Grapes 1%very poor, 1% poor, 19% fair, 57% good, 22% excellent. Oats forGrain Seeded 30%; 24% 2009; 10% 5-yr avg. Much neededrainfall soaked the state <strong>and</strong> restored soil moisture. Most of therain fell steady without heavy downpours. In some areas the rainswere too late to help summer <strong>crop</strong>s, but soil conditions will beready for planting small grains <strong>and</strong> cover <strong>crop</strong>s. Soybean harvest<strong>and</strong> burley tobacco harvest will resume next week in mostcounties. Some peanuts were dug but not combined <strong>and</strong> cottonharvest is in full swing. Some cotton was dropped from bolls dueto the heavy rains in some areas. Vegetable harvest slowedconsiderably. Pastures <strong>and</strong> hayfields should respond well to themuch needed drought relief. Majority of the work was done in thefarmstead due to the wet conditions.WASHINGTON: Days suitable for fieldwork 6.5. Topsoilmoisture conditions 5% very short, 12% short, <strong>and</strong> 68% adequate<strong>and</strong> 15% surplus. Fall activities continued with clean up, repairs,hay hauling <strong>and</strong> the urgent fieldwork of seedbed prep <strong>and</strong> winterwheat seeding. Planting of winter wheat went especially well thisweek due to dry warm <strong>weather</strong>. Despite a small amount of wheatreplanting the winter wheat st<strong>and</strong>s have appeared quickly <strong>and</strong> inexcellent condition. Rain will be needed over the next week tocontinue these early excellent conditions. Spring cereal grainharvest was completed in Lincoln County. Potato harvest wasbetween the early <strong>and</strong> late variety harvest. Field corn producersneed a couple more weeks of dry <strong>and</strong> warm <strong>weather</strong> in order forthe <strong>crop</strong> to fully mature for grain. Christmas tree growers werefinishing up on shearing of Douglas <strong>and</strong> Fraser fir in ThurstonCounty. In the Yakima Valley, vegetable growers were stillbringing in tomatoes, cucumbers, peppers <strong>and</strong> squashes. Appleproducers in the lower Valley were bringing in Granny Smiths,Jonagolds <strong>and</strong> early Red Delicious. Apple producers in the coolerregions of the Yakima Valley were still harvesting Galas, GoldenDelicious, Jonagolds <strong>and</strong> were placing harvest bins in the RedDelicious blocks. As apple harvest continued to be successful formost areas, the Snohomish County <strong>crop</strong> was hurt by the rainyspring which prompted a less than desirable pollination <strong>and</strong> scabproblems. In Pacific County, cranberry growers initiated harvestoperations, with production at below average levels. Raspberrygrowers continued to prune <strong>and</strong> tie in Whatcom County.Pumpkins have colored enough for most U-Pick pumpkin farms toopen for business. Range <strong>and</strong> pasture conditions 10% very poor,11% poor, 31% fair, 45% good <strong>and</strong> 3% excellent. Pasturecontinued to recover well from the midsummer dry-spell. Dairyproducers continued applying liquid manure to forage fields inGray’s Harbor County. Corn harvested for silage was halfwaycompleted, with the eastern part of the State slightly ahead.Cattle were being moved to market throughout the State asneeded.WEST VIRGINIA: Days suitable for field work 5. Topsoilmoisture 12% very short, 44% short <strong>and</strong> 44% adequatecompared with 6% very short, 35% short, 53% adequate <strong>and</strong> 6%surplus last year. Corn conditions 41% very poor, 11% poor, 17%fair <strong>and</strong> 31% good, 81% mature, 42% 2009, 56% 5-yr avg.;harvested for grain 37%, 8% 2009, 14% 5-yr avg. Soybeanconditions 43% very poor, 13% poor, 16% fair <strong>and</strong> 28% good,dropping leaves 95%, 60% 2009, 76% 5-yr avg.; 17% harvested,10% 2009, 11% 5-yr avg. Winter Wheat 8% planted, 40% 2009,25% 5-yr avg. Hay 14% very poor, 12% poor, 39% fair, 33% good<strong>and</strong> 2% excellent. Hay third cutting was 61% complete, 66% in2009, <strong>and</strong> 58% 5-year avg. Apple conditions 50% very poor, 36%poor, 3% fair, 9% good <strong>and</strong> 2% excellent; 58% harvested, 62%2009, 54% 5-yr avg. Cattle <strong>and</strong> calves were 3% very poor, 12%poor, 21% fair, 59% good <strong>and</strong> 5% excellent. Sheep <strong>and</strong> lambswere 13% poor, 33% fair, 51% good <strong>and</strong> 3% excellent. Muchneeded rainfall helped fall pasture regrowth. Farming activitiesincluded brush hogging, feeding hay, marketing calves, balinghay, harvesting field <strong>crop</strong>s <strong>and</strong> apples.WISCONSIN: Days suitable for fieldwork 6.0. Topsoil moisture1% very short, 3% short, 70% adequate, <strong>and</strong> 26% surplus.Average temperatures last week ranged from 2 to 3 degreesbelow normal. Average high temperatures ranged from 64 to 68degrees, while average low temperatures ranged from 39 to 48degrees. Precipitation totals ranged from 0.00 inches in LaCrosse to 0.27 inches in Green Bay. Eighty-three percent of cornacross the state was mature with 19 percent of corn for grainharvested. Corn for silage was reported at 87 percent harvestedstatewide. Soybean leaves turning were 99 percent complete <strong>and</strong>88 percent of soybeans leaves were dropped around the state.Combines began rolling in soybean fields as 23 percent ofsoybeans were reported harvested. Fourth cutting hay wasreported at 75 percent complete. Fall tillage was 16 percentcomplete statewide. A week of sunshine <strong>and</strong> a light breeze lastweek aided many fields to dry out. For some growers, fields driedout enough to allow heavy machinery to enter, however, othersreported fields were still too saturated. Across the northern part ofthe state, reports indicated that floods have receded, but manyare still waiting to assess the resulting damage. Hard frosts werereported across the Northwestern <strong>and</strong> North Central districtswhile light frosts were reported across the southern <strong>and</strong> easternparts of the state. Many reported leaves changing color, cornmazes opening, <strong>and</strong> pumpkins being harvested throughout thestate.WYOMING: Days suitable for field work 7.0. Topsoil moisture15% very short, 46% short, 39% adequate. Subsoil moisture 14%very short, 47% short, 39% adequate. Winter wheat progress81% planted, 70% emerged. Dry beans progress 92%windrowed, 65% combined. Corn progress 94% dented, 58%mature, 26% harvested. Corn for silage 74% harvested.Sugarbeets 18% harvested. Alfalfa harvested 64% third cutting.Winter wheat condition 42% fair, 58% good. Corn condition 1%very poor, 3% poor, 20% fair, 76% good. Sugar beet condition1% poor, 9% fair, 90% good. Alfalfa condition 23% fair, 64%good, 13% excellent. Crop insect infestation 42% none, 37%light, 17% moderate, 4% severe. Cattle moved from summerpastures 28%.Sheep moved from summer pastures 32%.Range<strong>and</strong> pasture condition 1% very poor, 13% poor, 37% fair, 41%good, 8% excellent. Irrigation water supplies 10% very short, 5%short, 79% adequate, 6% surplus. Conditions across much of thestate continue to be very dry <strong>and</strong> unseasonable warm for thistime of the year. Counties such as Albany, Converse, Laramie,Platte, Sweetwater, Uinta <strong>and</strong> Weston are all reporting somevariation of extremely dry fall condition. Uinta County reportedtinder dry range grasses while Albany County reported low waterlevels in rivers <strong>and</strong> streams, making stock water supplies agrowing concern. Current <strong>weather</strong> conditions have also madeworking livestock a very dusty occasion <strong>and</strong> many cattle cattleare now being shipped or moved. Activities harvesting row <strong>crop</strong>s,weaning <strong>and</strong> shipping calves, moving livestock from summerpastures.
October 5, 2010 Weekly Weather <strong>and</strong> Crop Bulletin 29International Weather <strong>and</strong> CropSummarySeptember 26 - October 2, 2010International Weather <strong>and</strong> Crop Highlights <strong>and</strong> Summariesprovided by USDA/WAOBEUROPE: Locally heavy rain continued to hamper small grainharvesting <strong>and</strong> winter <strong>crop</strong> planting.FSU-WESTERN: Wet <strong>weather</strong> provided additional droughtrelief <strong>and</strong> improved prospects for late winter grain planting <strong>and</strong>establishment.FSU-EASTERN: Mostly dry, warm conditions facilitated thefinal stages of spring grain harvesting.MIDDLE EAST: Scattered showers in Turkey provided topsoilmoisture for winter <strong>crop</strong> planting.SOUTH ASIA: Favorably drier <strong>weather</strong> eased wetness for cottonin northern India <strong>and</strong> benefited harvesting.EAST ASIA: A freeze in northeastern China ended the growingseason while aiding drydown of corn <strong>and</strong> soybeans.SOUTHEAST ASIA: Seasonal showers continued to maintainfavorable soil moisture for rice in Thail<strong>and</strong>, Vietnam, <strong>and</strong> thePhilippines.AUSTRALIA: Persistent dryness further reduced <strong>crop</strong> prospectsin Western Australia, while generally favorable <strong>weather</strong> aided <strong>crop</strong>development in southern <strong>and</strong> eastern Australia.ARGENTINA: Soaking rain improved <strong>crop</strong> prospects inpreviously dry western farming areas.BRAZIL: Timely rain benefited a variety of <strong>crop</strong>s in central <strong>and</strong>southeastern Brazil.MEXICO: Seasonal rains tapered off in the north <strong>and</strong> on thecentral plateau, but heavy rain persisted in flooded locations of thesoutheast.CANADIAN PRAIRIES: Unseasonably warm, mostly dry<strong>weather</strong> improved harvest conditions.EASTERN CANADA:fieldwork.Locally heavy rain slowed autumnCOUNTRY CITYSeptember 2010MONTHLY DATA FROM SELECTED FOREIGN CITIESCLIMATE PREDICTION CENTER-NCEP-NWS-NOAA*** DATA NOT AVAILABLETEMPERATURE( C )PRECIPITATION(MM)AVG AVG HI LO DPART DPARTMAX MIN MAX MIN AVG F/NRM TOTAL F/NRMNORWAY OSLO 14 6 18 -1 10 0.7 74 -15FINLAN HELSINKI 14 9 20 2 12 1.6 40 -30UKINGD ABERDEEN 15 9 21 2 12 0.3 36 -37LONDON 19 11 24 5 15 0 36 -20IRELAN DUBLIN 17 10 21 3 13 0.2 106 43ICELAN REYKJAVIK *** *** 16 5 *** *** *** ***DENMAR COPENHAGEN 16 11 20 5 14 0.3 42 -20LUXEMB LUXEMBOURG 17 10 23 5 14 -0.3 62 -11SWITZE ZURICH 18 10 23 6 14 -0.2 82 -9GENEVA 20 9 25 2 15 -0.5 36 -60FRANCE PARIS/ORLY 21 11 26 4 16 -0.7 60 6STRASBOURG 20 9 25 3 15 -0.3 34 -28BOURGES 21 11 27 4 16 0.1 69 6BORDEAUX 24 12 32 6 18 0.7 25 -64TOULOUSE 24 13 33 7 19 0.7 30 -21MARSEILLE 25 14 31 8 20 -0.2 31 -27SPAIN VALLADOLID 26 12 34 5 19 0.6 14 -16MADRID 28 14 34 7 21 0.2 24 1SEVILLE 33 20 39 16 26 1.1 4 -23PORTUG LISBON 27 18 34 15 23 1.6 2 -28GERMAN HAMBURG 17 10 24 2 14 0 105 37BERLIN 18 10 25 5 14 -0.6 89 44DUSSELDORF 18 10 24 6 14 -1.7 66 -2LEIPZIG 17 10 25 5 14 -0.9 140 97DRESDEN 16 9 23 4 13 -1.6 151 101STUTTGART 18 8 25 3 13 -1.6 46 -12NURNBERG 18 8 24 1 13 -1.3 41 -10AUGSBURG 17 7 24 2 12 -2 71 2AUSTRI VIENNA 18 11 24 4 15 -1.4 76 14INNSBRUCK 19 9 24 4 14 -0.1 72 -8CZECHR PRAGUE 17 8 22 3 12 -0.9 78 36POLAND WARSAW 16 9 22 4 13 -0.2 106 59LODZ 16 8 23 3 12 -1.4 69 21KATOWICE 17 8 24 2 12 -1.4 128 72HUNGAR BUDAPEST 19 12 23 7 15 -1 141 98YUGOSL BELGRADE 23 14 30 9 18 0.8 54 2ROMANI BUCHAREST 25 11 32 5 18 0.6 24 -17BULGAR SOFIA 23 11 30 7 17 0.6 44 5ITALY MILAN 24 14 28 8 19 -0.3 81 -6VERONA 24 14 28 8 19 0.1 153 79VENICE 23 14 26 10 19 -0.3 21 -52GENOA *** *** 28 15 *** *** *** ***ROME 26 16 30 9 21 -0.1 6 -66NAPLES 26 16 29 12 21 -0.1 87 -1GREECE THESSALONIKA 27 18 30 14 22 0.4 9 -18LARISSA 28 16 34 12 22 0.5 62 32ATHENS 29 20 33 16 25 0.4 43 40TURKEY ISTANBUL 26 19 31 16 23 1.6 52 20ANKARA 28 12 32 8 20 3.6 2 -13CYPRUS LARNACA 33 22 36 20 27 2 0 -2ESTONI TALLINN 15 9 21 4 12 1.2 55 -21RUSSIA ST.PETERSBURG 15 10 20 4 13 1.6 59 -8LITHUA KAUNAS 16 9 22 1 12 0.4 64 10BELARU MINSK 16 9 23 4 12 0.6 81 17RUSSIA KAZAN 18 10 26 2 14 2.4 47 -1MOSCOW 16 8 25 -1 12 1.1 71 6YEKATERINBURG 16 7 26 -1 12 2 22 -32OMSK 17 6 29 -3 12 1.2 13 -22KAZAKH KUSTANAY 21 7 31 -4 14 2.3 8 -17RUSSIA BARNAUL 18 5 33 -4 11 0.2 16 -20KHABAROVSK 20 9 29 -2 14 0.9 52 -34VLADIVOSTOK 20 14 29 6 17 1.2 42 -95UKRAIN KIEV 20 10 28 7 15 1.5 51 -9LVOV 17 9 23 3 13 -0.2 65 -1KIROVOGRAD 21 10 28 3 16 0.7 85 44ODESSA 21 15 26 11 18 1.1 107 71RUSSIA SARATOV 22 12 37 3 17 4.1 12 -35UKRAIN KHARKOV 21 11 32 5 16 2.3 119 72RUSSIA VOLGOGRAD 24 12 39 3 18 3 24 1ASTRAKHAN 27 14 38 6 20 3 4 -15Based on Preliminary Reports
30 Weekly Weather <strong>and</strong> Crop Bulletin October 5, 2010September 2010COUNTRY CITY TEMPERATUREPRECIPITATION COUNTRY CITY TEMPERATUREPRECIPITATION( C )(MM)( C )(MM)AVG AVG HI LO DPART DPART AVG AVG HI LO DPART DPARTMAX MIN MAX MIN AVG F/NRM TOTAL F/NRM MAX MIN MAX MIN AVG F/NRM TOTAL F/NRMORENBURG 24 8 34 2 16 2.5 14 -13 S AFRI PRETORIA 29 13 33 6 21 2.0 0 -23KAZAKH TSELINOGRAD 20 7 36 -4 14 1.4 14 -20 JOHANNESBURG 25 11 29 5 18 2.3 0 -31KARAGANDA 20 6 34 -4 13 0.9 13 -5 BETHAL 27 8 31 3 17 2.3 0 -30UZBEKI TASHKENT 29 14 38 7 21 1.0 3 -2 DURBAN 25 17 41 14 21 1.9 12 -62TURKME ASHKHABAD 32 15 41 8 23 0.0 12 8 CAPE TOWN 20 10 27 4 15 1.0 26 -16SYRIA DAMASCUS 36 18 40 14 27 3.7 1 *** CANADA TORONTO 21 12 33 6 16 1.1 89 11PAKIST KARACHI 35 26 38 24 30 1.1 59 49 MONTREAL 21 12 34 5 16 1.6 157 66INDIA AMRITSAR 32 23 35 20 28 -0.7 186 109 WINNIPEG 17 6 23 -2 12 -0.8 93 43NEW DELHI 32 25 35 22 28 -1.0 295 176 REGINA 17 6 29 -5 11 -0.6 0 -31AHMEDABAD 34 25 37 22 29 0.3 109 11 SASKATOON 16 5 27 -4 11 -0.7 0 -29INDORE 31 21 34 19 26 0.0 194 41 LETHBRIDGE 17 4 28 -2 11 -1.9 38 -2CALCUTTA 33 26 36 24 30 0.6 324 -16 CALGARY 14 4 25 -1 9 -1.5 62 18VERAVAL 31 25 35 23 28 0.1 185 94 EDMONTON 15 5 27 -4 10 -1.3 51 9BOMBAY 32 25 36 24 29 0.8 241 -106 VANCOUVER 19 12 26 9 15 0.7 166 113POONA 30 22 34 19 26 0.8 103 -42 MEXICO GUADALAJARA *** *** 29 16 *** *** 19 -141BEGAMPET 32 23 34 21 27 0.4 231 93 TLAXCALA 22 12 26 4 17 -0.3 59 -63VISHAKHAPATNAM 32 26 34 23 29 0.5 132 -48 ORIZABA 25 17 29 13 21 1.3 494 136MADRAS 33 25 36 23 29 -0.4 149 9 BERMUD ST GEORGES 28 24 30 22 26 -0.7 236 117MANGALORE 30 23 33 22 27 -0.2 708 421 BAHAMA NASSAU 32 26 35 23 29 1.5 178 17HONGKO HONG KONG INT 32 26 35 24 29 0.9 530 233 CUBA HAVANA 32 23 33 20 27 0.7 159 14N KORE PYONGYANG 25 17 31 7 21 2.1 204 99 JAMAIC KINGSTON 32 25 34 23 29 0.1 515 384S KORE SEOUL 26 19 31 8 22 1.2 678 555 P RICO SAN JUAN 31 26 34 24 29 0.6 226 84JAPAN SAPPORO 24 17 32 9 21 2.9 95 -38 GUADEL RAIZET 32 24 33 22 28 0.6 194 -5NAGOYA 31 23 38 15 27 3.2 193 -38 MARTIN LAMENTIN 32 24 33 23 28 1.4 234 29TOKYO 29 23 36 14 26 2.2 431 216 BARBAD BRIDGETOWN 31 25 33 23 28 0.6 281 145YOKOHAMA 28 22 36 14 25 1.8 378 138 TRINID PORT OF SPAIN 34 24 35 23 29 1.8 299 96KYOTO 31 22 38 14 27 2.1 221 25 COLOMB BOGOTA 19 10 21 5 14 1.0 76 18OSAKA 31 24 36 17 27 2.6 163 -2 VENEZU CARACAS *** *** 34 23 *** *** 62 15THAILA PHITSANULOK 33 25 35 23 29 0.4 309 81 F GUIA CAYENNE 33 23 34 22 28 1.4 50 -20BANGKOK 34 26 36 23 30 1.0 410 61 BRAZIL FORTALEZA 30 24 31 22 27 -0.8 0 -18MALAYS KUALA LUMPUR 33 25 35 24 29 2.2 299 110 RECIFE 28 23 30 21 26 -1.3 31 -47VIETNA HANOI 33 26 37 23 29 1.2 172 -80 CAMPO GRANDE 30 19 35 12 24 0.0 61 -11CHINA HARBIN 23 10 31 3 17 2.1 17 -36 FRANCA 29 18 33 14 23 1.6 93 29HAMI 28 12 35 7 20 1.4 9 5 RIO DE JANEIRO 28 19 35 14 23 1.0 19 -42LANCHOW *** *** 24 12 *** *** *** *** LONDRINA 30 16 36 11 23 2.9 60 -53BEIJING 26 17 33 8 21 1.2 57 10 SANTA MARIA 22 13 28 8 18 0.8 246 90TIENTSIN 26 17 33 10 21 0.1 45 4 TORRES 21 14 29 8 17 -1.9 118 -19LHASA 21 10 24 7 16 2.2 56 -12 PERU LIMA 18 14 20 13 16 -0.5 3 1KUNMING 25 17 30 14 21 2.7 101 -18 BOLIVI LA PAZ 16 0 20 -4 8 0.3 23 -9CHENGCHOW 26 19 34 11 22 1.1 145 67 CHILE SANTIAGO *** *** 27 1 *** *** *** ***YEHCHANG 28 22 37 16 25 1.5 129 20 ARGENT IGUAZU 26 15 33 8 20 0.5 107 -63HANKOW 28 21 36 14 25 0.6 92 13 FORMOSA 26 14 34 7 20 0.3 52 -46CHUNGKING 29 22 40 18 26 1.7 57 -88 CERES 24 10 33 3 17 1.2 53 7CHIHKIANG 28 21 38 14 25 1.4 103 35 CORDOBA 22 9 34 3 16 0.7 196 160WU HU 29 23 36 15 26 2.3 185 101 RIO CUARTO 21 8 29 0 15 0.9 63 18SHANGHAI 29 24 35 17 27 2.3 100 -35 ROSARIO 20 9 26 3 15 0.7 86 20NANCHANG 30 24 35 17 27 2.3 108 39 BUENOS AIRES 19 9 25 4 14 0.9 84 26TAIPEI 32 27 35 25 30 2.1 267 13 SANTA ROSA 20 6 27 -2 13 0.7 127 89CANTON 32 25 36 23 29 1.4 573 420 TRES ARROYOS 18 6 23 -3 12 0.9 59 0NANNING 32 24 36 20 28 0.6 168 44 MARSHA MAJURO 29 26 30 22 28 0.0 488 185CANARY LAS PALMAS 28 23 34 21 25 0.9 6 -3 NEW CA NOUMEA 28 21 33 18 24 3.6 5 -37MOROCC CASABLANCA 26 21 30 17 24 1.6 1 -5 FIJI NAUSORI 28 22 31 19 25 2.0 64 -96MARRAKECH 34 20 39 14 27 1.9 2 -6 SAMOA PAGO PAGO 30 25 30 23 27 0.6 229 42ALGERI ALGER 29 18 33 12 23 0.5 11 -23 TAHITI PAPEETE 29 22 31 20 26 0.7 76 27BATNA 29 14 36 6 21 0.0 21 -9 PNEWGU PORT MORESBY *** *** 31 27 *** *** *** ***TUNISI TUNIS 30 21 41 17 25 0.5 64 29 NZEALA AUCKLAND 17 11 20 7 14 *** 112 ***NIGER NIAMEY 35 25 40 20 30 0.6 48 -41 WELLINGTON 15 10 18 5 12 *** 152 ***MALI TIMBUKTU 37 25 42 22 31 -0.2 76 45 AUSTRA DARWIN 33 26 35 23 29 1.2 71 55BAMAKO 31 22 35 20 27 0.4 356 158 BRISBANE 23 17 26 11 20 1.6 139 103MAURIT NOUAKCHOTT 34 27 40 23 31 1.4 63 30 PERTH 22 8 30 3 15 0.5 26 -51SENEGA DAKAR 31 26 33 23 28 0.8 274 126 CEDUNA 17 9 26 2 13 -1.4 35 6LIBYA TRIPOLI 33 21 41 17 27 0.2 47 39 ADELAIDE 15 10 19 4 13 -0.7 104 39BENGHAZI 31 21 40 14 26 0.4 1 -1 MELBOURNE 15 8 19 3 12 -0.2 41 -12EGYPT CAIRO 34 24 39 20 29 1.8 0 *** WAGGA 16 6 20 1 11 -0.1 114 59ASWAN 41 26 44 23 34 2.0 0 0 CANBERRA 16 6 21 -1 11 0.8 74 18ETHIOP ADDIS ABABA 21 12 24 10 16 0.3 56 -120 INDONE SERANG 31 23 33 22 27 -0.5 328 255KENYA NAIROBI *** *** 29 9 *** *** *** *** PHILIP MANILA 32 26 34 24 29 1.0 368 2TANZAN DAR ES SALAAM 31 20 36 18 25 0.9 46 17GABON LIBREVILLE 28 24 30 23 26 0.9 168 62TOGO LOME 30 24 32 22 27 1.9 207 159BURKIN OUAGADOUGOU 33 24 36 21 28 0.8 108 -29COTE D ABIDJAN 29 24 31 23 27 1.8 169 108MOZAMB MAPUTO 29 18 39 13 24 2.4 1 -46ZAMBIA LUSAKA 29 14 33 9 22 -1.8 0 -1ZIMBAB KADOMA 31 14 33 9 22 -1.7 0 -3Based on Preliminary Reports
October 5, 2010 Weekly Weather <strong>and</strong> Crop Bulletin 31EUROPEWet <strong>weather</strong> continued to slow fieldwork <strong>and</strong> increase <strong>crop</strong> Germany, Pol<strong>and</strong>, <strong>and</strong> western Hungary. Farther south,quality concerns. A slow-moving storm system produced occasional showers (10-40 mm) in Italy <strong>and</strong> the Balkanslocally heavy rain (10-135 mm) across much of central <strong>and</strong> slowed summer <strong>crop</strong> harvesting. On the Iberian Peninsula, drynorthern Europe, further delaying small grain harvesting <strong>and</strong> <strong>weather</strong> reduced soil moisture for upcoming winter wheatwinter <strong>crop</strong> planting. In addition, the persistent wetness has planting, although reservoir levels remained above the longtermincreased grain quality concerns, most notably in Engl<strong>and</strong>, average.For additional information contact: meteorologists@oce.usda.gov
32 Weekly Weather <strong>and</strong> Crop Bulletin October 5, 2010WESTERN FSULocally heavy showers provided additional drought relief of the Volga District <strong>and</strong> northern portions of the Southern<strong>and</strong> improved winter <strong>crop</strong> prospects. For the second District. Meanwhile, wet <strong>weather</strong> returned to Belarus <strong>and</strong>consecutive week, a slow-moving storm system generated northern portions of Russia’s wheat belt, slowing10 to 75 mm of rain from eastern Ukraine into the fieldwork but maintaining adequate to locally abundantSouthern District. <strong>The</strong> rainfall further improved soil soil moisture. Freezes remained north of the primarymoisture for late winter grain planting <strong>and</strong> establishment, growing areas, although colder air was pushing southwardalthough long-term drought lingered in southern portions as of October 4.For additional information contact: meteorologists@oce.usda.gov
October 5, 2010 Weekly Weather <strong>and</strong> Crop Bulletin 33EASTERN FSUMostly dry, warm conditions favored late-season fieldwork. However, a few early week showers (2-15 mm) may haveSunny skies <strong>and</strong> above-normal temperatures (up to 6 degrees C caused minor fieldwork delays. Dry, seasonably warmabove normal) maintained a rapid pace of spring grain <strong>weather</strong> promoted cotton maturation <strong>and</strong> harvesting acrossharvesting across northern Kazakhstan <strong>and</strong> southern Russia. southern growing areas.For additional information contact: meteorologists@oce.usda.gov
34 Weekly Weather <strong>and</strong> Crop Bulletin October 5, 2010Showers in northern portions of the region contrasted withseasonably dry <strong>weather</strong> elsewhere. A pair of upper-airdisturbances triggered scattered showers (2-20 mm) in Turkey,MIDDLE EASTproviding soil moisture for winter <strong>crop</strong> planting <strong>and</strong>establishment. Dry conditions elsewhere favored winter <strong>crop</strong>planting <strong>and</strong> cotton harvesting.For additional information contact: meteorologists@oce.usda.gov
October 5, 2010 Weekly Weather <strong>and</strong> Crop Bulletin 35SOUTH ASIAAs the monsoon withdrew from northern India, favorably showers maintained abundant soil moisture for immaturedrier <strong>weather</strong> settled over northern portions of the region. <strong>crop</strong>s in western Maharashtra. <strong>The</strong> bulk of monsoon<strong>The</strong> drier conditions eased wetness <strong>and</strong> benefited cotton rainfall shifted to the southern half of India, providingharvesting. Similarly, key oilseed areas of western India favorable soil moisture for late-planted groundnuts <strong>and</strong>benefited from mostly dry <strong>weather</strong>, although occasional cotton.For additional information contact: meteorologists@oce.usda.gov
36 Weekly Weather <strong>and</strong> Crop Bulletin October 5, 2010EASTERN ASIAA freeze across much of northeastern China ended the of heavy precipitation (25-50 mm) across the Yangtzegrowing season. <strong>The</strong> cold <strong>weather</strong> aided corn <strong>and</strong> soybean Valley slowed harvesting but ensured abundant pre-plantingdrydown <strong>and</strong> harvesting. <strong>The</strong> freeze corresponded to the moisture for rapeseed. Elsewhere in the region, favorablyaverage date of the first freeze (September 20) for the area. drier conditions prevailed for mature rice on the KoreanMostly dry <strong>weather</strong> with only occasional showers aided Peninsula. Meanwhile, Typhoon Malakas passed close tocotton harvesting in Hebei <strong>and</strong> Sh<strong>and</strong>ong, while wetter Japan, producing heavy showers (up to 150 mm) for mature<strong>weather</strong> (10-25 mm) slowed harvesting in Henan. An axis rice on Honshu.For additional information contact: meteorologists@oce.usda.gov
October 5, 2010 Weekly Weather <strong>and</strong> Crop Bulletin 37Continued monsoon showers (50-100 mm) provided abundantsoil moisture for rice in Thail<strong>and</strong>, Vietnam, <strong>and</strong> thePhilippines. Unfavorably heavy rainfall (50-100 mm or more)impacted maturing coffee in central Vietnam, with the harvestseason soon to begin. Wet <strong>weather</strong> (50-200 mm across a largeSOUTHEAST ASIAsection of Malaysia <strong>and</strong> Indonesia disrupted oil palmpollination <strong>and</strong> delayed harvest activities. <strong>The</strong> wet <strong>weather</strong>extended into Java, Indonesia, which experienced one of thewettest dry seasons on record, with over 600 mm of rain sinceJune 1 (average rainfall is 185 mm).For additional information contact: meteorologists@oce.usda.gov
38 Weekly Weather <strong>and</strong> Crop Bulletin October 5, 2010Unfavorably dry <strong>weather</strong> further reduced <strong>crop</strong> prospects inWestern Australia, where many winter <strong>crop</strong>s are in thereproductive stage of development. Farther east, warm, sunny<strong>weather</strong> reduced soil moisture in South Australia, Victoria, <strong>and</strong>southern New South Wales, but moisture supplies weregenerally adequate for winter grain <strong>and</strong> oilseed developmentfollowing abundant winter <strong>and</strong> early spring rainfall. Elsewherein the wheat belt, widespread showers (5-50 mm) in northernNew South Wales <strong>and</strong> Queensl<strong>and</strong> kept filling winter wheatAUSTRALIAadequately watered <strong>and</strong> further increased reservoir levels forirrigated summer <strong>crop</strong>s. <strong>The</strong> wet <strong>weather</strong> delayed fieldwork,however, including summer <strong>crop</strong> planting. <strong>The</strong> persistent rainhas likely begun to hamper the drydown of the earliestmaturing winter wheat <strong>and</strong> has slowly increased concerns thatgrain quality may be reduced if the rain does not end soon.Temperatures in southern <strong>and</strong> eastern Australia averaged 1 to 2degrees C below normal, while in Western Australiatemperatures averaged 1 to 2 degrees C above normal.For additional information contact: meteorologists@oce.usda.gov
October 5, 2010 Weekly Weather <strong>and</strong> Crop Bulletin 39ARGENTINAUnseasonably heavy rain overspread key farming areas of grains <strong>and</strong> emerging summer <strong>crop</strong>s. Freezes were patchy <strong>and</strong>central Argentina, increasing moisture levels for grains <strong>and</strong> light, with just a few locations recording temperatures as lowoilseeds. <strong>The</strong> heaviest rainfall (greater than 50 mm) was as 0 degrees C. Mostly dry <strong>weather</strong> prevailed farther north,concentrated over the previously dry western production spurring planting of corn <strong>and</strong> sunflowers. Temperaturesareas, including most of La Pampa <strong>and</strong> Cordoba, although averaged about a degree C below normal across the north,most of the region received at least 10 mm. <strong>The</strong> rain, which with highs in the upper 20s <strong>and</strong> lower 30s degrees C.lingered for much of the week, was accompanied by near- to According to Argentina’s Ministry of Agriculture, sunflowerbelow-normal temperatures (highs in the lower <strong>and</strong> middle <strong>and</strong> corn planting was 15 <strong>and</strong> 21 percent complete,20s degrees C); the cooler <strong>weather</strong> reduced losses to respectively, as of September 30, slightly ahead of last year’sevaporation while lowering growth rates of vegetative winter pace for both <strong>crop</strong>s.For additional information contact: meteorologists@oce.usda.gov
40 Weekly Weather <strong>and</strong> Crop Bulletin October 5, 2010Beneficial rain moved into central <strong>and</strong> southeastern Brazil,likely signaling the beginning of the summer rainy season inthose parts of the country. In Sao Paulo <strong>and</strong> Minas Gerais,heavy rain (25-50 mm, locally exceeding 100 mm) broughtrelief from dryness to sugarcane <strong>and</strong> citrus <strong>and</strong> will triggerflowering of the 2010/11 coffee <strong>crop</strong>. To the north <strong>and</strong> west,the rainfall will spur planting of soybeans <strong>and</strong> other summer<strong>crop</strong>s; this is particularly true in Mato Grosso, Brazil’s largestsoybean producer, which received its first significant rain ofthe season more than a week later than usual. <strong>The</strong> rainfall alsoBRAZILhelped to bring temperatures down to more seasonable levels,with early week highs near 40 degrees C giving way to highsin the lower <strong>and</strong> middle 30s at week’s end. Farther south, dry<strong>weather</strong> returned to Rio Gr<strong>and</strong>e do Sul <strong>and</strong> Santa Catarina,following last week’s inundating rainfall, improving conditionsfor immature winter wheat. Heavier rain (25-50 mm or more)in Parana <strong>and</strong> southern Mato Grosso do Sul increased moisturefor summer <strong>crop</strong>s but was untimely for maturing wheat. Dry<strong>weather</strong> prevailed along the northeastern coast, spurringharvesting of sugarcane <strong>and</strong> other plantation <strong>crop</strong>s.For additional information contact: meteorologists@oce.usda.gov
October 5, 2010 Weekly Weather <strong>and</strong> Crop Bulletin 41MEXICOSeasonal showers tapered off across northern <strong>and</strong> centralMexico as the monsoon showed signs of retreatingrain (greater than 100 mm) persisted over sections of thesoutheast that have been battling flooding in recent weekssouthward. Rainfall was generally patchy <strong>and</strong> light (southern Veracruz, eastern Oaxaca, Tabasco, <strong>and</strong>throughout much of the northwest, with amounts Chiapas), likely causing additional flooding <strong>and</strong> damage toexceeding 25 mm confined to southern Chihuahua <strong>and</strong>points southward. Mostly dry <strong>weather</strong> was also recorded<strong>crop</strong>s <strong>and</strong> infrastructure. Elsewhere, light to moderaterain (10-25 mm, locally more than 50 mm) fell in theon the southern plateau after last week’s surge in moisture; northeast (Nuevo Leon, Tamaulipas, <strong>and</strong> northernthe sunny <strong>weather</strong> will aid development of corn <strong>and</strong> otherfilling to maturing summer <strong>crop</strong>s. In contrast, excessiveVeracruz), maintaining locally wet conditions followinglast week’s heavy rain.For additional information contact: meteorologists@oce.usda.gov
42 Weekly Weather <strong>and</strong> Crop Bulletin October 5, 2010CANADIAN PRAIRIESMostly dry, warmer-than-normal <strong>weather</strong> improved dry out wet fields <strong>and</strong> kept topsoils sufficiently warm forconditions for spring grain <strong>and</strong> oilseed harvesting. Mostareas received little, if any, rainfall, with only a fewlocations recording totals in excess of 10 mm. In addition,temperatures averaged 3 to 4 degrees C above normal,with highs reaching the middle <strong>and</strong> upper 20s degrees C inmost agricultural districts. <strong>The</strong> warmer <strong>weather</strong> helpedgermination of winter grains. <strong>The</strong> improved conditionswere welcome by producers struggling to harvest beforeanother round of untimely moisture. According to theGovernment of Saskatchewan, <strong>crop</strong>s were 29 percentharvested as of September 27, compared with the 5-yearaverage of 75 percent.For additional information contact: meteorologists@oce.usda.gov
October 5, 2010 Weekly Weather <strong>and</strong> Crop Bulletin 43SOUTHEASTERN CANADAScattered, locally heavy showers continued throughout the bringing fieldwork to a st<strong>and</strong>still. Weekly temperaturesarea, increasing moisture for pastures <strong>and</strong> winter grains averaged near to below normal in Ontario <strong>and</strong> severalbut hampering autumn fieldwork. In Ontario, rainfall degrees above normal in the wetter eastern locations,generally ranged from 10 to 25 mm or more in the main owing to the higher temperatures (highs in the middle 20ssouthwestern farming areas, slowing drydown of corn <strong>and</strong> degrees C) accompanying the tropical moisture. Highssoybeans. Farther east, heavy rain (50 to more than 100 farther west barely reached 20 degrees C, <strong>and</strong> patchy frostmm) from the remnants of Tropical Storm Nicole soaked was possible, although the region continued to lack aQuebec <strong>and</strong> nearby locations in southeastern Ontario, killing freeze.For additional information contact: meteorologists@oce.usda.gov
Remnants of Nicole combine witha front to soak East Coast cotton8 AM EDT Sep 25, 2010 - 8 AM EDT Oct 2, 2010Rainfall (inches)0.1 - 1.01.0 - 2.02.0 - 4.04.0 - 6.06.0 - 8.08.0 - 10.010.0 - 16.0More than 16.0Data Sources:- Rainfall estimates obtained from the National Weather Service- Agricultural areas are delineated using NASS county-level <strong>crop</strong> dataPercent of Cotton BollsOpen by Sep 2671[-14]95[+12]91[+8]84[+10]92[+22]81[+8]Major Cotton AreasMinor Cotton AreasAgricultural Weather Assessments<strong>World</strong> Agricultural Outlook BoardTOP ## = Percent Bolls Open[BOTTOM ##] = Change from5-yr average<strong>The</strong> Weekly Weather <strong>and</strong> Crop Bulletin (ISSN 0043-1974) isjointly prepared by the U.S. Department of Commerce, NationalOceanic <strong>and</strong> Atmospheric Administration (NOAA) <strong>and</strong> the U.S.Department of Agriculture (USDA). Publication began in 1872as the Weekly Weather Chronicle. It is issued under generalauthority of the Act of January 12, 1895 (44-USC 213), 53rdCongress, 3rd Session. <strong>The</strong> contents may be redistributedfreely with proper credit.Correspondence to the meteorologists should be directed to:Weekly Weather <strong>and</strong> Crop Bulletin, NOAA/USDA, JointAgricultural Weather Facility, USDA South Building, Room4443B, Washington, DC 20250.Internet URL: http://www.usda.gov/oce/<strong>weather</strong>E-mail address: <strong>weather</strong>@oce.usda.gov<strong>The</strong> Weekly Weather <strong>and</strong> Crop Bulletin <strong>and</strong> archives aremaintained on the following USDA Internet URL:http://www.usda.gov/oce/<strong>weather</strong>/pubs/Weekly/Wwcb/index.htmU.S. DEPARTMENT OF AGRICULTURE<strong>World</strong> Agricultural Outlook BoardManaging Editor............................Brad Rippey (202) 720-2397Production Editor..........................Brian Morris (202) 720-3062International Editor...................Mark Brusberg (202) 720-3508Editorial Advisors..............Charles Wilbur <strong>and</strong> Brenda ChapinAgricultural Weather Analysts.........................Tom Puterbaugh,Harlan Shannon, <strong>and</strong> Eric LuebehusenStoneville................................................................Nancy LopezNational Agricultural Statistics ServiceAgricultural Statistician...............Julie Schmidt (202) 720-7621State Summaries Editor.........Delores Thomas (202) 720-8033U.S. DEPARTMENT OF COMMERCENational Oceanic <strong>and</strong> Atmospheric AdministrationNational Weather Service/Climate Prediction CenterMeteorologists........David Miskus, Brad Pugh, Adam Allgood,<strong>and</strong> Andrew Loconto<strong>The</strong> U.S. Department of Agriculture (USDA) prohibits discrimination in all its programs <strong>and</strong> activities on the basis of race, color, national origin, age, disability,<strong>and</strong> where applicable, sex, marital status, familial status, parental status, religion, sexual orientation, genetic information, political beliefs, reprisal, or becauseall or part of an individual’s income is derived from any public assistance program. (Not all prohibited bases apply to all programs.) Persons with disabilitieswho require alternative means for communication of program information (Braille, large print, audiotape, etc.) should contact USDA’s TARGET Center at(202) 720-2600 (voice <strong>and</strong> TDD). To file a complaint of discrimination write to USDA, Director, Office of Civil Rights, 1400 Independence Avenue, S.W.,Washington, D.C. 20250-9410 or call (800) 795-3272 (voice) or (202) 720-6382 (TDD). USDA is an equal opportunity provider <strong>and</strong> employer.


