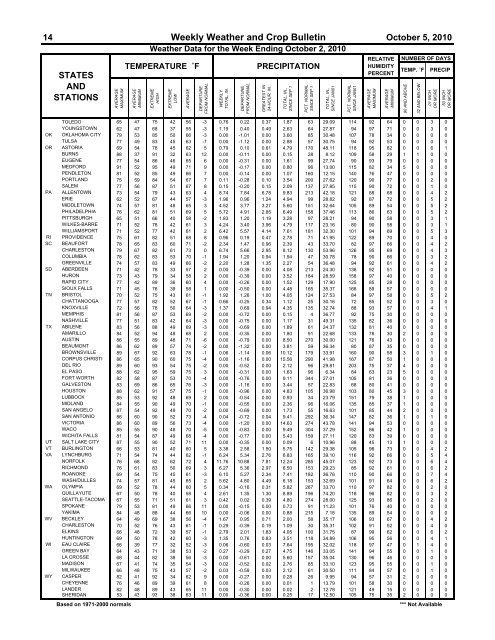
14 Weekly Weather <strong>and</strong> Crop Bulletin October 5, 2010Weather Data for the Week Ending October 2, 2010STATESANDSTATIONSAVERAGEMAXIMUMTEMPERATURE ˚FAVERAGEMINIMUMEXTREMEHIGHEXTREMELOWAVERAGEDEPARTUREFROM NORMALWEEKLYTOTAL, IN.DEPARTUREFROM NORMALPRECIPITATIONGREATEST IN24-HOUR, IN.TOTAL, IN.,SINCE SEP 1PCT. NORMALSINCE SEP 1TOTAL, IN.,SINCE JAN01PCT. NORMALSINCE JAN01RELATIVEHUMIDITYPERCENTAVERAGEMAXIMUMAVERAGEMINIMUMNUMBER OF DAYSTEMP. ˚FTOLEDO 65 47 75 42 56 -3 0.76 0.22 0.37 1.87 63 29.09 114 92 64 0 0 3 0YOUNGSTOWN 62 47 68 37 55 -3 1.19 0.40 0.49 2.63 64 27.87 94 97 71 0 0 3 0OK OKLAHOMA CITY 79 53 85 50 66 -3 0.00 -1.01 0.00 3.60 85 30.48 107 78 34 0 0 0 0TULSA 77 49 83 45 63 -7 0.00 -1.12 0.00 2.88 57 30.75 94 92 53 0 0 0 0OR ASTORIA 69 54 78 45 62 5 0.79 0.10 0.61 4.79 170 48.11 118 95 82 0 0 6 1BURNS 88 37 91 32 63 12 0.00 -0.11 0.00 0.15 28 8.12 109 58 29 1 1 0 0EUGENE 77 54 86 46 65 6 0.00 -0.31 0.00 1.61 99 27.74 90 93 79 0 0 0 0MEDFORD 91 52 95 49 71 9 0.00 -0.17 0.00 0.80 96 13.00 115 82 34 5 0 0 0PENDLETON 81 52 85 49 66 7 0.00 -0.14 0.00 1.07 160 12.15 140 76 47 0 0 0 0PORTLAND 75 59 84 54 67 7 0.11 -0.28 0.10 3.54 200 27.62 120 90 77 0 0 2 0SALEM 77 56 87 51 67 8 0.15 -0.20 0.15 2.09 137 27.85 115 90 72 0 0 1 0PA ALLENTOWN 73 54 79 43 63 4 8.74 7.84 6.78 9.83 213 42.18 121 88 68 0 0 4 2ERIE 62 52 67 44 57 -3 1.96 0.96 1.24 4.94 99 28.82 92 87 72 0 0 5 2MIDDLETOWN 74 57 81 48 65 3 4.52 3.77 3.27 5.60 151 32.64 105 89 54 0 0 5 2PHILADELPHIA 76 62 81 51 69 5 5.72 4.91 2.85 6.49 158 37.46 113 86 63 0 0 5 2PITTSBURGH 65 51 66 40 58 -2 1.83 1.20 1.19 3.28 97 28.21 94 90 58 0 0 3 1WILKES-BARRE 71 52 78 42 61 3 4.24 3.40 3.96 4.79 117 23.16 80 90 58 0 0 3 1WILLIAMSPORT 71 52 77 42 61 2 6.42 5.57 4.14 7.61 181 32.30 101 94 69 0 0 5 3RI PROVIDENCE 75 61 82 51 68 8 0.96 0.19 0.47 2.78 71 41.95 122 89 70 0 0 4 0SC BEAUFORT 78 65 83 60 71 -2 2.34 1.47 0.96 2.39 43 33.70 82 97 66 0 0 4 2CHARLESTON 79 67 82 61 73 0 6.74 5.66 2.95 8.12 130 53.96 126 95 69 0 0 4 3COLUMBIA 78 62 83 53 70 -1 1.94 1.20 0.94 1.94 47 30.78 78 90 66 0 0 3 2GREENVILLE 74 57 83 49 66 -2 2.20 1.28 1.35 2.27 54 36.48 94 92 61 0 0 4 2SD ABERDEEN 71 42 78 33 57 2 0.00 -0.39 0.00 4.08 213 24.30 138 92 51 0 0 0 0HURON 73 43 79 34 58 2 0.00 -0.39 0.00 3.52 184 28.59 158 97 40 0 0 0 0RAPID CITY 77 42 89 36 60 4 0.00 -0.26 0.00 1.52 129 17.90 125 85 28 0 0 0 0SIOUX FALLS 71 45 76 39 58 1 0.00 -0.50 0.00 4.48 165 35.37 168 89 57 0 0 0 0TN BRISTOL 70 52 75 43 61 -1 1.92 1.26 1.00 4.05 124 27.53 84 97 58 0 0 5 2CHATTANOOGA 77 57 82 52 67 -1 0.66 -0.25 0.34 1.12 25 30.16 72 85 52 0 0 3 0KNOXVILLE 72 56 78 50 64 -3 1.37 0.69 0.94 4.35 135 32.74 88 93 57 0 0 4 1MEMPHIS 81 56 87 53 69 -2 0.00 -0.72 0.00 0.15 4 36.77 92 75 30 0 0 0 0NASHVILLE 77 51 83 42 64 -3 0.00 -0.75 0.00 1.17 31 49.31 135 82 36 0 0 0 0TX ABILENE 83 56 88 49 69 -3 0.00 -0.69 0.00 1.89 61 24.37 132 81 40 0 0 0 0AMARILLO 84 52 94 48 68 2 0.00 -0.35 0.00 1.80 91 22.68 133 78 30 2 0 0 0AUSTIN 86 55 89 48 71 -6 0.00 -0.79 0.00 8.50 270 30.00 121 76 43 0 0 0 0BEAUMONT 86 62 89 57 74 -2 0.00 -1.32 0.00 3.81 59 36.34 80 87 35 0 0 0 0BROWNSVILLE 89 67 92 63 78 -1 0.06 -1.14 0.06 10.12 179 33.91 160 90 58 3 0 1 0CORPUS CHRISTI 86 65 90 60 75 -4 0.00 -1.16 0.00 15.56 290 41.98 167 87 50 1 0 0 0DEL RIO 89 60 93 54 75 -2 0.00 -0.52 0.00 2.12 96 29.81 203 75 37 4 0 0 0EL PASO 88 62 95 59 75 3 0.00 -0.31 0.00 1.63 96 6.34 84 63 23 5 0 0 0FORT WORTH 82 58 87 53 70 -4 0.00 -0.76 0.00 9.11 344 27.01 105 81 36 0 0 0 0GALVESTON 83 69 86 65 76 -3 0.00 -1.16 0.00 3.44 57 22.83 68 80 41 0 0 0 0HOUSTON 88 62 91 57 75 -1 0.00 -0.96 0.00 4.83 105 36.98 103 80 45 3 0 0 0LUBBOCK 85 53 92 48 69 2 0.00 -0.54 0.00 0.93 34 23.79 151 79 38 1 0 0 0MIDLAND 84 55 90 49 70 -1 0.00 -0.55 0.00 2.36 96 16.06 135 85 37 1 0 0 0SAN ANGELO 87 54 92 49 70 -2 0.00 -0.69 0.00 1.73 55 16.63 101 85 44 2 0 0 0SAN ANTONIO 86 60 90 52 73 -4 0.04 -0.72 0.04 9.41 292 36.34 147 82 36 1 0 1 0VICTORIA 86 60 89 56 73 -4 0.00 -1.20 0.00 14.63 274 43.78 141 94 53 0 0 0 0WACO 85 55 90 48 70 -5 0.00 -0.83 0.00 9.49 304 37.29 152 86 42 1 0 0 0WICHITA FALLS 81 54 87 49 68 -4 0.00 -0.77 0.00 5.43 159 27.11 120 83 39 0 0 0 0UT SALT LAKE CITY 87 55 90 52 71 11 0.00 -0.35 0.00 0.09 6 10.96 88 45 13 1 0 0 0VT BURLINGTON 66 53 81 40 60 5 3.38 2.58 1.50 5.75 142 29.38 105 98 73 0 0 4 2VA LYNCHBURG 71 54 74 44 62 -1 6.24 5.34 2.76 6.83 165 39.10 116 92 66 0 0 5 4NORFOLK 76 68 82 62 72 4 11.76 10.88 7.81 12.24 285 45.07 123 92 73 0 0 6 4RICHMOND 76 61 83 50 69 3 6.27 5.36 2.97 6.50 153 29.23 85 92 61 0 0 6 2ROANOKE 69 54 75 45 61 -3 6.10 5.27 2.34 7.41 182 36.76 110 90 66 0 0 7 4WASH/DULLES 74 57 81 45 65 2 5.62 4.80 4.49 6.18 153 32.69 101 91 64 0 0 6 2WA OLYMPIA 69 52 78 44 60 5 0.34 -0.16 0.31 5.82 267 33.70 110 97 82 0 0 2 0QUILLAYUTE 67 50 78 40 58 4 2.61 1.35 1.30 8.89 196 74.20 118 96 82 0 0 3 2SEATTLE-TACOMA 67 55 71 51 61 3 0.42 0.02 0.39 4.80 274 28.00 125 93 86 0 0 2 0SPOKANE 79 53 81 49 66 11 0.00 -0.15 0.00 0.73 91 11.23 101 76 40 0 0 0 0YAKIMA 84 48 88 44 66 10 0.00 -0.06 0.00 0.88 215 7.18 135 89 54 0 0 0 0WV BECKLEY 64 49 69 38 56 -4 1.67 0.95 0.71 2.00 58 35.17 106 93 67 0 0 4 2CHARLESTON 70 52 76 43 61 -1 0.29 -0.39 0.19 1.09 30 35.31 102 91 52 0 0 4 0ELKINS 66 48 72 39 57 -1 2.79 2.01 1.83 4.05 100 31.75 87 99 62 0 0 6 2HUNTINGTON 69 50 78 42 60 -3 1.35 0.76 0.83 3.51 118 34.89 106 95 56 0 0 4 1WI EAU CLAIRE 66 39 77 32 52 -3 0.06 -0.60 0.03 7.64 195 32.02 118 97 47 0 1 4 0GREEN BAY 64 43 71 38 53 -2 0.27 -0.29 0.27 4.75 146 33.05 141 94 55 0 0 1 0LA CROSSE 68 44 82 38 56 -3 0.00 -0.61 0.00 5.60 157 35.04 130 96 46 0 0 0 0MADISON 67 41 74 35 54 -3 0.02 -0.52 0.02 2.76 85 33.10 123 95 55 0 0 1 0MILWAUKEE 66 48 75 43 57 -2 0.03 -0.59 0.03 2.12 61 30.50 111 84 57 0 0 1 0WY CASPER 82 41 92 34 62 9 0.00 -0.27 0.00 0.28 26 9.95 94 57 31 2 0 0 0CHEYENNE 76 46 89 39 61 8 0.00 -0.26 0.00 0.01 1 13.79 101 58 30 0 0 0 0LANDER 82 48 89 43 65 11 0.00 -0.30 0.00 0.02 2 12.78 121 49 15 0 0 0 0SHERIDAN 83 43 93 38 63 11 0.00 -0.36 0.00 0.25 17 12.50 105 75 35 2 0 0 0Based on 1971-2000 normals*** Not Available90 AND ABOVE32 AND BELOWPRECIP.01 INCHOR MORE.50 INCHOR MORE
October 5, 2010 Weekly Weather <strong>and</strong> Crop Bulletin 15Cooler <strong>weather</strong> reigned over much of the countryeast of the Great Plains during the week, withtemperatures averaging as much as 9 degrees Fbelow normal in parts of Missouri, Oklahoma, <strong>and</strong>Texas. Elsewhere, warm, dry conditions in much ofthe West provided ideal conditions for summer <strong>crop</strong>maturation <strong>and</strong> fall fieldwork. Additionally, dryNational Agricultural SummarySeptember 27 – October 3, 2010Weekly National Agricultural Summary provided by USDA/NASSHIGHLIGHTS<strong>weather</strong> across the Corn Belt promoted thecontinued rapid corn <strong>and</strong> soybean harvest.Conversely, heavy precipitation fell along much ofthe Atlantic Coast, helping to replenish soil moisturebut triggering localized flooding. Most notably,coastal locations in North Carolina <strong>and</strong> Virginiareceived more than 12 inches of rain during the week.Corn: Nationally, 93 percent of this year’s corn <strong>crop</strong> was at or beyondthe mature stage by week’s end, 39 percentage points ahead of last year<strong>and</strong> 14 points ahead of the 5-year average. Maturity was nearly completeacross much of the Corn Belt, where progress was well ahead of both lastyear <strong>and</strong> the average pace. By October 3, producers had harvested 37percent of the nation’s <strong>crop</strong>, 28 percentage points—or 36 days—ahead oflast year <strong>and</strong> 16 points ahead of the 5-year average. Harvest was mostadvanced <strong>and</strong> nearly complete in Tennessee, 62 percentage points aheadof last year <strong>and</strong> 21 points ahead of the average. In the Corn Belt, warm,dry conditions continued to promote a rapid harvest pace, with progress inIllinois <strong>and</strong> Indiana 59 points or more ahead of last year <strong>and</strong> 43 points ormore ahead of normal. Overall, 66 percent of the corn <strong>crop</strong> was reportedin good to excellent condition, unchanged from last week but 4 percentagepoints below the same time last year.Soybeans: By week’s end, leaves were dropping on 88 percent of thesoybean <strong>crop</strong>, 11 percentage points ahead of last year <strong>and</strong> 3 points ahead ofthe 5-year average. Double-digit progress was evident in most of the majorsoybean-producing areas of the country, as leaf drop neared completion inmuch of the Corn Belt, lower Delta, <strong>and</strong> Ohio Valley. With mostly dry<strong>weather</strong> providing nearly ideal conditions for fall fieldwork, harvestadvanced 20 points during the week to 37 percent complete by October 3.This was 23 percentage points ahead of last year <strong>and</strong> 9 points ahead of the 5-year average. Producers in Illinois, Indiana, Iowa, Minnesota, <strong>and</strong>Nebraska, the five largest soybean-producing states, harvested 22 percent ormore of their <strong>crop</strong> during the week. Overall, 64 percent of the soybean <strong>crop</strong>was reported in good to excellent condition, up slightly from last week but 3percentage points below the same time last year.Winter Wheat: Dry conditions <strong>and</strong> sunny skies provided ample time forproducers in the major winter wheat-producing areas to seed 20 percent ofthe 2011 <strong>crop</strong>. By October 3, fifty-three percent of the wheat was in theground, on par with last year but slightly behind the 5-year average.Emergence advanced to 22 percent complete by week’s end, 4 percentagepoints behind last year <strong>and</strong> 3 points behind the 5-year average.Emergence was most advanced in Washington, where warm <strong>weather</strong> <strong>and</strong>adequate soil moisture levels have provided ideal germination conditionsduring the past several weeks.Cotton: Nationwide, bolls were opening on 87 percent of this year’s cottonacreage, 21 percentage points—or 16 days—ahead of last year <strong>and</strong> 13 pointsahead of the 5-year average. Harvest was most advanced <strong>and</strong> well ahead ofboth last year <strong>and</strong> the average pace throughout the Delta. Nationally, 25percent of the <strong>crop</strong> was harvested by week’s end, 15 percentage pointsahead of last year <strong>and</strong> 7 points ahead of the 5-year average. In Texas,harvest had just begun on the Southern High Plains, while producers on theNorthern High Plains were busy applying defoliants with expectations ofstarting harvest within the next few weeks. Overall, 56 percent of the cotton<strong>crop</strong> was reported in good to excellent condition, up slightly from last week<strong>and</strong> 9 percentage points better than the same time last year.Sorghum: By week’s end, 77 percent of the nation’s sorghum <strong>crop</strong> wasat or beyond the mature stage, 25 percentage points ahead of last year <strong>and</strong>13 points ahead of the 5-year average. Warm <strong>weather</strong> continued topromote a rapid maturity pace in most of the major sorghum-producingareas of the country. Harvest advanced 7 points during the week, leavingprogress—at 39 percent complete—9 percentage points ahead of last year<strong>and</strong> slightly ahead of the 5-year average. In Texas, harvest was justbeginning on the Northern High Plains, while producers in the CoastalBend were waiting for their fields to dry out before continuing harvest.Overall, 60 percent of the sorghum <strong>crop</strong> was reported in good to excellentcondition, down slightly from last week but 11 percentage points betterthan the same time last year.Rice: Producers had harvested 78 percent of this year’s rice <strong>crop</strong> byOctober 3, eighteen percentage points ahead of last year <strong>and</strong> 6 pointsahead of the 5-year average. Harvest continued at a slow pace inCalifornia, with overall progress 51 percentage points behind last year <strong>and</strong>39 points behind the average.Small Grains: By October 3, ninety-four percent of this year’s barley<strong>crop</strong> was harvested, 5 percentage points behind both last year <strong>and</strong> the 5-year average. Improved <strong>weather</strong> conditions <strong>and</strong> 6 days suitable forfieldwork allowed producers in Montana time to harvest 8 percent of their<strong>crop</strong>, but overall progress remained 15 percentage points behind last year<strong>and</strong> 17 points behind the average.Nationally, 95 percent of the spring wheat <strong>crop</strong> was harvested by week’send, 2 percentage points behind last year <strong>and</strong> 4 points behind the 5-yearaverage. In Montana, producers harvested 16 percent of their <strong>crop</strong> duringthe week.Other Crops: Peanut harvest advanced to 24 percent complete byOctober 3, nine percentage points ahead of last year <strong>and</strong> 5 points ahead ofthe 5-year average. Excessive rainfall in North Carolina <strong>and</strong> Virginialimited harvest to 4 percent or less, leaving overall progress behind theaverage pace. Overall, 48 percent of the peanut <strong>crop</strong> was reported in goodto excellent condition, up slightly from last week but 22 percentage pointsbelow the same time last year.Sunflower producers had harvested 3 percent of this year’s <strong>crop</strong> byweek’s end, slightly behind last year <strong>and</strong> 2 percentage points behind the 5-year average. Overall progress was 3 percentage points behind theaverage in all estimating states except Colorado.Sugarbeet harvest advanced 15 points during the week to 30 percentcomplete by October 3. This was 12 percentage points ahead of lastyear <strong>and</strong> 10 points ahead of the 5-year average. Producers in Minnesota<strong>and</strong> North Dakota, the two largest sugarbeet-producing states, utilized 4<strong>and</strong> 6 days suitable, respectively, to harvest 18 <strong>and</strong> 22 percent of their<strong>crop</strong>.
- Page 1 and 2: Volume 97, No. 40 http://www.usda.g
- Page 3 and 4: October 5, 2010 Weekly Weather and
- Page 5 and 6: October 5, 2010 Weekly Weather and
- Page 7 and 8: October 5, 2010 Weekly Weather and
- Page 9 and 10: October 5, 2010 Weekly Weather and
- Page 11 and 12: October 5, 2010 Weekly Weather and
- Page 13: October 5, 2010 Weekly Weather and
- Page 17 and 18: October 5, 2010 Weekly Weather and
- Page 19 and 20: October 5, 2010 Weekly Weather and
- Page 21 and 22: October 5, 2010 Weekly Weather and
- Page 23 and 24: October 5, 2010 Weekly Weather and
- Page 25 and 26: October 5, 2010 Weekly Weather and
- Page 27 and 28: October 5, 2010 Weekly Weather and
- Page 29 and 30: October 5, 2010 Weekly Weather and
- Page 31 and 32: October 5, 2010 Weekly Weather and
- Page 33 and 34: October 5, 2010 Weekly Weather and
- Page 35 and 36: October 5, 2010 Weekly Weather and
- Page 37 and 38: October 5, 2010 Weekly Weather and
- Page 39 and 40: October 5, 2010 Weekly Weather and
- Page 41 and 42: October 5, 2010 Weekly Weather and
- Page 43 and 44: October 5, 2010 Weekly Weather and