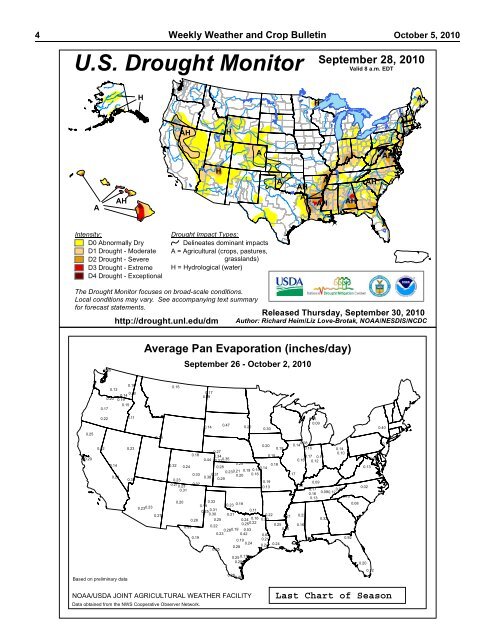
4 Weekly Weather <strong>and</strong> Crop Bulletin October 5, 2010U.S. Drought MonitorSeptember 28, 2010Valid 8 a.m. EDTHHAHAHHAHAAHHAAAHAAAHAAHAHAHIntensity:D0 Abnormally DryD1 Drought - ModerateD2 Drought - SevereD3 Drought - ExtremeD4 Drought - ExceptionalDrought Impact Types:Delineates dominant impactsA = Agricultural (<strong>crop</strong>s, pastures,grassl<strong>and</strong>s)H = Hydrological (water)A<strong>The</strong> Drought Monitor focuses on broad-scale conditions.Local conditions may vary. See accompanying text summaryfor forecast statements.http://drought.unl.edu/dmReleased Thursday, September 30, 2010Author: Richard Heim/Liz Love-Brotak, NOAA/NESDIS/NCDC0.05Average Pan Evaporation (inches/day)September 26 - October 2, 20100.180.130.200.140.20 0.190.150.170.150.170.090.220.110.250.020.230.290.140.290.330.180.23 0.230.27Based on preliminary data0.110.140.470.200.090.300.400.080.200.140.100.190.160.140.270.100.18 0.340.150.17 0.100.44 0.350.160.080.210.120.250.320.180.240.280.140.130.21 0.19 0.150.230.33 0.31 0.20 0.160.170.380.230.290.190.090.27 0.320.230.130.220.020.310.170.060.160.090.120.130.100.200.330.190.23 0.190.080.250.310.110.30 0.210.220.21 0.230.28 0.250.24 0.16 0.200.320.250.220.25 0.160.390.220.530.260.280.190.190.23 0.42 0.640.19 0.210.200.920.280.240.250.240.240.25 0.170.250.200.120.280.20NOAA/USDA JOINT AGRICULTURAL WEATHER FACILITYData obtained from the NWS Cooperative Observer Network.Last Chart of Season
October 5, 2010 Weekly Weather <strong>and</strong> Crop Bulletin 5(Continued from front cover)dry air settled across the Corn Belt <strong>and</strong> much of the South. In fact,late-week freezes ended the growing season on October 2-3,roughly on schedule, across much of the upper Midwest. Corn <strong>and</strong>soybeans were largely mature in the freeze-affected area,minimizing the impact of the cold snap. Previously floodedsections of the upper Midwest experienced an extended period offavorably dry <strong>weather</strong>, allowing fieldwork to gradually resume.Meanwhile on the Plains, dry <strong>weather</strong> promoted summer <strong>crop</strong>maturation <strong>and</strong> harvesting, <strong>and</strong> winter wheat planting <strong>and</strong>emergence. However, pockets of dryness on the central <strong>and</strong>southern Plains raised concerns with respect to winter wheatestablishment. Elsewhere, mostly dry <strong>weather</strong> <strong>and</strong> record-settingwarmth prevailed in the West. On September 27, all-time-recordhighs were established at a few locations in southern California,including downtown Los Angeles. <strong>The</strong> warmth favored fieldwork,including winter wheat planting in the Northwest, rice harvestingin California, <strong>and</strong> cotton harvesting in Arizona.Record-setting warmth prevailed for the entire week in the West.In Nevada, Ely posted eight consecutive daily-record highs fromSeptember 25 - October 2, including a maximum of 91 o F onSeptember 28. Prior to this year, Ely had never reached orexceeded 90 o F after September 17. Elsewhere in Nevada, Elkocollected six daily-record highs in a row from September 27 -October 2. On October 1, Nevada locations such as Winnemucca(94 o F), Elko (92 o F), <strong>and</strong> Ely (86 o F) tallied monthly record highs.Elko reached the 90-degree mark for the first time on record inOctober, surpassing the monthly st<strong>and</strong>ard of 89 o F set on October 8,1917. In Utah, Salt Lake City (89 o F on October 1) tied a monthlyst<strong>and</strong>ard first achieved on October 3, 1963. Farther south, Tucson,AZ (102 o F on October 1), tied a monthly record first established onOctober 3, 1993. <strong>The</strong> previous day, Tucson (104 o F on September30) had notched its 16 th day of triple-digit heat during the month,tying a September record first set in 1953. Meanwhile in southernCalifornia, a stunning, late-season heat wave peaked on September27 with all-time-record highs of 111 o F in Long Beach <strong>and</strong> 113 o F indowntown Los Angeles. Long Beach tied the record originally seton October 15, 1961, while Los Angeles eclipsed the former markof 112 o F established on June 26, 1990. Western daily-record highsin excess of 110 o F included 115 o F (on September 27) in DeathValley, CA; 111 o F (on September 26) in Yuma, AZ; <strong>and</strong> 111 o F (onSeptember 26) in Palm Springs, CA.Farther east, stations completing their driest September on recordincluded Rawlins, WY (a trace; previously, 0.10 inch in 1953 <strong>and</strong>1957); Alex<strong>and</strong>ria, LA (0.07 inch; previously, 0.20 inch in 1914),<strong>and</strong> Louisville, KY (0.12 inch; previously, 0.18 inch in 2004).Shreveport, LA, completed its warmest, driest August-Septemberperiod on record, with an average temperature of 84.8 o F(previously, 84.7 o F in 2005) <strong>and</strong> rainfall totaling 0.97 inch(previously, 1.11 inches in 1899). Meanwhile, Nicole existed as atropical storm for only a few hours on September 29 over Cuba <strong>and</strong>the Florida Straits before becoming entangled in a cold frontdraped along the U.S. East Coast. Copious tropical moisture <strong>and</strong>a significant frontal wave of low pressure preceded Nicole; thestorm’s remnant circulation finally reached the middle <strong>and</strong>northern Atlantic Coast States from late September 30 intoOctober 1. Earlier, heavy rain had developed across the Southeaston September 26, when Macon, GA (4.20 inches), netted a dailyrecordtotal. <strong>The</strong> following day, September 27, featured 10.33inches of rain in Wilmington, NC. It was Wilmington’s secondwettestday on record behind the Hurricane Floyd-induced total of13.38 inches on September 15, 1999. Floyd’s final total inWilmington was 19.06 inches from September 14-16, 1999.During the last 5 days of September, 22.54 inches of rain delugedWilmington. Numerous Mid-Atlantic locations posted consecutivedaily-record rainfall amounts on September 30 <strong>and</strong> October1, when 2-day totals reached 8.08 inches in Allentown, PA, <strong>and</strong>7.58 inches in Wilmington, DE. Binghamton, NY (4.24 inches onSeptember 30), experienced its wettest day on record, toppling the4.05-inch st<strong>and</strong>ard established on June 27, 2006. Schoharie Creekat Prattsville, NY, surged 5.38 feet above flood stage on October1—the highest level since April 3, 2005. In southeasternPennsylvania, Chester Creek near Chester climbed 9.54 feetabove flood stage on October 1—the highest level since September16, 1999. Baltimore, MD (6.02 inches on September 30), reportedits second-wettest day on record, behind only 7.62 inches on August23, 1933. Similarly, Norfolk, VA (7.85 inches on September 30),noted its second-wettest day behind only 8.93 inches on September1, 2006. In addition, Cape Hatteras, NC, clocked a peak wind gustto 60 mph on September 30. Elsewhere, rivers began to recede inthe upper Midwest. <strong>The</strong> Minnesota River at Henderson, MN,crested on September 28 at a record-high 8.08 feet above floodstage (previously, 7.65 feet on April 11, 1965).Very cool <strong>weather</strong> prevailed in Alaska, while showery conditionswere mostly confined to southern <strong>and</strong> western parts of the state.Near Fairbanks, Eielson Air Force Base (3 o F on September 28)posted a monthly record low, previously established with a readingof 5 o F on September 27, 1992. Bettles (0 o F on September 27 <strong>and</strong>28) tied a monthly record first set on September 23, 1992. OnSeptember 28, lows dipped to -5 o F in Chicken <strong>and</strong> Circle HotSprings. Meanwhile, southeastern Alaska completed an oddmonth that featured nearly 2 weeks of dry <strong>weather</strong> between early<strong>and</strong>late-September wetness. All of Juneau’s 6.24-inch monthlyrainfall occurred from September 1-9 <strong>and</strong> 23-30. Farther south,Hawaii’s drought situation remained virtually unchanged. On theBig Isl<strong>and</strong> at Hilo, the September rainfall of 2.75 inches (30percent of normal) left its year-to-date total at 37.05 inches (41percent). On Oahu, Honolulu netted a daily-record rainfall (0.21inch) for September 30, but had a January-September sum of just5.03 inches (46 percent of normal).U.S. Crop Production Highlights:2010 Small Grains Summary<strong>The</strong> following information was released by USDA’sAgricultural Statistics Board on September 30, 2010.All wheat production totaled 2.22 billion bushels in 2010, down2% from the August forecast but up slightly from 2009. Grain areais 47.7 million acres, down 4% from last year. Yield is a recordhigh46.7 bushels per acre, 2.3 bushels higher than last year <strong>and</strong> 1.8bushels higher than the previous record set in 2008. <strong>The</strong> levels ofproduction <strong>and</strong> changes from last year by type are: winter wheat,1.49 billion bushels, down 3%; other spring wheat, 627 millionbushels, up 7%; <strong>and</strong> Durum wheat, 111 million bushels, up 2%.Oat production is estimated at a record-low 81.9 million bushels,6% below the August forecast <strong>and</strong> down 12% from last year. Yieldis estimated at 64.6 bushels per acre, down 1.7 bushels from the lastforecast <strong>and</strong> down 2.9 bushels from the previous year. Comparedwith last year, yields decreased or stayed the same for most states,with the exception of Michigan, Texas, <strong>and</strong> several NorthwesternStates. Harvested area, at 1.27 million acres, is 4% below August<strong>and</strong> 8% below last year. This is the smallest acreage harvested forgrain on record, continuing a steady downward trend.Barley production is estimated at 182 million bushels, down 1%from the August 1 forecast <strong>and</strong> 20% below 2009. Average yield peracre, at 73.6 bushels, is up 1.3 bushels from August <strong>and</strong> up 0.6bushel from last year. This is the highest yield on record sinceestimates began in 1866. Producers seeded 2.87 million acres in2010, down 19% from last year to the lowest planted acreage onrecord. Harvested area, at 2.47 million acres, is down 3% from theAugust 1 forecast <strong>and</strong> down 21% from 2009, to the lowest levelsince 1882.
- Page 1 and 2: Volume 97, No. 40 http://www.usda.g
- Page 3: October 5, 2010 Weekly Weather and
- Page 7 and 8: October 5, 2010 Weekly Weather and
- Page 9 and 10: October 5, 2010 Weekly Weather and
- Page 11 and 12: October 5, 2010 Weekly Weather and
- Page 13 and 14: October 5, 2010 Weekly Weather and
- Page 15 and 16: October 5, 2010 Weekly Weather and
- Page 17 and 18: October 5, 2010 Weekly Weather and
- Page 19 and 20: October 5, 2010 Weekly Weather and
- Page 21 and 22: October 5, 2010 Weekly Weather and
- Page 23 and 24: October 5, 2010 Weekly Weather and
- Page 25 and 26: October 5, 2010 Weekly Weather and
- Page 27 and 28: October 5, 2010 Weekly Weather and
- Page 29 and 30: October 5, 2010 Weekly Weather and
- Page 31 and 32: October 5, 2010 Weekly Weather and
- Page 33 and 34: October 5, 2010 Weekly Weather and
- Page 35 and 36: October 5, 2010 Weekly Weather and
- Page 37 and 38: October 5, 2010 Weekly Weather and
- Page 39 and 40: October 5, 2010 Weekly Weather and
- Page 41 and 42: October 5, 2010 Weekly Weather and
- Page 43 and 44: October 5, 2010 Weekly Weather and