Protein Structures Determined by NMR - ESI
Protein Structures Determined by NMR - ESI
Protein Structures Determined by NMR - ESI

Create successful ePaper yourself
Turn your PDF publications into a flip-book with our unique Google optimized e-Paper software.
Effect of Deuteration on RelaxationDipolar contribution 1 H- 13 CDipolar contribution 2 H- 13 C
Effect of Deuteration on RelaxationSlices from an HNCA experiment of a 37 KDa protein with (lower panel) and without (upper panel 85% deuteration).
Automated Analysis of <strong>NMR</strong> AssignmentsMost programs use a general analysis scheme:1. Filter peaks (filtering) and relate resonances fromdifferent spectra (referencing).2. Group resonances into spin systems.3. Identify the amino acid type of spin system.4. Identify and link sequential spin systems into segments.5. Map spin-system segments onto the primary sequence ofthe protein.
<strong>Protein</strong> Structure Determination <strong>by</strong> <strong>NMR</strong>Purification et Labeling of <strong>Protein</strong>sResonance Assignments(Chemical Shifts)Collect Structural Constraintsand determine structure.
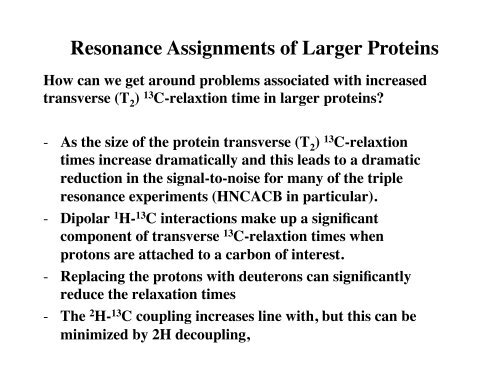
<strong>Protein</strong> <strong>Structures</strong> <strong>Determined</strong> <strong>by</strong> <strong>NMR</strong>• Development began in the middle of the 1980s, but most of theearly structures were of small proteins or peptides• You do not determine a single structure as in X-Raycrystallography, but rather an ensemble of structures thatsatisfy both the <strong>NMR</strong> experimental constraints and generalstructural constraints.• In general, the more <strong>NMR</strong> experimental restraints that areused, the better the precision of the structures calculated.• Advancements in techniques (Triple resonance, TROSY) andequipment (magnets and computers) have increased the size ofthe molecules that can be studies (proteosome, chaperones) aswell as improved the quality of the structures determined.
<strong>Protein</strong> <strong>Structures</strong> <strong>Determined</strong> <strong>by</strong> <strong>NMR</strong>Examples of algorithms used:• Simulated Annealing (SA) in both Cartesian andtorsion angle space• Metric matrix distance geometry (DG).• Minimization with a variable target function in torsionangle space.
<strong>Protein</strong> <strong>Structures</strong> <strong>Determined</strong> <strong>by</strong> <strong>NMR</strong>Websites:CNS - http://cns.csb.yale.edu/v1.1/X-PLOR - http://xplor.csb.yale.edu/xplor/X-PLOR-NIH - http://nmr.cit.nih.gov/xplor-nih/CYANA/DYANA http://www.las.jp/prod/cyana/eg/index.htmlARIA - http://www.pasteur.fr/recherche/unites/Binfs/aria/
<strong>Protein</strong> <strong>Structures</strong> <strong>Determined</strong> <strong>by</strong> <strong>NMR</strong>References:CNS - Brünger, A. T. et al. Acta Cryst. D 1998, 54, 905.X-PLOR-NIH - Schwieters, C. D. et al. J. Mag. Reson. 2003,160, 65.DYANA/CYANA - Güntert, P. et al. J. Mol. Biol. 1997, 273, 283and Güntert, P. Prog. <strong>NMR</strong> Spectrosc. 2003, 43, 105-125.ARIA - Linge, J. P. et al. Bioinformatics 2003, 19, 315-316.
<strong>Protein</strong> <strong>Structures</strong> <strong>Determined</strong> <strong>by</strong> <strong>NMR</strong>E cov :• Deviations from ideal geometry must be kept to aminimum since the values for bond lengths, angles,planarity and chirality are know to very high accuracy.• Depending on the algorithm used systematic biasing mayarise when calculating the structure.• Uncertainties associated with the term can introduce anerror in the 0.3 Å range.
<strong>Protein</strong> <strong>Structures</strong> <strong>Determined</strong> <strong>by</strong> <strong>NMR</strong>Building topology files:• Regardless of the program used to calculate the structurean energy function is defined for each amino acid.• We start <strong>by</strong> building a model based on knowninformation for CNS this includes parameter files andtopology files.Topology file for alanine:groupatom N type=NH1 charge=-0.36 endatom HN type=H charge= 0.26 endatom CA type=CH1E charge= 0.00 endatom HA type=HA charge= 0.10 endatom CB type=CH3E charge=-0.30 endatom HB1 type=HA charge= 0.10 endbond N HNbond N CA bond CA HAbond CA CB bond CB HB1 bond CB HB2 bondCB HB3bond CA Cbond C O…etc…
ond N HNbond N CA bond CA HAbond CA CB bond CB HB1 bond CB HB2 bond CB HB3bond CA Cbond C O…etc…
<strong>Protein</strong> <strong>Structures</strong> <strong>Determined</strong> <strong>by</strong> <strong>NMR</strong>E vdw :• All structures must display good non-bonded contacts tobe accepted.• There is more uncertainty with this term.• It may be represented as a simple van der Waalsrepulsion term or it may be a complete energy functionterm that includes an electrostatic and hydrogen bondingpotential.• Uncertainties associated with the term can introduce anerror in the 0.3 Å range.
<strong>Protein</strong> <strong>Structures</strong> <strong>Determined</strong> <strong>by</strong> <strong>NMR</strong>Steps in <strong>NMR</strong>-based Structure Calculations:1) Data Input2) Structure Determination Protocol3) Acceptance Test4) Analysis of the <strong>Structures</strong>
<strong>Protein</strong> <strong>Structures</strong> <strong>Determined</strong> <strong>by</strong> <strong>NMR</strong>Types of <strong>NMR</strong> Experimental Restraints:1) NOE-derived distance constraints2) Torsion angle restraints3) Chemical shift restraints4) Hydrogen bond restraints5) Residual dipolar coupling restraints
Outline of Structure Calculation ProtocolResonance Assignments(a) sequential(b) side chainsIdentification of SecondaryStructure ElementsChemical Shifts1(a) H: N and C!13(b) C: C!, C", C'(C) TALOSTorsion Angles(a) coupling constants(b) seqeuntial NOEs(c) TALOSIterativeIterativeStructureDeterminationProtocolDistance Restraints(a) short range NOEs(b) medium range NOEs(c) long range NOEsIterativeHighResolutionStructureAngular Restraints1 1(a) H-N, H-C! RDCs(b) N-C' RDCs(c) N-C! RDCs
Structure CalculationsAn ensemble of structures is calculated. Each of thestructures in the ensemble must satisfy les followingconstraints:1) The <strong>NMR</strong>-derived constraints (NOE, Angle).2) The covalent structure of the protein.3) Other constraints (Van der Waals,electrostatics, etc.).
The NOESY Spectra- The NOESY spectra (NOE SpectroscopY) is the standardexperiment for determining NOE correlations.-It is a transfer of magnetization between proton A andproton B that are close to one another in space (r ≤ 5.0 Å).- The intensity of the signal is proportional to the interresiduedistance.
Nuclear Overhauser Effect (NOE)
Types of NOESY Spectra3D 15 N-NOESY3D 13 C-NOESYHomonucléaire (2D 1 H- 1 H NOESY)
Examples of 3D NOESY Experiments3D 15 N-NOESY3D 13 C-NOESY3D 15 N/ 13 C -NOESY
NOEs in Structure Determination- Signal intensities in NOESY experiments are proportional todistances at short mixing time.
NOEs in Structure Determination- NOEs provide the main source of geometric information fromthe experimental data.- The α-helices and β-sheets present distinct patterns of shortrange NOEs.- NOEs are short in distance (≤ 5.0 Å), but they are restrictivewhen they are far apart in the primary sequence of the protein. - NOE intensities are converted to approximate distant restraintswith lower and upper bounds. Strong: 1.8 – 2.7 Å Medium: 1.8 – 3.3 Å Weak: 1.8 – 5.0 Å Very Weak: 3.0 – 6.0 Å.
NOEs in Structure Determination- In structure calculation protocols you put in long lists of NOErestraints. These are the main experimental restraints instructure calculation protocols.Example of input file for CNS:assign (resid 2 and name HG2#) (resid 3 and name HN) 4.0 2.2 1.5 !#A 762 2.78e+05assign (resid 2 and name HB) (resid 3 and name HN) 4.0 2.2 1.0 !#A 760 2.82e+05assign (resid 2 and name HA) (resid 3 and name HN) 2.5 0.7 0.4 !#A 34 2.36e+06assign (resid 2 and name HG1#) (resid 3 and name HN) 2.5 0.7 0.9 !#A 23 1.27e+06assign (resid 2 and name HG2#) (resid 46 and name HN) 4.0 2.2 1.5 !#A 637 1.85e+05assign (resid 2 and name HG1#) (resid 56 and name HN) 3.0 1.2 1.2 !#A 348 8.33e+05
Types of Helices3.10- φ= -74.0° and ϕ= --4.0°pi- φ= -57.1° and ϕ= -69.7°
NOE Patterns in α-Helices and β-Sheets α-Helices:
Anti-parallel β-sheet
Parallel β-sheet
Parallel vs. anti-parallel β-sheets* Parallel sheets tend to be more regular if one examinesthe φ and ϕ angles.* Anti-parallel sheets have H-bonds perpendicular to thestrands and alternate narrow and widely spaced pairs.* Parallel sheets have equally spaced H-bonds that angleacross the strands.
NOE patterns is β-sheet
Overview of tight(β) turns* They have a succession of different φ and ϕ values foreach residue.* They have a H-bond between the >C=0 of residue iand the >N-H of residue i+3.* Backbone at either end of Type I or II turn is in theright position to continue an anti-parallel β-ribbon.
Type I turn
Type II turn
NOEs in β turns
NOE patterns as a function of 2°structure
Pictorial of NOEs in a structure
Coupling constants and torsion angles• It is possible to directly refine structures againsta HN-C ! H three-bond coupling constants aswell as conformational data bases.• There is a very good experiment to accuratelymeasure 3 JH N! (3DHNHA)• Although Karplus curve is symmetric about " =-120°, other experimental data allows us toresolve the ambiguity.
Correlation between 3 J hnα and 2°StructurePardi et al, J. Mol. Biol 180, 741-751 1984
3D- HNHA experiment for 3 J hnα
TALOS* Database system for empirical prediction of phi and psibackbone angles.* Uses a combinations of five kinds (HA, CA, CB, CO ,N) of chemical shifts.* Like CSI relies on fact that many secondary chemicalshifts are highly correlated with aspects to proteinsecondary structure.* It uses triplets of amino acids to make predictions.Reference: Cornilescu, Delaglio and Bax, J. Biomol. <strong>NMR</strong> 13, 289-302 (1999).
Talos Random Coil TableRES HA C CA CB NA 4.32 177.8 52.3 19.0 123.8C 4.55 174.6 56.9 28.9 118.8C 4.71 174.6 55.4 43.7 118.6D 4.64 176.3 54.0 40.8 120.4E 4.35 176.6 56.4 29.7 120.2F 4.62 175.8 58.0 39.0 120.3G 3.96 174.9 45.1 9999. 108.8H 4.73 173.3 54.5 27.9 118.2I 4.17 176.4 61.3 38.0 119.9K 4.32 176.6 56.5 32.5 120.4L 4.34 177.6 55.1 42.3 121.8M 4.48 176.3 55.3 32.6 119.6N 4.74 175.2 52.8 37.9 118.7P 4.42 177.3 63.1 31.7 135.8Q 4.34 176.0 56.1 28.4 119.8R 4.34 176.3 56.1 30.3 120.5S 4.47 174.6 58.2 63.2 115.7T 4.35 174.7 62.1 69.2 113.6V 4.12 176.3 62.3 32.1 119.2W 4.66 176.1 57.7 30.3 121.3Y 4.55 175.9 58.1 38.8 120.3
The TALOS triplet systemTALOS searches database for the ten best matches to agiven triplet in the target protein.
Reliability of TALOS* makes no prediction on 20-45% of the residues in proteins.* makes predictions for about 65% of the residues onaverage.* in 5 of 20 proteins studied the results included no badpredictions.* about 3% of the predictions were bad!!!* the uncertainty for good predictions was 14 degrees for phiand 13 degrees for psi.Web Site: http://spin.niddk.nih.gov/bax/software/TALOS/info.html
Example of TALOS output
Chemical shifts and 2°structure* One can often quickly determine the 1 H, 15 N and 13 Cchemical shifts with triple resonance experiments.* There is a correlation between chemical shift deviations andsecondary structure elements.* These deviations are from random coil values* Most important ones are CO, HA and CA.For a good recent reference on measuring chemical shift of amino acids in randomcoils see: Schwarzinger et al, J. Am. Chem. Soc 121, 2970-2978 (2001)
Correlation between 2°Structure and 13 C ShiftsDeviations from random coil valuesReference: Spera and Bax, J. Am. Chem. Soc. 113, 5490-5492 (1991)
Chemical shift index (CSI)* Fast, simple and reliable method to assign secondarystructure.* It is based on a statistical analysis of chemical shifts inproteins of known structure.* CSI=0: δ in range of random coil values* CSI= +1 or -1: δ is greater or less than random coilchemical shift values.* Must consider at least four residues to define an elementof secondary structure.Reference: Wishart and Yip, Biochem. and Cell Biol. 76, 153-176 (1998)
CSI RANDOM COIL VALUESRES HA C CA CB N HNA 4.32 177.8 52.5 19.1 123.8C 4.55 174.6 58.2 28.0 118.8C 4.71 174.6 55.4 41.1 118.6D 4.64 176.3 54.2 41.1 120.4E 4.35 176.6 56.6 29.9 120.2F 4.62 175.8 57.7 39.6 120.3G 3.96 174.9 45.1 9999. 108.8H 4.73 174.1 55.0 29.0 118.2I 4.17 176.4 61.1 38.8 119.9K 4.32 176.6 56.3 33.1 120.4L 4.34 177.6 55.1 42.4 121.8M 4.48 176.3 55.4 32.9 119.6N 4.74 175.2 53.1 38.9 118.7P 4.42 177.3 63.3 32.1 135.8Q 4.34 176.0 55.7 29.4 119.8R 4.34 176.3 56.0 30.9 120.5S 4.47 174.6 58.3 63.8 115.7T 4.35 174.7 61.8 69.8 113.6V 4.12 176.3 62.2 32.9 119.2W 4.66 176.1 57.5 29.6 121.3Y 4.55 175.9 57.9 37.8 120.3
CSI Scoring and 2°Structure!-helix "-sheetCSI (CO) +1 -1CSI (C!) +1 -1CSI (H!) -1 +1CSI (C") n.a. +1
Example of CSI analysisCα COResidue # 10 20 30 40 50 60 70 80
ConsensusHαSecondary structure: α1 α 2 α3 β1 β2Residue # 10 20 30 40 50 60 70 80
• Currently, there is no experiment to directlymeasure hydrogen bonds present in proteins.Hydrogen bond restraints• Hydrogen bonds can be modeled base on knownsecondary structure elements and <strong>by</strong> measuringslowly exchanging amide protons in deuteriumoxide.• Direct measurement of hydrogen bonds inproteins is rare but new sequence are beingdeveloped that should be more common in thenext couple of years.
Detection of slowly exchanging amide protons
Hydrogen bonds is β-sheet
Residual dipolar couplings• Provide long range angular constraints• They are not redundant with NOE constraints• They can be used to validate structures.• They can help provide relative orientations ofsubunits within a complex.
Residual Dipolar CouplingsPrestegard, Nat. Struct. Biol. 5, 517, 1998
RDCs: Weak alignment media (bicelle)DHPC/DMPCPrestegard, Nat. Struct. Biol. 5, 517, 1998.
RDCs:Weak alignment media (bicelle)Isotropic 4.5% w/v 85 w/v Bax, Prot. Sci. 12, 1, 2003.DHPC/DMPC
RDCs: Tunable alignment media (Phage)Hansen et al., Nature Struct. Biol. 5, 1065, 1998.
RDCs: Tunable alignment media (Phage)de Alba et al., Prog. Nucl. Mag. Res. Spec. 40, 175, 2002.
RDCs: Tunable alignment media (Phage)-Phage+ PhageHansen et al., Nature Struct. Biol. 5, 1065, 1998.
RDCs: Determining alignment tensorBax, Prot. Sci. 12, 1, 2003
RDCs: Measurement in multiple alignment mediaBax, Prot. Sci. 12, 1, 2003.
RDCs and structure validationBax, Prot. Sci. 12, 1, 2003.
Structure Calculations: Accepted <strong>Structures</strong>- Criteria for acceptance of structures:lowest energy and smallest violations ofconstraints.- The accepted structures arerepresented in a superposition thatminimizes the RMSD (root-meansquare-deviation)of the positions of theheavy atoms. - This superposition defines theprecision of the structures. TFIIF + FCP1
<strong>Protein</strong> Structure Determination <strong>by</strong> <strong>NMR</strong>Purification et Labeling of <strong>Protein</strong>sResonance Assignments(Chemical Shifts)Collect Structural ConstraintsStructure CalculationsValidation
Validation of <strong>Structures</strong>• R factor for NOEs: n ~ 1/6R = Σ NOEs [(I obs ) n - (I calc ) n ] / Σ NOEs [(I obs ) n • Other Statistics: RMSD of backbone and all atoms.• NOE Violations• Molecular Energy• PROCHECK-<strong>NMR</strong>
Validation of <strong>Structures</strong>PROCHECK <strong>NMR</strong> performs a number of checks to determinethe overall quality of each structure in the ensemble:• Covalent Geometry• Dihedral Angles (Ramachandran Plot)• Planarity and Chirality• Non-bonded interactions• Main chain hydrogen bonds• Stereochemical parameters. References:Laskowski R A, MacArthur M W, Moss D S & Thornton J M (1993) J. Appl. Cryst., 26, 283-291Morris A L, MacArthur M W, Hutchinson E G & Thornton J M (1992) <strong>Protein</strong>s, 12, 345-364http://www.biochem.ucl.ac.uk/~roman/procheck/procheck.html
Validation of <strong>Structures</strong>Ramachandran Plot:- Examines the distribution ofPhi-psi angle combination.- Divides the results into four categories.- Ideally all of the dihedral anglecombinations should be in the favoured or allowed groups.
Structural Studies in Drug Design
Structural Studies in Drug DesignHow can we best use the data base of three-dimensionalstructures to help us more efficiently design drugs?• X-ray Crystallography- HIV protease inhibitor• <strong>NMR</strong> Spectroscopy- SAR <strong>by</strong> <strong>NMR</strong>• Computational modeling- in silico docking
Role of X-ray crystallography• Capable of providing very high resolution structures which are needed todetermine precise atomic level descriptions of ligand binding sites.• Things often crystallize better in the presence of ligand as a result ofincreased stability (less floppy regions).• Once crystallization techniques have been worked out for one complex,they should be fairly similar with subsequent complexes (Soaking)• Well-suited for studying small samples of molecules that have beenscreened <strong>by</strong> a previous method but not ideally suited for screening lagelibraries of compounds.
Role of <strong>NMR</strong> spectroscopy• It is not always possible to get high enough resolution needed fordrug design.• Limited to smaller macromolecules, more or less 30 kDa or less forhigh resolution.• It is suited for rapid screening of large number of molecules aspotential ligands using SAR <strong>by</strong> <strong>NMR</strong>.• It can be very quick at mapping residues that are altered followingligand binding.
Why is it so hard?• <strong>Protein</strong>s exist in many different conformational states which influenceand are influenced <strong>by</strong> ligand binding.• A single fixed protein structure represents only a very narrow windowfor ligand binding.• We must learn how to accommodate loop fluctuations and domainmovement in our design regimens.• We must learn how to deal with solvents and electrostatic interactionsif we hope to make more accurate predictions of binding strengths.
SAR <strong>by</strong> <strong>NMR</strong>• <strong>NMR</strong>-based screening method based on fragmentation approach.• Uses a simple (quick) experiment to identify small organic moleculesthat bind to proximal subsites of a protein.• The molecules are then linked together to produce high-affinityligands.• This can be extremely powerful when used with small moleculelibraries to identify lead-compounds.Shuker et al., Science 274, 1531-1534 (1996).
Outline of SAR <strong>by</strong> <strong>NMR</strong>
Outline of SAR <strong>by</strong> <strong>NMR</strong>Shuker et al., Science 274, 1531-1534 (1996).
Outline of SAR <strong>by</strong> <strong>NMR</strong>Shuker et al., Science 274, 1531-1534 (1996).
Outline of SAR <strong>by</strong> <strong>NMR</strong>Shuker et al., Science 274, 1531-1534 (1996).
Outline of SAR <strong>by</strong> <strong>NMR</strong>Shuker et al., Science 274, 1531-1534 (1996).
Outline of SAR <strong>by</strong> <strong>NMR</strong>Shuker et al., Science 274, 1531-1534 (1996).
SAR <strong>by</strong> <strong>NMR</strong> applied to Bcl-x L • Bcl (B-Cell Lymphoma) family of proteins plays a key role inmaintenance of normal cellular homeostasis.• Overexpression leads to oncogenic transformations and plays arole in drug resistance in certain forms of cancer.• The family of protein consists of both antiapoptotic (Bcl-2, Bcl-xL)and proapoptotic (Bak, Bax, Bad) members.• The structure consists of two hydrophobic helices surrounded <strong>by</strong> 5to 7 amphipathic helices.• The antiapoptotic members have a groove that binds to an α-helice(BH3) present in the proapoptotic members.Petros et al., J Med Chem 49, 656-663 (2006).
Identification of first Bcl-x L site.• Performed <strong>NMR</strong> based screen to identify molecules that wouldcompete with binding of proapoptotic proteins to Bcl-x L .• Identified that several biaryl compounds bound to the samebinding pocket of Bcl-x L as proapoptotic proteins.• These compounds bind in the same position as a conserved leucineresidue in the BH3 helice• This served as first binding site for SAR <strong>by</strong> <strong>NMR</strong> protocol appliedto Bcl-x L .Petros et al., J Med Chem 49, 656-663 (2006).
Affinities of selected biaryl compounds to Bcl-x L Petros et al., J Med Chem 49, 656-663 (2006).
Biaryl acid bound to Bcl-x L Black: HSQC of 15 N-Bcl-x L .Red: HSQC of 15 N-Bcl-x L with biaryl acid (Compound 1).Petros et al., J Med Chem 49, 656-663 (2006).
Identification of first Bcl-x L site.• Performed additional <strong>NMR</strong> based screen to identify molecules thatwould bound to a different region of Bcl-x L .• Identified that several aromatic compounds that bound to andadjacent binding pocket of Bcl-x L as proapoptotic proteins.• These compounds bind in the same position as a conservedisoleucine residue in the BH3 helice.• This served as second binding site for SAR <strong>by</strong> <strong>NMR</strong> protocolapplied to Bcl-x L .Petros et al., J Med Chem 49, 656-663 (2006).
Affinities of selected second site Bcl-x L bindersPetros et al., J Med Chem 49, 656-663 (2006).
Napthol analog bound to Bcl-x LBlack: HSQC of 15 N-Bcl-x L .Red: HSQC of 15 N-Bcl-x L with biaryl acid (Compound 1).Green: HSQC of 15 N-Bcl-x L with napthol (Compound 11).Petros et al., J Med Chem 49, 656-663 (2006).
SAR <strong>by</strong> <strong>NMR</strong> applied to Bcl-x L Compound 11Compound 1Petros et al., J Med Chem 49, 656-663 (2006).
SAR <strong>by</strong> <strong>NMR</strong> applied to Bcl-x L Petros et al., J Med Chem 49, 656-663 (2006).
SAR <strong>by</strong> <strong>NMR</strong> applied to Bcl-x L Petros et al., J Med Chem 49, 656-663 (2006).
SAR <strong>by</strong> <strong>NMR</strong> applied to Bcl-x L Petros et al., J Med Chem 49, 656-663 (2006).
Affinities of acylsulfonamides to Bcl-x L Petros et al., J Med Chem 49, 656-663 (2006).
SAR <strong>by</strong> <strong>NMR</strong> applied to Bcl-x L Petros et al., J Med Chem 49, 656-663 (2006).
Structure of compound 31 bound to Bcl-x L Petros et al., J Med Chem 49, 656-663 (2006).