P259E Laboratory Manual
P259E Laboratory Manual
P259E Laboratory Manual

Create successful ePaper yourself
Turn your PDF publications into a flip-book with our unique Google optimized e-Paper software.
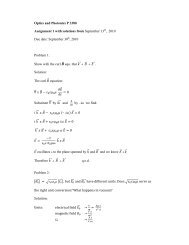
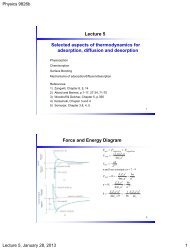
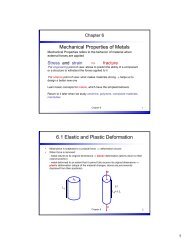
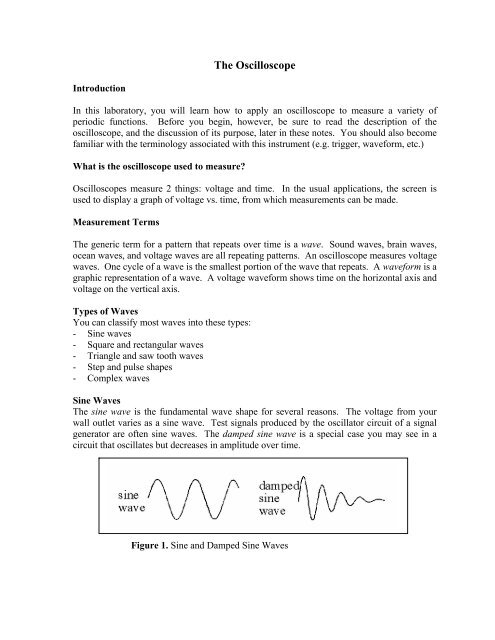
The OscilloscopeIntroductionIn this laboratory, you will learn how to apply an oscilloscope to measure a variety ofperiodic functions. Before you begin, however, be sure to read the description of theoscilloscope, and the discussion of its purpose, later in these notes. You should also becomefamiliar with the terminology associated with this instrument (e.g. trigger, waveform, etc.)What is the oscilloscope used to measure?Oscilloscopes measure 2 things: voltage and time. In the usual applications, the screen isused to display a graph of voltage vs. time, from which measurements can be made.Measurement TermsThe generic term for a pattern that repeats over time is a wave. Sound waves, brain waves,ocean waves, and voltage waves are all repeating patterns. An oscilloscope measures voltagewaves. One cycle of a wave is the smallest portion of the wave that repeats. A waveform is agraphic representation of a wave. A voltage waveform shows time on the horizontal axis andvoltage on the vertical axis.Types of WavesYou can classify most waves into these types:- Sine waves- Square and rectangular waves- Triangle and saw tooth waves- Step and pulse shapes- Complex wavesSine WavesThe sine wave is the fundamental wave shape for several reasons. The voltage from yourwall outlet varies as a sine wave. Test signals produced by the oscillator circuit of a signalgenerator are often sine waves. The damped sine wave is a special case you may see in acircuit that oscillates but decreases in amplitude over time.Figure 1. Sine and Damped Sine Waves
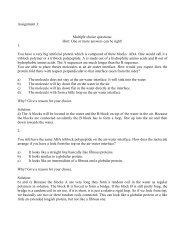
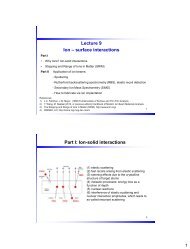
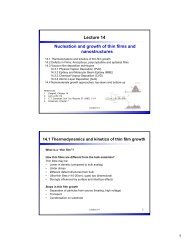
Square and Rectangular WavesThe square wave is another common wave shape. Basically, a square wave is a voltage thatturns on and off (or goes high and low) at regular intervals. Television, radio, and computercircuitry often use square waves for timing signals. The rectangular wave is like the squarewave except that the high and low time intervals are not of equal length.Figure 2. Square and Rectangular WavesSawtooth and Triangle WavesSawtooth and Triangle waves result from circuits designed to control voltages linearly, suchas the horizontal sweep of an analog oscilloscope or the raster scan of a television. Thetransitions between voltage levels of these waves change at a constant rate. These transitionsare called ramps.Figure 3. Sawtooth and Rectangular WavesStep and Pulse ShapeSignals such as steps and pulses that only occur once are called single-shot or transientsignals. The step indicates a sudden change in voltage, similar to what you would see if youturned on a power switch. The pulse indicates what you would see if you turned a powerswitch on and then off again. A collection of pulses traveling together creates a pulse train.Digital components in a computer communicate with each other using pulses. Pulses are alsocommon in x-ray, radar and communications equipment.Figure 4. Step, Pulse, and Pulse Train Shapes2
Frequency and PeriodIf a signal repeats, it has a frequency f. The frequency is measured in Hertz (Hz) and equalsthe number of times the signal repeats itself in one second. A repeating signal also has aperiod T: this is the amount of time it takes the signal to complete one cycle. Period andfrequency are reciprocals of each other:T = 1 f . So, for example, the sine wave featuredbelow has a frequency of 3 Hz and a period of 1/3 second.Figure 5. Frequency and PeriodVoltageVoltage is the difference in electric potential between two points in a circuit. Usually one ofthese points is ground (zero volts) but not always: you may want to measure the voltage fromthe maximum peak to the minimum peak of a waveform, referred to at the peak-to-peakvoltage. The word amplitude commonly refers to the maximum voltage of a signal measuredfrom ground or zero volts. The waveform shown below has an amplitude of 1 V and a peakto-peakvoltage of 2 V.PhasePhase is best explained by looking at a sine wave. The voltage level of sine waves is basedon circular motion, and a circle has 360 ο . One cycle of a sine wave has 360 ο , as shownbelow. Using degrees, you can refer to the phase angle of a sine wave when you want todescribe how much of the period has elapsed.Figure 6. Sine Wave (Degrees)3
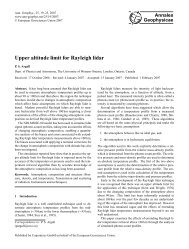
Phase shift describes the difference in timing between two otherwise similar signals. In thefigure below, the waveform labeled “current” is said to be 90 ο out of phase with thewaveform labeled “voltage,” since the waves reach similar points in their cycles exactly ¼ ofa cycle apart (360 ο /4 = 90 ο ).Figure 7. Phase ShiftBandwidthThe bandwidth specification tells you the frequency range the oscilloscope accuratelymeasures. As signal frequency increases, the capability of the oscilloscope to accuratelyrespond decreases. By convention, the bandwidth tells you the frequency at which thedisplayed signal reduces to 70.8% of the applied sine wave signal. (This 70.8% point isreferred to as the “-3 dB point,” a term based on a logarithmic scale).Rise TimeRise time is another way of describing the useful frequency range of an oscilloscope. Risetime may be a more appropriate performance consideration when you expect to measurepulses and steps. An oscilloscope cannot accurately display pulses with rise times faster thanthe specified rise time of the oscilloscope.Sweep SpeedFor analog oscilloscopes, this specification indicates how fast the trace can sweep across thescreen allowing you to see fine details. The fastest sweep speed of an oscilloscope is usuallygiven in nanoseconds/div.The TRIGGERThe scope produces an on-screen graph of voltage vs. time, which is continuously updated.For a periodic signal, we need a way to arrange the graph so that each subsequent drawing ofthe trace is synchronized with the one before; consider the following illustration:4
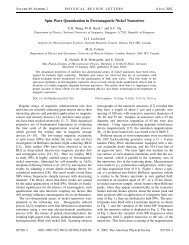
Figure 8. Illustration of successive signal overlays as they might appear on the screen.The first part of the record (labeled 1) appears as “trace 1” on the screen. Then a new traceappears on the screen, shown by the grey line “2”. Hence we will see the signal on thescreen, but it will appear to be “flicking back and forth” as each new trace is formed. In thelimit, we may well see nothing but a “blur” of mixed up signals.What we really want to do is make each trace essentially “lie on top of” the previous sweep.In order to allow this to happen, an oscilloscope has a special timing device called aTRIGGER. The trigger is used to tell the scope when it should start its trace across thescreen. Thus whereas originally we let the trace begin again at point C in the diagram above,we now make the scope wait until we have reached the point C′ in the above diagram. Onlythen do we allow a trace to begin. The point C′ was chosen because it appears at the sameplace on the waveform as the point A, but one cycle later.The trigger works by only allowing the scope to begin its sweep when it encounters asignal level of V t (see diagram) which is increasing. (It is also possible to instruct the scopeto trigger only when the signal is decreasing.) In this way, each successive pulse exactlyoverlaps the previous one, allowing the observer to see a fixed image on the screen, whichcan then be studied.Figure 9. Successive signal overlays that result when a trigger is used.5
Varying the “trigger level” causes the trace to move back and forth within the screen,because you are varying the “reference value” V t . Another way to say this is that varying V tshifts the phase of the waveform that you see.In the example that we have discussed, the trigger is provided by the waveform under study.This is known as INTERNAL triggering. Sometimes, especially if you are looking at a noisysignal, it can be convenient to trigger from another pulse which is known to have the sameperiod as the pulse under investigation, but is less noisy. In this case the “clean” signal is fedinto the EXTERNAL TRIGGER of the SCOPE, and the trigger setting is set to EXTERNAL.The reference signal is often chosen to be a square wave, so it produces a sharp, clean triggere.g. a square wave, as shown below.Figure 10. Square wave.The input of the scope is designed so that it has very little effect on the circuit being probed.A typical input resistance might be 10 7 Ω. A typical input capacitance might be 30 pF inparallel with the resistance. (1 pF =1 × 10 −12 Farads )Experiment:• 1 Oscilloscope• 2 Oscilloscope Probes• 1 Function Generator• 1 “Mystery Box” which produces various waveforms• 1 Fluke 8010A Digital Volt Meter• 1 box miscellaneous solid wire pieces, stripped at both ends (Plastic box kits)1. For each setting of the “mystery box” provided, display the output signal on theoscilloscope. Sketch the waveform, and include a complete description of the structure.Note its amplitude, frequency and any other parameters which you think might be importante.g. pulse width etc.2. Use the function generator to produce a sine wave of frequency ~1000 Hz, and use theoscilloscope to adjust its amplitude to 2 volts peak-to-peak. Demonstrate the ability tomeasure the amplitude and the frequency by two methods: (1) using the parametermeasurements built into the scope, and (2) measuring directly from the screen display of thewaveform.6