E N S W - United Nations Development Programme
E N S W - United Nations Development Programme
E N S W - United Nations Development Programme

Create successful ePaper yourself
Turn your PDF publications into a flip-book with our unique Google optimized e-Paper software.
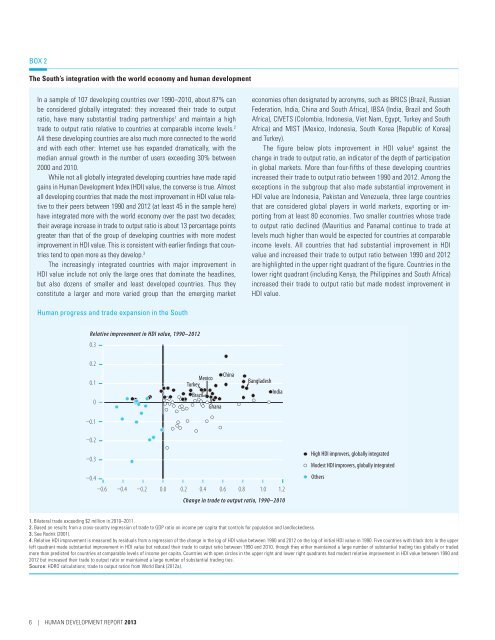
Box 2The South’s integration with the world economy and human developmentIn a sample of 107 developing countries over 1990–2010, about 87% canbe considered globally integrated: they increased their trade to outputratio, have many substantial trading partnerships 1 and maintain a hightrade to output ratio relative to countries at comparable income levels. 2All these developing countries are also much more connected to the worldand with each other: Internet use has expanded dramatically, with themedian annual growth in the number of users exceeding 30% between2000 and 2010.While not all globally integrated developing countries have made rapidgains in Human <strong>Development</strong> Index (HDI) value, the converse is true. Almostall developing countries that made the most improvement in HDI value relativeto their peers between 1990 and 2012 (at least 45 in the sample here)have integrated more with the world economy over the past two decades;their average increase in trade to output ratio is about 13 percentage pointsgreater than that of the group of developing countries with more modestimprovement in HDI value. This is consistent with earlier findings that countriestend to open more as they develop. 3The increasingly integrated countries with major improvement inHDI value include not only the large ones that dominate the headlines,but also dozens of smaller and least developed countries. Thus theyconstitute a larger and more varied group than the emerging marketeconomies often designated by acronyms, such as BRICS (Brazil, RussianFederation, India, China and South Africa), IBSA (India, Brazil and SouthAfrica), CIVETS (Colombia, Indonesia, Viet Nam, Egypt, Turkey and SouthAfrica) and MIST (Mexico, Indonesia, South Korea [Republic of Korea]and Turkey).The figure below plots improvement in HDI value 4 against thechange in trade to output ratio, an indicator of the depth of participationin global markets. More than four-fifths of these developing countriesincreased their trade to output ratio between 1990 and 2012. Among theexceptions in the subgroup that also made substantial improvement inHDI value are Indonesia, Pakistan and Venezuela, three large countriesthat are considered global players in world markets, exporting or importingfrom at least 80 economies. Two smaller countries whose tradeto output ratio declined (Mauritius and Panama) continue to trade atlevels much higher than would be expected for countries at comparableincome levels. All countries that had substantial improvement in HDIvalue and increased their trade to output ratio between 1990 and 2012are highlighted in the upper right quadrant of the figure. Countries in thelower right quadrant (including Kenya, the Philippines and South Africa)increased their trade to output ratio but made modest improvement inHDI value.Human progress and trade expansion in the SouthRelative improvement in HDI value, 1990–20120.30.20.10–0.1ChinaTurkey MexicoBrazilGhanaBangladeshIndia–0.2–0.3–0.4–0.6 –0.4 –0.2 0.0 0.2 0.4 0.6 0.8 1.0 1.2Change in trade to output ratio, 1990–2010High HDI improvers, globally integratedModest HDI improvers, globally integratedOthers1. Bilateral trade exceeding $2 million in 2010–2011.2. Based on results from a cross-country regression of trade to GDP ratio on income per capita that controls for population and landlockedness.3. See Rodrik (2001).4. Relative HDI improvement is measured by residuals from a regression of the change in the log of HDI value between 1990 and 2012 on the log of initial HDI value in 1990. Five countries with black dots in the upperleft quadrant made substantial improvement in HDI value but reduced their trade to output ratio between 1990 and 2010, though they either maintained a large number of substantial trading ties globally or tradedmore than predicted for countries at comparable levels of income per capita. Countries with open circles in the upper right and lower right quadrants had modest relative improvement in HDI value between 1990 and2012 but increased their trade to output ratio or maintained a large number of substantial trading ties.Source: HDRO calculations; trade to output ratios from World Bank (2012a).6 | Human <strong>Development</strong> Report 2013