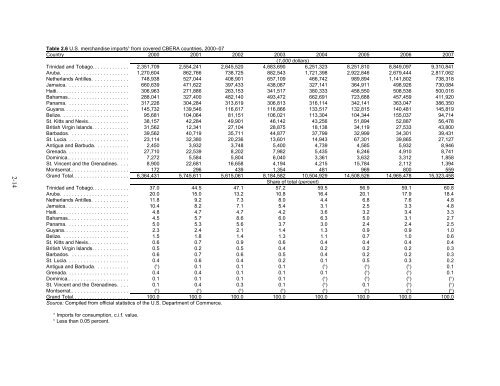
Table 2.6 U.S. merch<strong>and</strong>ise imports from covered CBERA countries, 2000–07Country 2000 2001 2002 2003 2004 2005 2006 2007(1,000 dollars)Trinidad <strong>and</strong> Tobago. . . . . . . . . . . . . 2,351,709 2,554,241 2,645,520 4,683,690 6,251,323 8,251,810 8,849,097 9,310,841Aruba. ....................... 1,270,604 862,766 738,725 882,543 1,721,398 2,922,846 2,679,444 2,817,062Netherl<strong>and</strong>s Antilles. . . . . . . . . . . . . 748,938 527,044 408,901 657,109 466,742 989,894 1,141,802 738,318Jamaica. ..................... 660,639 471,622 397,433 438,087 327,141 364,911 498,926 730,084Haiti. ........................ 306,963 271,886 263,153 341,517 380,333 458,550 508,536 500,016Bahamas...................... 288,041 327,400 482,140 493,472 662,691 723,688 457,459 411,920Panama. ..................... 317,226 304,284 313,619 306,813 316,114 342,141 363,047 386,350Guyana....................... 145,732 139,546 116,617 116,866 133,517 132,815 140,481 145,819Belize........................ 95,681 104,064 81,151 106,021 113,304 104,344 155,037 94,714St. Kitts <strong>and</strong> Nevis.. . . . . . . . . . . . . . 38,157 42,284 49,901 46,142 43,256 51,894 52,887 56,478British Virgin Isl<strong>and</strong>s. . . . . . . . . . . . . 31,562 12,341 27,104 28,875 18,138 34,119 27,533 43,800Barbados. .................... 39,562 40,719 35,711 44,877 37,799 32,999 34,301 39,431St. Lucia...................... 23,114 32,380 20,236 13,601 14,943 67,301 39,865 27,127Antigua <strong>and</strong> Barbuda. . . . . . . . . . . . 2,450 3,932 3,748 5,400 4,739 4,585 5,932 8,946Grenada...................... 27,710 22,539 8,202 7,982 5,435 6,246 4,910 8,741Dominica...................... 7,272 5,584 5,804 6,040 3,361 3,632 3,312 1,858St. Vincent <strong>and</strong> the Grenadines. . . . 8,900 22,681 16,658 4,194 4,215 15,784 2,112 1,394Montserrat..................... 172 296 439 1,354 481 969 800 559Gr<strong>and</strong> Total.................... 6,364,431 5,745,611 5,615,061 8,184,582 10,504,929 14,508,526 14,965,478 15,323,458Share <strong>of</strong> total (percent)Trinidad <strong>and</strong> Tobago. . . . . . . . . . . . . 37.0 44.5 47.1 57.2 59.5 56.9 59.1 60.8Aruba. ....................... 20.0 15.0 13.2 10.8 16.4 20.1 17.9 18.4Netherl<strong>and</strong>s Antilles. . . . . . . . . . . . . 11.8 9.2 7.3 8.0 4.4 6.8 7.6 4.8Jamaica. ..................... 10.4 8.2 7.1 5.4 3.1 2.5 3.3 4.8Haiti. ........................ 4.8 4.7 4.7 4.2 3.6 3.2 3.4 3.3Bahamas...................... 4.5 5.7 8.6 6.0 6.3 5.0 3.1 2.7Panama. ..................... 5.0 5.3 5.6 3.7 3.0 2.4 2.4 2.5Guyana....................... 2.3 2.4 2.1 1.4 1.3 0.9 0.9 1.0Belize........................ 1.5 1.8 1.4 1.3 1.1 0.7 1.0 0.6St. Kitts <strong>and</strong> Nevis.. . . . . . . . . . . . . . 0.6 0.7 0.9 0.6 0.4 0.4 0.4 0.4British Virgin Isl<strong>and</strong>s. . . . . . . . . . . . . 0.5 0.2 0.5 0.4 0.2 0.2 0.2 0.3Barbados. .................... 0.6 0.7 0.6 0.5 0.4 0.2 0.2 0.3St. Lucia...................... 0.4 0.6 0.4 0.2 0.1 0.5 0.3 0.2b b b bAntigua <strong>and</strong> Barbuda. . . . . . . . . . . . ( ) 0.1 0.1 0.1 ( ) ( ) ( ) 0.1bbGrenada...................... 0.4 0.4 0.1 0.1 0.1 ( ) ( ) 0.1b b b bDominica...................... 0.1 0.1 0.1 0.1 ( ) ( ) ( ) ( )b b bSt. Vincent <strong>and</strong> the Grenadines. . . . 0.1 0.4 0.3 0.1 ( ) 0.1 ( ) ( )b b b b b b b bMontserrat..................... () () () () () () () ()Gr<strong>and</strong> Total.................... 100.0 100.0 100.0 100.0 100.0 100.0 100.0 100.0Source: Compiled from <strong>of</strong>ficial statistics <strong>of</strong> the U.S. Department <strong>of</strong> Commerce.abImports for consumption, c.i.f. value.Less than 0.05 percent.
petroleum products, accounted for 61 percent <strong>of</strong> imports in 2007, while inorganic26chemicals —mostly anhydrous ammonia, a natural gas derivative <strong>and</strong> organic27chemicals —mostly methanol, also a natural gas derivative, accounted for 11 percent <strong>and</strong>8 percent, respectively (table 2.7). 28U.S. exports to the region are not as concentrated as imports. Exports vary widely,consisting <strong>of</strong> petroleum products, food (including wheat, rice, corn, <strong>and</strong> fresh or frozenpoultry), <strong>and</strong> jewelry. Five countries—Panama, The Bahamas, Jamaica, the Netherl<strong>and</strong>sAntilles, <strong>and</strong> Trinidad <strong>and</strong> Tobago—accounted for 80 percent <strong>of</strong> U.S. exports to the regionin 2007 (table 2.8).29Mineral fuels accounted for 27 percent <strong>of</strong> U.S. exports in 2007, consisting mostly <strong>of</strong>30refined petroleum products. Machinery <strong>and</strong> equipment accounted for 17 percent, consisting<strong>of</strong> a wide variety <strong>of</strong> products, including parts for heavy machinery, computer-relatedequipment, <strong>and</strong> cellular phones (table 2.9). 31Export DiversificationExports from most <strong>Caribbean</strong> countries are concentrated in a relatively narrow range <strong>of</strong>goods <strong>and</strong> services. As noted in chapter 3, concentration <strong>of</strong> production <strong>and</strong> exports in anarrow range <strong>of</strong> goods can magnify the adverse effects <strong>of</strong> external price declines <strong>and</strong> leadto increased income volatility. In part, limited export diversity is a result <strong>of</strong> the size, stage<strong>of</strong> development, <strong>and</strong> resource endowments <strong>of</strong> these countries, which do not currently haveproductive capacity to diversify into a wider range <strong>of</strong> products. The range <strong>of</strong> exports is also,in part, the result <strong>of</strong> foreign trade preferences or government policies <strong>of</strong> the <strong>Caribbean</strong>countries that may have diverted resources to a small number <strong>of</strong> goods. 32The exports <strong>of</strong> the countries covered by this report are, on average, slightly moreconcentrated than exports <strong>of</strong> other developing countries at similar income levels. A commonmeasure <strong>of</strong> export concentration is the UNCTAD concentration index, a Herfindahl-Hirschmann index for which values range from zero to one, with values closer to one33representing greater concentration. The average value <strong>of</strong> 0.44 for covered countries in2004 <strong>and</strong> 2005 was slightly higher than the average value for all developing countries <strong>of</strong>340.38 in 2005. Given that export concentration generally falls as income rises, <strong>and</strong> that thecountries26HTS chapter 28.27HTS chapter 29.28See table E.1 for the leading imports at the 4-digit HTS level. See table E.2 for the leading importsunder CBERA at the 4-digit HTS level.29Harmonized System (HS) chapter 27.30HS chapters 84 (nonelectrical machinery <strong>and</strong> equipment) <strong>and</strong> 85 (electrical machinery <strong>and</strong> equipment).31See table E.3 for the leading exports at the 4-digit HTS level.32World Bank, “A Time To Choose: <strong>Caribbean</strong> Development in the 21st Century,” 2005, 77.33UNCTAD, “Concentration <strong>and</strong> diversification indices <strong>of</strong> exports,” 2007, Table 4.1. See country pr<strong>of</strong>ilesfor Herfindahl-Hirschmann index values for countries covered in this report.34Export concentration data were available for ten countries covered by this report in 2005 <strong>and</strong> for anadditional three countries in 2004. (See chap. 4 for individual country data.) The average exportconcentration <strong>of</strong> the ten available covered countries in 2005 was 0.43 <strong>and</strong> the average <strong>of</strong> all 13 countries inboth years was 0.44. Although price changes can introduce difficulties when comparing export concentrationvalues across years, the average <strong>of</strong> all 13 countries in 2004 was 0.45, indicating that price changes had a verysmall effect on the average concentration value.2-15
- Page 7 and 8: TABLE OF CONTENTSPagePreface ......
- Page 9 and 10: TABLE OF CONTENTS-ContinuedChapter
- Page 13 and 14: List of Frequently Used Abbreviatio
- Page 15: PPPPRGFSDRSMESPSTASCTEUTIEATIFATRQU
- Page 18 and 19: the Netherlands Antilles, accounted
- Page 20 and 21: most influence investment in the re
- Page 22 and 23: Expanding to Higher-Skill-Intensive
- Page 24 and 25: Focusing on Unique Strategic Advant
- Page 26 and 27: U.S.A.CubaBahamasMap of the Caribbe
- Page 28: Table 1.1 Summary of CBERA preferen
- Page 33 and 34: 13under the same rules of origin ap
- Page 36 and 37: training, orientation visits, and b
- Page 38 and 39: domestic population growth pressure
- Page 40 and 41: Figure 2.2 GDP, most recent year, 2
- Page 42 and 43: Figure 2.3 GDP per capita, PPP, mos
- Page 44 and 45: Table 2.1 Selected CBERA countries:
- Page 46 and 47: Box 2.1 Mobile Telephone Industry i
- Page 48 and 49: Table 2.4 Goods and services trade
- Page 52 and 53: aTable 2.7 Leading U.S. merchandise
- Page 54 and 55: aTable 2.9 Leading U.S. merchandise
- Page 56 and 57: Extent of Utilization of CBERA Pref
- Page 58 and 59: Table 2.12 U.S. imports of apparel
- Page 60 and 61: important trend in the region is th
- Page 62 and 63: GDP in CBERA countries. When the tw
- Page 64 and 65: percent of GDP; this low figure con
- Page 66 and 67: firms from scrutiny, non-transparen
- Page 68 and 69: and Trinidad and Tobago (the only c
- Page 70 and 71: Table 2.17 World Bank IBRD and IDA
- Page 72 and 73: Table 2.19 Caribbean Development Ba
- Page 74 and 75: Table 2.20 Membership of covered CB
- Page 76 and 77: changes specifically in U.S. policy
- Page 78 and 79: Using country-level data, researche
- Page 80 and 81: Reinhardt. 24 The authors find that
- Page 82 and 83: CBTPA programs. Table 3.1 presents
- Page 84 and 85: exports fluctuated within a range o
- Page 86 and 87: promising for all countries covered
- Page 88 and 89: infrastructure, macroeconomic stabi
- Page 90 and 91: exporters have also been affected b
- Page 92 and 93: Policies identified in the literatu
- Page 94 and 95: outside of the domestic market.”
- Page 96 and 97: infrastructure, the 2005 World Bank
- Page 98 and 99: companies.” 99 The islands provid
- Page 100 and 101:
government, provide another opportu
- Page 102 and 103:
(CDS), was established in 1983 to p
- Page 104 and 105:
Policies identified in the literatu
- Page 106 and 107:
that, in the early 1990s, Caribbean
- Page 108 and 109:
policies discussed in earlier secti
- Page 110 and 111:
Caribbean government officials. 159
- Page 112 and 113:
These experiences suggest that supp
- Page 114 and 115:
which can generate more internation
- Page 116 and 117:
Dean, Judith M., and John Wainio.
- Page 118 and 119:
Josling, Tim. “Trade Policy in Sm
- Page 120 and 121:
———. Textiles and Apparel: Ef
- Page 123 and 124:
CHAPTER 4Current Level of Caribbean
- Page 125 and 126:
ANTIGUA & BARBUDAEconomic and Socia
- Page 127 and 128:
has been an employer of last resort
- Page 129 and 130:
International Integration 4Sources:
- Page 131:
improve its overall financial posit
- Page 134 and 135:
Aruba: Selected social development
- Page 136 and 137:
elated services, such as conference
- Page 138 and 139:
SourcesCaribbean-Central American A
- Page 140 and 141:
The Bahamas: Selected social develo
- Page 142 and 143:
In addition to its beaches that cou
- Page 144 and 145:
investment in the services sector,
- Page 146 and 147:
Barbados: Selected social developme
- Page 148 and 149:
The main agricultural products are
- Page 150 and 151:
$418 million. The main products imp
- Page 152 and 153:
Belize: Selected social development
- Page 154 and 155:
and is one of the fastest-growing i
- Page 156 and 157:
Belize: Selected international inte
- Page 159 and 160:
BRITISH VIRGIN ISLANDSEconomic and
- Page 161 and 162:
Domestic EconomyBritish Virgin Isla
- Page 163 and 164:
Data are unavailablefrom sourceData
- Page 165:
USITC. DataWeb (data compiled from
- Page 168 and 169:
Dominica: Selected social developme
- Page 170 and 171:
mainland or Europe, impede developm
- Page 172 and 173:
Dominica: Selected international in
- Page 175 and 176:
Economic and Social Development 1GR
- Page 177:
Grenada’s ongoing poverty eradica
- Page 180 and 181:
As Grenada’s economy has become i
- Page 183 and 184:
Economic and Social Development 1GU
- Page 185 and 186:
income average. The government has
- Page 187 and 188:
International Integration 3Sources:
- Page 189 and 190:
Box 4.1 Bauxite Industry in Guyana:
- Page 191 and 192:
Economic and Social Development 1HA
- Page 193 and 194:
poor nutrition and inadequate acces
- Page 195 and 196:
International Integration 3Sources:
- Page 197 and 198:
Box 4.2 Apparel Industry in Haiti:
- Page 199 and 200:
Economic and Social Development 1JA
- Page 201 and 202:
Hurricane Dean caused significant d
- Page 203 and 204:
Source: World Development Indicator
- Page 205 and 206:
Box 4.4 Film Production Outsourcing
- Page 207 and 208:
MONTSERRATEconomic and Social Devel
- Page 209 and 210:
constraint to the country’s futur
- Page 211 and 212:
International Integration 2Source:
- Page 213:
CIA. “The World Factbook: Montser
- Page 216 and 217:
Netherlands Antilles: Selected soci
- Page 218 and 219:
services industry is an important s
- Page 220 and 221:
Netherlands is a major source of FD
- Page 222 and 223:
Panama: Selected social development
- Page 224 and 225:
The services sector contributes mor
- Page 226 and 227:
Panama: Selected international inte
- Page 228 and 229:
SourcesCaribbean-Central American A
- Page 230 and 231:
St. Kitts & Nevis: Selected social
- Page 232 and 233:
government closed the state-run sug
- Page 234 and 235:
St. Kitts & Nevis: Selected interna
- Page 236 and 237:
U.S. Department of State. “Backgr
- Page 238 and 239:
St. Lucia: Selected social developm
- Page 240 and 241:
St. Lucia’s main service industri
- Page 242 and 243:
St. Lucia: Selected international i
- Page 244 and 245:
———. St. Lucia: 2005 Article
- Page 246 and 247:
Vincent & the Grenadines: Selected
- Page 248 and 249:
3the islands’ adherence to the
- Page 250 and 251:
Total goods and services trade was
- Page 253 and 254:
TRINIDAD & TOBAGOEconomic and Socia
- Page 255 and 256:
development” category. Since 1990
- Page 257 and 258:
International Integration 5Sources:
- Page 259 and 260:
Trinidad and Tobago has consistentl
- Page 261:
Ethanol Producer Magazine. “Ethan
- Page 264 and 265:
He said that, in mid-2005, St. Kitt
- Page 266 and 267:
projects are set to come online in
- Page 268 and 269:
Government of Jamaica 10In testimon
- Page 270 and 271:
mentioned that promoting health tou
- Page 272 and 273:
economies have become increasingly
- Page 274 and 275:
Caribbean-Central American Action (
- Page 276:
and that CBERA benefits are limited
- Page 279 and 280:
She added that “a failure to full
- Page 281:
APPENDIX ARequest Letter from Commi
- Page 284 and 285:
11/07/2UU'113: 45 P'Ua uu3The Honor
- Page 286 and 287:
I I / V I / L U U I 15;40 P M......
- Page 289 and 290:
71432 Federal Register / Vol. 72, N
- Page 291:
71434 Federal Register / Vol. 72, N
- Page 295 and 296:
CALENDAR OF PUBLIC HEARINGThose lis
- Page 297 and 298:
ORGANIZATION AND WITNESS:Halcrow, I
- Page 299:
APPENDIX DCountry Profiles Tables a
- Page 302 and 303:
Table D.1 Country Profiles Tables a
- Page 304 and 305:
Table D.1-ContinuedTable or figuren
- Page 306 and 307:
Table D.1-ContinuedTable or figuren
- Page 308 and 309:
Table D.1-ContinuedTable or figuren
- Page 310 and 311:
Table D.1-ContinuedTable or figuren
- Page 313:
APPENDIX EMerchandise Trade Tables
- Page 316 and 317:
Table E.2 Leading U.S. imports unde
- Page 319:
APPENDIX FDevelopment Tables
- Page 322 and 323:
Table F.2 Selected examples of rece
- Page 324:
Table F.2-ContinuedCountryPanama-Co