aTable 2.7 Leading U.S. merch<strong>and</strong>ise imports from covered CBERA countries, 2000–07HTSchapter Description 2000 2001 2002 2003 2004 2005 2006 2007(1,000 dollars)27 Mineral fuels, mineral oils <strong>and</strong> products <strong>of</strong> their distillation;bituminous substances; mineral waxes. . . . . . . . . . . . . . . 3,128,861 2,756,331 2,894,752 4,740,938 6,528,936 9,643,058 9,578,640 9,355,59428 Inorganic chemicals; organic or inorganic compounds <strong>of</strong>precious metals, <strong>of</strong> rare-earth metals, <strong>of</strong> radioactive elementsor <strong>of</strong> isotopes. .................................... 461,135 522,861 438,862 856,143 1,044,772 1,407,105 1,342,769 1,648,50529 Organic chemicals. ................................ 489,077 453,736 332,924 449,299 564,134 852,290 1,228,091 1,185,17861 Articles <strong>of</strong> apparel <strong>and</strong> clothing accessories, knitted orcrocheted. .................................... 464,695 371,736 307,575 365,374 384,104 426,052 459,695 444,83072 Iron <strong>and</strong> steel. .................................... 90,271 119,692 145,859 91,166 249,642 125,742 169,535 423,48822 Beverages, spirits <strong>and</strong> vinegar. . . . . . . . . . . . . . . . . . . . . . . . 76,445 80,905 88,137 107,800 111,000 163,460 292,307 361,28703 Fish <strong>and</strong> crustaceans, molluscs <strong>and</strong> other aquaticinvertebrates...................................... 307,644 305,793 283,495 320,248 287,984 276,497 285,856 264,45131 Fertilizers. ....................................... 35,793 51,959 48,850 73,603 84,732 126,346 93,893 175,13926 Ores, slag <strong>and</strong> ash................................. 69,950 112,656 87,982 90,206 85,708 116,292 104,828 148,76139 Plastics <strong>and</strong> articles there<strong>of</strong>. . . . . . . . . . . . . . . . . . . . . . . . . . 59,790 73,995 70,659 91,629 99,307 125,110 137,764 147,722Total <strong>of</strong> above..................................... 5,183,661 4,849,665 4,699,095 7,186,405 9,440,317 13,261,952 13,693,378 14,154,955All other.......................................... 1,180,770 895,946 915,966 998,177 1,064,611 1,246,574 1,272,101 1,168,503Gr<strong>and</strong> total. ...................................... 6,364,431 5,745,611 5,615,061 8,184,582 10,504,929 14,508,526 14,965,478 15,323,458Share <strong>of</strong> total (percent)27 Mineral fuels, mineral oils <strong>and</strong> products <strong>of</strong> their distillation;bituminous substances; mineral waxes. . . . . . . . . . . . . . . . . . 49.2 48.0 51.6 57.9 62.2 66.5 64.0 61.128 Inorganic chemicals; organic or inorganic compounds <strong>of</strong>precious metals, <strong>of</strong> rare-earth metals, <strong>of</strong> radioactive elementsor <strong>of</strong> isotopes. .................................... 7.2 9.1 7.8 10.5 9.9 9.7 9.0 10.829 Organic chemicals. ................................ 7.7 7.9 5.9 5.5 5.4 5.9 8.2 7.761 Articles <strong>of</strong> apparel <strong>and</strong> clothing accessories, knitted orcrocheted. .................................... 7.3 6.5 5.5 4.5 3.7 2.9 3.1 2.972 Iron <strong>and</strong> steel. .................................... 1.4 2.1 2.6 1.1 2.4 0.9 1.1 2.822 Beverages, spirits <strong>and</strong> vinegar. . . . . . . . . . . . . . . . . . . . . . . . 1.2 1.4 1.6 1.3 1.1 1.1 2.0 2.403 Fish <strong>and</strong> crustaceans, molluscs <strong>and</strong> other aquaticinvertebrates...................................... 4.8 5.3 5.0 3.9 2.7 1.9 1.9 1.731 Fertilizers. ....................................... 0.6 0.9 0.9 0.9 0.8 0.9 0.6 1.126 Ores, slag <strong>and</strong> ash................................. 1.1 2.0 1.6 1.1 0.8 0.8 0.7 1.039 Plastics <strong>and</strong> articles there<strong>of</strong>. . . . . . . . . . . . . . . . . . . . . . . . . . 0.9 1.3 1.3 1.1 0.9 0.9 0.9 1.0Total <strong>of</strong> above..................................... 81.4 84.4 83.7 87.8 89.9 91.4 91.5 92.4All other.......................................... 18.6 15.6 16.3 12.2 10.1 8.6 8.5 7.6Gr<strong>and</strong> total. ...................................... 100.0 100.0 100.0 100.0 100.0 100.0 100.0 100.0Source: Compiled from <strong>of</strong>ficial statistics <strong>of</strong> the U.S. Department <strong>of</strong> Commerce.aImports for consumption, c.i.f. value.
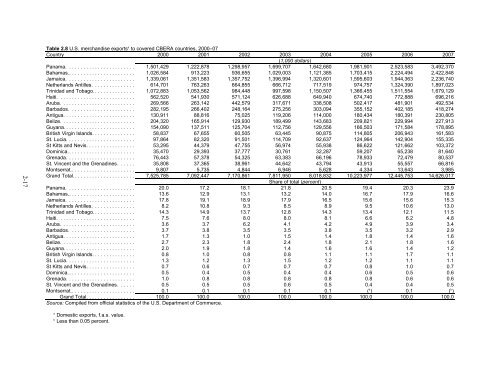
aTable 2.8 U.S. merch<strong>and</strong>ise exports to covered CBERA countries, 2000–07Country 2000 2001 2002 2003 2004 2005 2006 2007(1,000 dollars)Panama. ....................... 1,501,429 1,222,878 1,298,957 1,699,707 1,642,680 1,981,901 2,523,583 3,492,370Bahamas........................ 1,026,584 913,223 936,655 1,029,003 1,121,385 1,703,415 2,224,494 2,422,848Jamaica. ....................... 1,339,061 1,351,583 1,357,752 1,396,994 1,320,601 1,595,603 1,944,363 2,236,740Netherl<strong>and</strong>s Antilles. . . . . . . . . . . . . . . 614,701 763,263 664,855 666,712 717,519 974,757 1,324,390 1,897,023Trinidad <strong>and</strong> Tobago. . . . . . . . . . . . . . . 1,072,883 1,053,562 984,448 997,598 1,150,507 1,366,455 1,511,554 1,679,129Haiti. .......................... 562,520 541,930 571,124 626,688 649,940 674,740 772,888 696,216Aruba. ......................... 269,566 263,142 442,579 317,671 338,508 502,417 481,901 492,534Barbados. ...................... 282,195 266,402 248,164 275,256 303,094 355,152 402,185 418,274Antigua......................... 130,911 88,816 75,025 119,206 114,000 180,434 180,391 230,805Belize.......................... 204,320 165,914 129,930 189,499 143,683 209,821 229,994 227,913Guyana......................... 154,090 137,511 125,704 112,756 129,556 166,503 171,584 178,895British Virgin Isl<strong>and</strong>s. . . . . . . . . . . . . . . 58,837 67,655 60,505 63,445 90,875 114,805 206,943 161,583St. Lucia........................ 97,864 82,320 91,501 114,709 92,637 124,964 142,904 155,335St Kitts <strong>and</strong> Nevis................. 53,295 44,379 47,755 56,974 55,938 86,622 121,662 103,372Dominica........................ 35,470 29,393 37,777 30,761 32,287 59,207 65,238 81,640Grenada........................ 76,443 57,378 54,325 63,383 66,196 78,933 72,479 80,537St. Vincent <strong>and</strong> the Grenadines. . . . . . 35,808 37,365 38,961 44,642 43,794 43,913 55,557 66,816Montserrat....................... 9,807 5,735 4,844 6,946 5,628 4,334 13,643 3,985Gr<strong>and</strong> Total...................... 7,525,785 7,092,447 7,170,861 7,811,950 8,018,832 10,223,977 12,445,753 14,626,017Share <strong>of</strong> total (percent)Panama. ....................... 20.0 17.2 18.1 21.8 20.5 19.4 20.3 23.9Bahamas........................ 13.6 12.9 13.1 13.2 14.0 16.7 17.9 16.6Jamaica. ....................... 17.8 19.1 18.9 17.9 16.5 15.6 15.6 15.3Netherl<strong>and</strong>s Antilles. . . . . . . . . . . . . . . 8.2 10.8 9.3 8.5 8.9 9.5 10.6 13.0Trinidad <strong>and</strong> Tobago. . . . . . . . . . . . . . . 14.3 14.9 13.7 12.8 14.3 13.4 12.1 11.5Haiti. .......................... 7.5 7.6 8.0 8.0 8.1 6.6 6.2 4.8Aruba. ......................... 3.6 3.7 6.2 4.1 4.2 4.9 3.9 3.4Barbados. ...................... 3.7 3.8 3.5 3.5 3.8 3.5 3.2 2.9Antigua......................... 1.7 1.3 1.0 1.5 1.4 1.8 1.4 1.6Belize.......................... 2.7 2.3 1.8 2.4 1.8 2.1 1.8 1.6Guyana......................... 2.0 1.9 1.8 1.4 1.6 1.6 1.4 1.2British Virgin Isl<strong>and</strong>s. . . . . . . . . . . . . . . 0.8 1.0 0.8 0.8 1.1 1.1 1.7 1.1St. Lucia........................ 1.3 1.2 1.3 1.5 1.2 1.2 1.1 1.1St Kitts <strong>and</strong> Nevis................. 0.7 0.6 0.7 0.7 0.7 0.8 1.0 0.7Dominica........................ 0.5 0.4 0.5 0.4 0.4 0.6 0.5 0.6Grenada........................ 1.0 0.8 0.8 0.8 0.8 0.8 0.6 0.6St. Vincent <strong>and</strong> the Grenadines. . . . . . 0.5 0.5 0.5 0.6 0.5 0.4 0.4 0.5bbMontserrat....................... 0.1 0.1 0.1 0.1 0.1 ( ) 0.1 ( )Gr<strong>and</strong> Total................. 100.0 100.0 100.0 100.0 100.0 100.0 100.0 100.0Source: Compiled from <strong>of</strong>ficial statistics <strong>of</strong> the U.S. Department <strong>of</strong> Commerce.abDomestic exports, f.a.s. value.Less than 0.05 percent.
- Page 7 and 8: TABLE OF CONTENTSPagePreface ......
- Page 9 and 10: TABLE OF CONTENTS-ContinuedChapter
- Page 13 and 14: List of Frequently Used Abbreviatio
- Page 15: PPPPRGFSDRSMESPSTASCTEUTIEATIFATRQU
- Page 18 and 19: the Netherlands Antilles, accounted
- Page 20 and 21: most influence investment in the re
- Page 22 and 23: Expanding to Higher-Skill-Intensive
- Page 24 and 25: Focusing on Unique Strategic Advant
- Page 26 and 27: U.S.A.CubaBahamasMap of the Caribbe
- Page 28: Table 1.1 Summary of CBERA preferen
- Page 33 and 34: 13under the same rules of origin ap
- Page 36 and 37: training, orientation visits, and b
- Page 38 and 39: domestic population growth pressure
- Page 40 and 41: Figure 2.2 GDP, most recent year, 2
- Page 42 and 43: Figure 2.3 GDP per capita, PPP, mos
- Page 44 and 45: Table 2.1 Selected CBERA countries:
- Page 46 and 47: Box 2.1 Mobile Telephone Industry i
- Page 48 and 49: Table 2.4 Goods and services trade
- Page 50 and 51: Table 2.6 U.S. merchandise imports
- Page 54 and 55: aTable 2.9 Leading U.S. merchandise
- Page 56 and 57: Extent of Utilization of CBERA Pref
- Page 58 and 59: Table 2.12 U.S. imports of apparel
- Page 60 and 61: important trend in the region is th
- Page 62 and 63: GDP in CBERA countries. When the tw
- Page 64 and 65: percent of GDP; this low figure con
- Page 66 and 67: firms from scrutiny, non-transparen
- Page 68 and 69: and Trinidad and Tobago (the only c
- Page 70 and 71: Table 2.17 World Bank IBRD and IDA
- Page 72 and 73: Table 2.19 Caribbean Development Ba
- Page 74 and 75: Table 2.20 Membership of covered CB
- Page 76 and 77: changes specifically in U.S. policy
- Page 78 and 79: Using country-level data, researche
- Page 80 and 81: Reinhardt. 24 The authors find that
- Page 82 and 83: CBTPA programs. Table 3.1 presents
- Page 84 and 85: exports fluctuated within a range o
- Page 86 and 87: promising for all countries covered
- Page 88 and 89: infrastructure, macroeconomic stabi
- Page 90 and 91: exporters have also been affected b
- Page 92 and 93: Policies identified in the literatu
- Page 94 and 95: outside of the domestic market.”
- Page 96 and 97: infrastructure, the 2005 World Bank
- Page 98 and 99: companies.” 99 The islands provid
- Page 100 and 101: government, provide another opportu
- Page 102 and 103:
(CDS), was established in 1983 to p
- Page 104 and 105:
Policies identified in the literatu
- Page 106 and 107:
that, in the early 1990s, Caribbean
- Page 108 and 109:
policies discussed in earlier secti
- Page 110 and 111:
Caribbean government officials. 159
- Page 112 and 113:
These experiences suggest that supp
- Page 114 and 115:
which can generate more internation
- Page 116 and 117:
Dean, Judith M., and John Wainio.
- Page 118 and 119:
Josling, Tim. “Trade Policy in Sm
- Page 120 and 121:
———. Textiles and Apparel: Ef
- Page 123 and 124:
CHAPTER 4Current Level of Caribbean
- Page 125 and 126:
ANTIGUA & BARBUDAEconomic and Socia
- Page 127 and 128:
has been an employer of last resort
- Page 129 and 130:
International Integration 4Sources:
- Page 131:
improve its overall financial posit
- Page 134 and 135:
Aruba: Selected social development
- Page 136 and 137:
elated services, such as conference
- Page 138 and 139:
SourcesCaribbean-Central American A
- Page 140 and 141:
The Bahamas: Selected social develo
- Page 142 and 143:
In addition to its beaches that cou
- Page 144 and 145:
investment in the services sector,
- Page 146 and 147:
Barbados: Selected social developme
- Page 148 and 149:
The main agricultural products are
- Page 150 and 151:
$418 million. The main products imp
- Page 152 and 153:
Belize: Selected social development
- Page 154 and 155:
and is one of the fastest-growing i
- Page 156 and 157:
Belize: Selected international inte
- Page 159 and 160:
BRITISH VIRGIN ISLANDSEconomic and
- Page 161 and 162:
Domestic EconomyBritish Virgin Isla
- Page 163 and 164:
Data are unavailablefrom sourceData
- Page 165:
USITC. DataWeb (data compiled from
- Page 168 and 169:
Dominica: Selected social developme
- Page 170 and 171:
mainland or Europe, impede developm
- Page 172 and 173:
Dominica: Selected international in
- Page 175 and 176:
Economic and Social Development 1GR
- Page 177:
Grenada’s ongoing poverty eradica
- Page 180 and 181:
As Grenada’s economy has become i
- Page 183 and 184:
Economic and Social Development 1GU
- Page 185 and 186:
income average. The government has
- Page 187 and 188:
International Integration 3Sources:
- Page 189 and 190:
Box 4.1 Bauxite Industry in Guyana:
- Page 191 and 192:
Economic and Social Development 1HA
- Page 193 and 194:
poor nutrition and inadequate acces
- Page 195 and 196:
International Integration 3Sources:
- Page 197 and 198:
Box 4.2 Apparel Industry in Haiti:
- Page 199 and 200:
Economic and Social Development 1JA
- Page 201 and 202:
Hurricane Dean caused significant d
- Page 203 and 204:
Source: World Development Indicator
- Page 205 and 206:
Box 4.4 Film Production Outsourcing
- Page 207 and 208:
MONTSERRATEconomic and Social Devel
- Page 209 and 210:
constraint to the country’s futur
- Page 211 and 212:
International Integration 2Source:
- Page 213:
CIA. “The World Factbook: Montser
- Page 216 and 217:
Netherlands Antilles: Selected soci
- Page 218 and 219:
services industry is an important s
- Page 220 and 221:
Netherlands is a major source of FD
- Page 222 and 223:
Panama: Selected social development
- Page 224 and 225:
The services sector contributes mor
- Page 226 and 227:
Panama: Selected international inte
- Page 228 and 229:
SourcesCaribbean-Central American A
- Page 230 and 231:
St. Kitts & Nevis: Selected social
- Page 232 and 233:
government closed the state-run sug
- Page 234 and 235:
St. Kitts & Nevis: Selected interna
- Page 236 and 237:
U.S. Department of State. “Backgr
- Page 238 and 239:
St. Lucia: Selected social developm
- Page 240 and 241:
St. Lucia’s main service industri
- Page 242 and 243:
St. Lucia: Selected international i
- Page 244 and 245:
———. St. Lucia: 2005 Article
- Page 246 and 247:
Vincent & the Grenadines: Selected
- Page 248 and 249:
3the islands’ adherence to the
- Page 250 and 251:
Total goods and services trade was
- Page 253 and 254:
TRINIDAD & TOBAGOEconomic and Socia
- Page 255 and 256:
development” category. Since 1990
- Page 257 and 258:
International Integration 5Sources:
- Page 259 and 260:
Trinidad and Tobago has consistentl
- Page 261:
Ethanol Producer Magazine. “Ethan
- Page 264 and 265:
He said that, in mid-2005, St. Kitt
- Page 266 and 267:
projects are set to come online in
- Page 268 and 269:
Government of Jamaica 10In testimon
- Page 270 and 271:
mentioned that promoting health tou
- Page 272 and 273:
economies have become increasingly
- Page 274 and 275:
Caribbean-Central American Action (
- Page 276:
and that CBERA benefits are limited
- Page 279 and 280:
She added that “a failure to full
- Page 281:
APPENDIX ARequest Letter from Commi
- Page 284 and 285:
11/07/2UU'113: 45 P'Ua uu3The Honor
- Page 286 and 287:
I I / V I / L U U I 15;40 P M......
- Page 289 and 290:
71432 Federal Register / Vol. 72, N
- Page 291:
71434 Federal Register / Vol. 72, N
- Page 295 and 296:
CALENDAR OF PUBLIC HEARINGThose lis
- Page 297 and 298:
ORGANIZATION AND WITNESS:Halcrow, I
- Page 299:
APPENDIX DCountry Profiles Tables a
- Page 302 and 303:
Table D.1 Country Profiles Tables a
- Page 304 and 305:
Table D.1-ContinuedTable or figuren
- Page 306 and 307:
Table D.1-ContinuedTable or figuren
- Page 308 and 309:
Table D.1-ContinuedTable or figuren
- Page 310 and 311:
Table D.1-ContinuedTable or figuren
- Page 313:
APPENDIX EMerchandise Trade Tables
- Page 316 and 317:
Table E.2 Leading U.S. imports unde
- Page 319:
APPENDIX FDevelopment Tables
- Page 322 and 323:
Table F.2 Selected examples of rece
- Page 324:
Table F.2-ContinuedCountryPanama-Co