Report The Matrilineal Ancestry of Ashkenazi Jewry: Portrait of a ...
Report The Matrilineal Ancestry of Ashkenazi Jewry: Portrait of a ...
Report The Matrilineal Ancestry of Ashkenazi Jewry: Portrait of a ...

You also want an ePaper? Increase the reach of your titles
YUMPU automatically turns print PDFs into web optimized ePapers that Google loves.
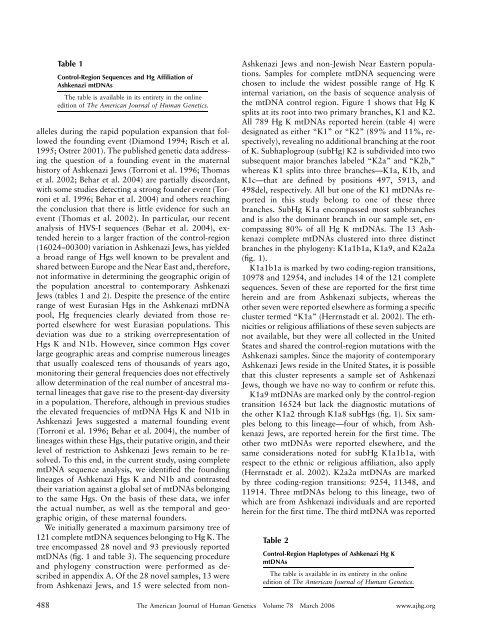
Table 1Control-Region Sequences and Hg Affiliation <strong>of</strong><strong>Ashkenazi</strong> mtDNAs<strong>The</strong> table is available in its entirety in the onlineedition <strong>of</strong> <strong>The</strong> American Journal <strong>of</strong> Human Genetics.alleles during the rapid population expansion that followedthe founding event (Diamond 1994; Risch et al.1995; Ostrer 2001). <strong>The</strong> published genetic data addressingthe question <strong>of</strong> a founding event in the maternalhistory <strong>of</strong> <strong>Ashkenazi</strong> Jews (Torroni et al. 1996; Thomaset al. 2002; Behar et al. 2004) are partially discordant,with some studies detecting a strong founder event (Torroniet al. 1996; Behar et al. 2004) and others reachingthe conclusion that there is little evidence for such anevent (Thomas et al. 2002). In particular, our recentanalysis <strong>of</strong> HVS-I sequences (Behar et al. 2004), extendedherein to a larger fraction <strong>of</strong> the control-region(16024–00300) variation in <strong>Ashkenazi</strong> Jews, has yieldeda broad range <strong>of</strong> Hgs well known to be prevalent andshared between Europe and the Near East and, therefore,not informative in determining the geographic origin <strong>of</strong>the population ancestral to contemporary <strong>Ashkenazi</strong>Jews (tables 1 and 2). Despite the presence <strong>of</strong> the entirerange <strong>of</strong> west Eurasian Hgs in the <strong>Ashkenazi</strong> mtDNApool, Hg frequencies clearly deviated from those reportedelsewhere for west Eurasian populations. Thisdeviation was due to a striking overrepresentation <strong>of</strong>Hgs K and N1b. However, since common Hgs coverlarge geographic areas and comprise numerous lineagesthat usually coalesced tens <strong>of</strong> thousands <strong>of</strong> years ago,monitoring their general frequencies does not effectivelyallow determination <strong>of</strong> the real number <strong>of</strong> ancestral maternallineages that gave rise to the present-day diversityin a population. <strong>The</strong>refore, although in previous studiesthe elevated frequencies <strong>of</strong> mtDNA Hgs K and N1b in<strong>Ashkenazi</strong> Jews suggested a maternal founding event(Torroni et al. 1996; Behar et al. 2004), the number <strong>of</strong>lineages within these Hgs, their putative origin, and theirlevel <strong>of</strong> restriction to <strong>Ashkenazi</strong> Jews remain to be resolved.To this end, in the current study, using completemtDNA sequence analysis, we identified the foundinglineages <strong>of</strong> <strong>Ashkenazi</strong> Hgs K and N1b and contrastedtheir variation against a global set <strong>of</strong> mtDNAs belongingto the same Hgs. On the basis <strong>of</strong> these data, we inferthe actual number, as well as the temporal and geographicorigin, <strong>of</strong> these maternal founders.We initially generated a maximum parsimony tree <strong>of</strong>121 complete mtDNA sequences belonging to Hg K. <strong>The</strong>tree encompassed 28 novel and 93 previously reportedmtDNAs (fig. 1 and table 3). <strong>The</strong> sequencing procedureand phylogeny construction were performed as describedin appendix A. Of the 28 novel samples, 13 werefrom <strong>Ashkenazi</strong> Jews, and 15 were selected from non-<strong>Ashkenazi</strong> Jews and non-Jewish Near Eastern populations.Samples for complete mtDNA sequencing werechosen to include the widest possible range <strong>of</strong> Hg Kinternal variation, on the basis <strong>of</strong> sequence analysis <strong>of</strong>the mtDNA control region. Figure 1 shows that Hg Ksplits at its root into two primary branches, K1 and K2.All 789 Hg K mtDNAs reported herein (table 4) weredesignated as either “K1” or “K2” (89% and 11%, respectively),revealing no additional branching at the root<strong>of</strong> K. Subhaplogroup (subHg) K2 is subdivided into twosubsequent major branches labeled “K2a” and “K2b,”whereas K1 splits into three branches—K1a, K1b, andK1c—that are defined by positions 497, 5913, and498del, respectively. All but one <strong>of</strong> the K1 mtDNAs reportedin this study belong to one <strong>of</strong> these threebranches. SubHg K1a encompassed most subbranchesand is also the dominant branch in our sample set, encompassing80% <strong>of</strong> all Hg K mtDNAs. <strong>The</strong> 13 <strong>Ashkenazi</strong>complete mtDNAs clustered into three distinctbranches in the phylogeny: K1a1b1a, K1a9, and K2a2a(fig. 1).K1a1b1a is marked by two coding-region transitions,10978 and 12954, and includes 14 <strong>of</strong> the 121 completesequences. Seven <strong>of</strong> these are reported for the first timeherein and are from <strong>Ashkenazi</strong> subjects, whereas theother seven were reported elsewhere as forming a specificcluster termed “K1a” (Herrnstadt et al. 2002). <strong>The</strong> ethnicitiesor religious affiliations <strong>of</strong> these seven subjects arenot available, but they were all collected in the UnitedStates and shared the control-region mutations with the<strong>Ashkenazi</strong> samples. Since the majority <strong>of</strong> contemporary<strong>Ashkenazi</strong> Jews reside in the United States, it is possiblethat this cluster represents a sample set <strong>of</strong> <strong>Ashkenazi</strong>Jews, though we have no way to confirm or refute this.K1a9 mtDNAs are marked only by the control-regiontransition 16524 but lack the diagnostic mutations <strong>of</strong>the other K1a2 through K1a8 subHgs (fig. 1). Six samplesbelong to this lineage—four <strong>of</strong> which, from <strong>Ashkenazi</strong>Jews, are reported herein for the first time. <strong>The</strong>other two mtDNAs were reported elsewhere, and thesame considerations noted for subHg K1a1b1a, withrespect to the ethnic or religious affiliation, also apply(Herrnstadt et al. 2002). K2a2a mtDNAs are markedby three coding-region transitions: 9254, 11348, and11914. Three mtDNAs belong to this lineage, two <strong>of</strong>which are from <strong>Ashkenazi</strong> individuals and are reportedherein for the first time. <strong>The</strong> third mtDNA was reportedTable 2Control-Region Haplotypes <strong>of</strong> <strong>Ashkenazi</strong> Hg KmtDNAs<strong>The</strong> table is available in its entirety in the onlineedition <strong>of</strong> <strong>The</strong> American Journal <strong>of</strong> Human Genetics.488 <strong>The</strong> American Journal <strong>of</strong> Human Genetics Volume 78 March 2006 www.ajhg.org