Report The Matrilineal Ancestry of Ashkenazi Jewry: Portrait of a ...
Report The Matrilineal Ancestry of Ashkenazi Jewry: Portrait of a ...
Report The Matrilineal Ancestry of Ashkenazi Jewry: Portrait of a ...

Create successful ePaper yourself
Turn your PDF publications into a flip-book with our unique Google optimized e-Paper software.
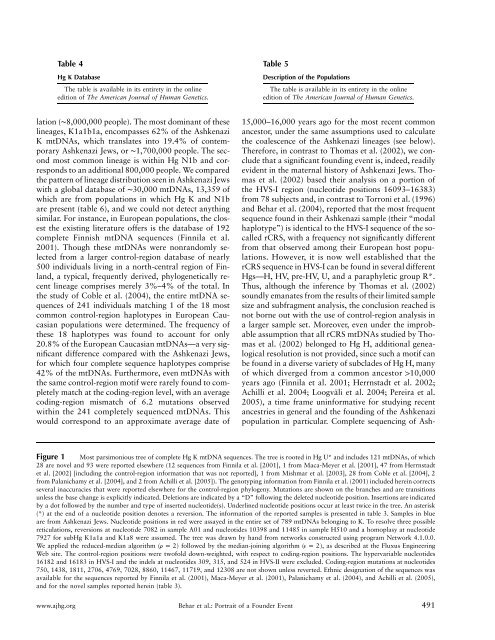
Table 4Hg K Database<strong>The</strong> table is available in its entirety in the onlineedition <strong>of</strong> <strong>The</strong> American Journal <strong>of</strong> Human Genetics.Table 5Description <strong>of</strong> the Populations<strong>The</strong> table is available in its entirety in the onlineedition <strong>of</strong> <strong>The</strong> American Journal <strong>of</strong> Human Genetics.lation (∼8,000,000 people). <strong>The</strong> most dominant <strong>of</strong> theselineages, K1a1b1a, encompasses 62% <strong>of</strong> the <strong>Ashkenazi</strong>K mtDNAs, which translates into 19.4% <strong>of</strong> contemporary<strong>Ashkenazi</strong> Jews, or ∼1,700,000 people. <strong>The</strong> secondmost common lineage is within Hg N1b and correspondsto an additional 800,000 people. We comparedthe pattern <strong>of</strong> lineage distribution seen in <strong>Ashkenazi</strong> Jewswith a global database <strong>of</strong> ∼30,000 mtDNAs, 13,359 <strong>of</strong>which are from populations in which Hg K and N1bare present (table 6), and we could not detect anythingsimilar. For instance, in European populations, the closestthe existing literature <strong>of</strong>fers is the database <strong>of</strong> 192complete Finnish mtDNA sequences (Finnila et al.2001). Though these mtDNAs were nonrandomly selectedfrom a larger control-region database <strong>of</strong> nearly500 individuals living in a north-central region <strong>of</strong> Finland,a typical, frequently derived, phylogenetically recentlineage comprises merely 3%–4% <strong>of</strong> the total. Inthe study <strong>of</strong> Coble et al. (2004), the entire mtDNA sequences<strong>of</strong> 241 individuals matching 1 <strong>of</strong> the 18 mostcommon control-region haplotypes in European Caucasianpopulations were determined. <strong>The</strong> frequency <strong>of</strong>these 18 haplotypes was found to account for only20.8% <strong>of</strong> the European Caucasian mtDNAs—a very significantdifference compared with the <strong>Ashkenazi</strong> Jews,for which four complete sequence haplotypes comprise42% <strong>of</strong> the mtDNAs. Furthermore, even mtDNAs withthe same control-region motif were rarely found to completelymatch at the coding-region level, with an averagecoding-region mismatch <strong>of</strong> 6.2 mutations observedwithin the 241 completely sequenced mtDNAs. Thiswould correspond to an approximate average date <strong>of</strong>15,000–16,000 years ago for the most recent commonancestor, under the same assumptions used to calculatethe coalescence <strong>of</strong> the <strong>Ashkenazi</strong> lineages (see below).<strong>The</strong>refore, in contrast to Thomas et al. (2002), we concludethat a significant founding event is, indeed, readilyevident in the maternal history <strong>of</strong> <strong>Ashkenazi</strong> Jews. Thomaset al. (2002) based their analysis on a portion <strong>of</strong>the HVS-I region (nucleotide positions 16093–16383)from 78 subjects and, in contrast to Torroni et al. (1996)and Behar et al. (2004), reported that the most frequentsequence found in their <strong>Ashkenazi</strong> sample (their “modalhaplotype”) is identical to the HVS-I sequence <strong>of</strong> the socalledrCRS, with a frequency not significantly differentfrom that observed among their European host populations.However, it is now well established that therCRS sequence in HVS-I can be found in several differentHgs—H, HV, pre-HV, U, and a paraphyletic group R*.Thus, although the inference by Thomas et al. (2002)soundly emanates from the results <strong>of</strong> their limited samplesize and subfragment analysis, the conclusion reached isnot borne out with the use <strong>of</strong> control-region analysis ina larger sample set. Moreover, even under the improbableassumption that all rCRS mtDNAs studied by Thomaset al. (2002) belonged to Hg H, additional genealogicalresolution is not provided, since such a motif canbe found in a diverse variety <strong>of</strong> subclades <strong>of</strong> Hg H, many<strong>of</strong> which diverged from a common ancestor 110,000years ago (Finnila et al. 2001; Herrnstadt et al. 2002;Achilli et al. 2004; Loogväli et al. 2004; Pereira et al.2005), a time frame uninformative for studying recentancestries in general and the founding <strong>of</strong> the <strong>Ashkenazi</strong>population in particular. Complete sequencing <strong>of</strong> Ash-Figure 1 Most parsimonious tree <strong>of</strong> complete Hg K mtDNA sequences. <strong>The</strong> tree is rooted in Hg U* and includes 121 mtDNAs, <strong>of</strong> which28 are novel and 93 were reported elsewhere (12 sequences from Finnila et al. [2001], 1 from Maca-Meyer et al. [2001], 47 from Herrnstadtet al. [2002] [including the control-region information that was not reported], 1 from Mishmar et al. [2003], 28 from Coble et al. [2004], 2from Palanichamy et al. [2004], and 2 from Achilli et al. [2005]). <strong>The</strong> genotyping information from Finnila et al. (2001) included herein correctsseveral inaccuracies that were reported elsewhere for the control-region phylogeny. Mutations are shown on the branches and are transitionsunless the base change is explicitly indicated. Deletions are indicated by a “D” following the deleted nucleotide position. Insertions are indicatedby a dot followed by the number and type <strong>of</strong> inserted nucleotide(s). Underlined nucleotide positions occur at least twice in the tree. An asterisk(*) at the end <strong>of</strong> a nucleotide position denotes a reversion. <strong>The</strong> information <strong>of</strong> the reported samples is presented in table 3. Samples in blueare from <strong>Ashkenazi</strong> Jews. Nucleotide positions in red were assayed in the entire set <strong>of</strong> 789 mtDNAs belonging to K. To resolve three possiblereticulations, reversions at nucleotide 7082 in sample A01 and nucleotides 10398 and 11485 in sample H510 and a homoplasy at nucleotide7927 for subHg K1a1a and K1a8 were assumed. <strong>The</strong> tree was drawn by hand from networks constructed using program Network 4.1.0.0.We applied the reduced-median algorithm ( r p 2) followed by the median-joining algorithm ( e p 2), as described at the Fluxus EngineeringWeb site. <strong>The</strong> control-region positions were tw<strong>of</strong>old down-weighted, with respect to coding-region positions. <strong>The</strong> hypervariable nucleotides16182 and 16183 in HVS-I and the indels at nucleotides 309, 315, and 524 in HVS-II were excluded. Coding-region mutations at nucleotides750, 1438, 1811, 2706, 4769, 7028, 8860, 11467, 11719, and 12308 are not shown unless reverted. Ethnic designation <strong>of</strong> the sequences wasavailable for the sequences reported by Finnila et al. (2001), Maca-Meyer et al. (2001), Palanichamy et al. (2004), and Achilli et al. (2005),and for the novel samples reported herein (table 3).www.ajhg.org Behar et al.: <strong>Portrait</strong> <strong>of</strong> a Founder Event 491