

Latitudinal and temporal variability in the community structure and ...
Latitudinal and temporal variability in the community structure and ...
Latitudinal and temporal variability in the community structure and ...

Create successful ePaper yourself
Turn your PDF publications into a flip-book with our unique Google optimized e-Paper software.
Progress <strong>in</strong> Oceanography 110 (2013) 80–92Contents lists available at SciVerse ScienceDirectProgress <strong>in</strong> Oceanographyjournal homepage: www.elsevier.com/locate/pocean<strong>Latitud<strong>in</strong>al</strong> <strong>and</strong> <strong>temporal</strong> <strong>variability</strong> <strong>in</strong> <strong>the</strong> <strong>community</strong> <strong>structure</strong> <strong>and</strong> fatty acidcomposition of deep-sea nematodes <strong>in</strong> <strong>the</strong> Sou<strong>the</strong>rn OceanKatja Guil<strong>in</strong>i a,⇑ , Gritta Veit-Köhler b , Marleen De Troch a , Dirk Van Gansbeke a , Ann Vanreusel aa Biology Department, Mar<strong>in</strong>e Biology Section, Ghent University, Krijgslaan 281/Sterre S8, 9000 Gent, Belgiumb Senckenberg am Meer, DZMB – German Centre for Mar<strong>in</strong>e Biodiversity Research, Südstr<strong>and</strong> 44, 26382 Wilhelmshaven, Germanyarticle<strong>in</strong>foabstractArticle history:Available onl<strong>in</strong>e 11 January 2013This study describes <strong>and</strong> comb<strong>in</strong>es structural <strong>and</strong> functional aspects of deep-sea nematode assemblagesfrom <strong>the</strong> Atlantic sector of <strong>the</strong> Sou<strong>the</strong>rn Ocean. Samples were collected at six stations along <strong>the</strong> PrimeMeridian (49–70°S), <strong>in</strong>clud<strong>in</strong>g a repeated sampl<strong>in</strong>g after one <strong>and</strong> a half months <strong>in</strong>terval at <strong>the</strong> Polar Front(52°S), where meanwhile a seasonal phytoplankton bloom had settled. The aim was to ga<strong>in</strong> <strong>in</strong>sight <strong>in</strong> <strong>the</strong>latitud<strong>in</strong>al <strong>and</strong> <strong>temporal</strong> <strong>variability</strong> <strong>in</strong> nematode <strong>community</strong> <strong>structure</strong> <strong>and</strong> diet based on <strong>the</strong> genericcomposition <strong>and</strong> bulk fatty acid composition of <strong>the</strong> <strong>community</strong>, respectively. The results show that nematodeassemblages along <strong>the</strong> transect differed relatively little <strong>and</strong> that <strong>the</strong>y were all highly comparable toslope <strong>and</strong> abyssal communities elsewhere <strong>in</strong> <strong>the</strong> world <strong>in</strong> terms of nematode st<strong>and</strong><strong>in</strong>g stock, diversity<strong>and</strong> composition. Nematode <strong>community</strong> composition was only weakly correlated with <strong>the</strong> <strong>community</strong>fatty acid composition, <strong>in</strong>dicat<strong>in</strong>g that simply <strong>the</strong> occurrence of dist<strong>in</strong>ct genera or <strong>the</strong> proportion of nematodefeed<strong>in</strong>g types based on mouth morphology, cannot expla<strong>in</strong> <strong>the</strong> variance <strong>in</strong> FA compositions of <strong>the</strong>communities. Moreover, <strong>the</strong> generally low FA content of nematodes suggests that <strong>the</strong>y do not accumulatelipids for energy storage <strong>and</strong> that <strong>the</strong>y may feed throughout <strong>the</strong> year on constantly available food sources.A year-round forag<strong>in</strong>g activity could also expla<strong>in</strong> <strong>the</strong> recorded lack of food uptake as a short-termresponse to <strong>the</strong> recently settled phytodetritus at <strong>the</strong> revisited Polar Front station. Never<strong>the</strong>less, <strong>the</strong> higherrelative abundance of nematodes <strong>in</strong> <strong>the</strong> top centimeter layer of <strong>the</strong> sediment <strong>and</strong> <strong>the</strong> occurrence of <strong>the</strong>genus Leptolaimus only after phytodetritus had settled at <strong>the</strong> seafloor, suggests <strong>the</strong> record<strong>in</strong>g of an earlystage <strong>in</strong> a delayed response to <strong>the</strong> seasonal event.Ó 2013 Elsevier Ltd. All rights reserved.1. IntroductionSimilar to o<strong>the</strong>r ocean bas<strong>in</strong>s, <strong>the</strong> benthos <strong>in</strong> <strong>the</strong> Sou<strong>the</strong>rnOcean (SO) deep sea (i.e. >1000 m of water depth) is poorly known<strong>in</strong> comparison with <strong>the</strong> cont<strong>in</strong>ental shelf (Clarke <strong>and</strong> Johnston,2003; Clarke, 2008). Moreover, although metazoan meiofauna representan ubiquitous group of organisms, numerically dom<strong>in</strong>antcompared to o<strong>the</strong>r metazoans at all water depths (Rex et al.,2006; Wei et al., 2010), diversity <strong>and</strong> ecosystem roles played bymega- <strong>and</strong> macrofauna are far better documented. Ecological studieson SO metazoan meiofauna so far have shown that <strong>the</strong> communitiesfollow a general pattern of decrease <strong>in</strong> abundance with<strong>in</strong>creas<strong>in</strong>g water depth <strong>and</strong> generally decreas<strong>in</strong>g food availabilityalong <strong>the</strong> cont<strong>in</strong>ental shelf <strong>and</strong> slope (Herman <strong>and</strong> Dahms, 1992;Vanhove et al., 1995; Gutzmann et al., 2004). This corresponds toa pattern found for metazoan meiobenthos <strong>in</strong> <strong>the</strong> deep sea worldwide(Mokievskii et al., 2007). As documented by a large number ofstudies (reviewed by Heip et al. (1985) <strong>and</strong> Giere (2009)), sedimentproperties <strong>and</strong> food availability were both of prime importance <strong>in</strong>⇑ Correspond<strong>in</strong>g author. Tel.: +32 9 264 85 31; fax: +32 9 264 85 98.E-mail address: Katja.Guil<strong>in</strong>i@UGent.be (K. Guil<strong>in</strong>i).expla<strong>in</strong><strong>in</strong>g <strong>the</strong> composition of <strong>the</strong> Antarctic deep-sea meiofauna,particularly nematode communities (Herman <strong>and</strong> Dahms, 1992;Vanhove et al., 1995, 2004). Apart from water depth, o<strong>the</strong>r multiple,<strong>in</strong>terdependent factors such as hydrography, topography, icecoverage, light, temperature, nutrient availability <strong>and</strong> <strong>the</strong> <strong>structure</strong>of <strong>the</strong> pelagic food web <strong>in</strong>fluence <strong>the</strong> food supply that reaches <strong>the</strong>seafloor (Grebmeier <strong>and</strong> Barry, 1991; Bathmann et al., 1997; Clarke<strong>and</strong> Arntz, 2006; Arrigo et al., 2008). Because of <strong>the</strong> occurrence of<strong>the</strong> Polar Front, seamounts, <strong>and</strong> a seasonally retreat<strong>in</strong>g ice zone,<strong>the</strong> SO is characterized by latitud<strong>in</strong>al <strong>and</strong> seasonal variations <strong>in</strong> organiccarbon fluxes reach<strong>in</strong>g <strong>the</strong> seafloor (Sachs et al., 2009), whichmay result <strong>in</strong> spatial <strong>and</strong> <strong>temporal</strong> <strong>variability</strong> <strong>in</strong> benthic st<strong>and</strong><strong>in</strong>gstocks.Mount<strong>in</strong>g evidence on <strong>the</strong> presence of seasonal detritus depositions<strong>in</strong> <strong>the</strong> deep sea came along with contrast<strong>in</strong>g f<strong>in</strong>d<strong>in</strong>gs on benthicresponses to <strong>the</strong> deposition of phytodetritus (e.g. Billett et al.,1983; Graf, 1992; Gooday et al., 1996; Soetaert et al., 1996; Drazenet al., 1998). Although deep-sea meiofaunal st<strong>and</strong><strong>in</strong>g stock is generallyproportional to food availability (i.e. sediment organic carboncontent <strong>and</strong> chloroplastic pigment equivalents (CPE); e.g.Vanreusel et al., 1995; Soetaert et al., 2009), <strong>the</strong> response <strong>in</strong> termsof food uptake or <strong>community</strong> shifts of nematodes to both natural0079-6611/$ - see front matter Ó 2013 Elsevier Ltd. All rights reserved.http://dx.doi.org/10.1016/j.pocean.2013.01.002
K. Guil<strong>in</strong>i et al. / Progress <strong>in</strong> Oceanography 110 (2013) 80–92 81<strong>and</strong> experimentally simulated depositions of phytodetritus is onlym<strong>in</strong>imal or absent compared to bacteria, foram<strong>in</strong>iferans <strong>and</strong> severalmacrofaunal taxa (e.g. Gooday, 1988; Graf, 1992; Pfannkuche,1993; Soltwedel, 1997; Galéron et al., 2001; Guil<strong>in</strong>i et al., 2010 <strong>and</strong>references <strong>the</strong>re<strong>in</strong>). The only rapid responses found to an episodicfood supply <strong>in</strong> <strong>the</strong> deep sea were an <strong>in</strong>crease <strong>in</strong> mean nematodesize at <strong>the</strong> German BIOTRANS site (April–July; Soltwedel et al.,1996) <strong>and</strong> nematode migration towards <strong>the</strong> sediment surface <strong>in</strong><strong>the</strong> Polar Front (December–January; Veit-Köhler et al., 2011). Doubledmeiofaunal abundance (ma<strong>in</strong>ly nematodes), from summer toautumn <strong>in</strong> sediments from <strong>the</strong> bathyal Mediterranean (de Bovéeet al., 1990) <strong>and</strong> <strong>the</strong> Nor<strong>the</strong>ast Atlantic along <strong>the</strong> Hebridean marg<strong>in</strong>(Mitchell et al., 1997) <strong>in</strong>dicate, however, a response on a longertime scale. Therefore, it is speculated that deep-sea nematodesare feed<strong>in</strong>g additionally or alternatively on ra<strong>the</strong>r unlimited, o<strong>the</strong>rfood sources than phytodetritus (e.g. bacteria, ciliates, flagellates,foram<strong>in</strong>iferans, fungi, DOC) <strong>and</strong> that <strong>the</strong>y may be characterizedby generally slower rates of colonization, respiration <strong>and</strong> somaticgrowth (Guil<strong>in</strong>i et al., 2010, 2011). Rigid evidence that any of <strong>the</strong>sefood sources are of substantial importance to ma<strong>in</strong>ta<strong>in</strong> <strong>the</strong> metabolicdem<strong>and</strong>s of nematodes, or respiration measurements under<strong>in</strong> situ conditions are, however, lack<strong>in</strong>g.This study describes <strong>and</strong> comb<strong>in</strong>es both structural <strong>and</strong> functionalaspects of deep-sea nematode assemblages along a latitud<strong>in</strong>altransect follow<strong>in</strong>g <strong>the</strong> Prime Meridian across <strong>the</strong> SO (49–70°S).Besides a spatial scale, a <strong>temporal</strong> scale was considered with regardsto <strong>the</strong> short-term response of nematode assemblages to aseasonal deposition of particulate organic matter (POM). Therefore,a station located <strong>in</strong> <strong>the</strong> Polar Front (52°2 0 S, 0°1 0 W), where a phytoplanktonbloom had settled dur<strong>in</strong>g <strong>the</strong> course of <strong>the</strong> expedition,was revisited after 52 days to perform repeated measurements.Overall, structural aspects comprise st<strong>and</strong><strong>in</strong>g stocks <strong>and</strong> <strong>community</strong>composition, while functional aspects refer to feed<strong>in</strong>g ecology,which is <strong>in</strong>vestigated by means of fatty acid (FA) compositions.Nematode FA compositions are determ<strong>in</strong>ed to provide a time-<strong>in</strong>tegratedview on <strong>the</strong> organisms’ diets at <strong>the</strong> <strong>community</strong> level. The FAmarker concept relies on <strong>the</strong> fact that certa<strong>in</strong> FA are <strong>in</strong>corporated<strong>in</strong>to consumers <strong>in</strong> a conservative manner (e.g. Dalsgaard et al.,2003; Lee et al., 2006). By compar<strong>in</strong>g nematode FA with what isknown from literature on surface water POM, o<strong>the</strong>r benthic organisms,bulk sediment <strong>and</strong> bottom-water POM properties, we aim toprovide <strong>in</strong>sights as to <strong>the</strong> resources used by deep-sea nematodecommunities across <strong>the</strong> Sou<strong>the</strong>rn Ocean. Although this techniqueis widely spread <strong>in</strong> mar<strong>in</strong>e ecological studies (see review by Kelly<strong>and</strong> Scheibl<strong>in</strong>g (2012)), it was only applied three times on mar<strong>in</strong>efree-liv<strong>in</strong>g nematodes (Leduc, 2009; Leduc <strong>and</strong> Probert, 2009; VanGaever et al., 2009).The follow<strong>in</strong>g hypo<strong>the</strong>ses were tested:(1) Structural <strong>and</strong> functional characteristics of deep-sea nematodeassemblages do not differ along a latitud<strong>in</strong>al gradientacross <strong>the</strong> SO.(2) Deep-sea nematodes at <strong>the</strong> Polar Front do not respond to aseasonal pulse of organic matter to <strong>the</strong> seafloor.2. Materials <strong>and</strong> methods2.1. Study site <strong>and</strong> sampl<strong>in</strong>g procedureSamples were collected dur<strong>in</strong>g <strong>the</strong> ANDEEP-SYSTCO expeditionon board of <strong>the</strong> RV Polarstern (ANT XXIV/2, 28.11.2007–04.02.2008). Sediment samples were taken at depths from1935 to 5323 m, at six sites along a north–south gradient, <strong>in</strong>close proximity of <strong>the</strong> Prime Meridian between 49°S <strong>and</strong> 70°S;across <strong>the</strong> Polar Front, <strong>the</strong> Weddell Sea <strong>and</strong> <strong>the</strong> Lazarev Sea(Fig. 1, Table 1). The stations are fur<strong>the</strong>r <strong>in</strong>dicated with <strong>the</strong>irabbreviations (PF: Polar Front, sPF: south Polar Front, cWS: centralWeddell Sea, MR: Maud Rise, LS: Lazarev Sea). All stationsoccur <strong>in</strong> different water masses <strong>and</strong> environments with differenttopographical, sedimentary <strong>and</strong> productivity conditions. The PF,sPF <strong>and</strong> cWS station are situated on <strong>the</strong> abyssal sea floor, MRis a seamount <strong>and</strong> LS is located at <strong>the</strong> cont<strong>in</strong>ental slope. The stationlocated at a sou<strong>the</strong>rn position <strong>in</strong> <strong>the</strong> Polar Front (sPF, at52°S) was visited twice; once when a phytoplankton bloomwas detected <strong>in</strong> <strong>the</strong> euphotic water layer based on <strong>in</strong>creasedfluorescence levels (06.12.2007; Herrmann <strong>and</strong> Bathmann,2010) <strong>and</strong> 52 days later when <strong>the</strong> rema<strong>in</strong>s of <strong>the</strong> bloom had settledto <strong>the</strong> sea floor (26–27.01.2008). These rema<strong>in</strong>s were visibleas a greenish fluff layer on <strong>the</strong> sediment surface (Veit-Köhleret al., 2011). Sachs et al. (2009) calculated <strong>the</strong> labile portion of<strong>the</strong> organic carbon flux (LC org ) based on <strong>in</strong> situ <strong>and</strong> ex situ measurementsof O 2 profiles <strong>in</strong> surface sediments (Table 1).All meiobenthic samples were taken with a multiple corer(MUC) sampl<strong>in</strong>g device equipped with 12 plexiglass cores (<strong>in</strong>nerdiameter: 9.4 cm, equivalent to 69.4 cm 2 ). The MUC was deployedone to three times per station, depend<strong>in</strong>g on ship time availability<strong>and</strong> sea state. The processed samples were thus a comb<strong>in</strong>ation oftrue replicates <strong>and</strong> pseudo-replicates, s<strong>in</strong>ce different cores from<strong>the</strong> same MUC deployment do not meet <strong>the</strong> criteria of r<strong>and</strong>omsampl<strong>in</strong>g (Hurlbert, 1984). An overview of <strong>the</strong> processed samplesis given <strong>in</strong> Table 1. The s<strong>in</strong>gle MUC deployment at <strong>the</strong> Polar Frontstation was only partially successful. It was visually determ<strong>in</strong>edthat some cores were disturbed. The most undisturbed cores werereserved for FA analysis, <strong>in</strong> order to ensure enough organismscould be collected. From all stations, <strong>the</strong> sediment cores dest<strong>in</strong>edfor meiofauna <strong>community</strong> analysis were sliced <strong>in</strong>to 1-cm fractionsdown to 5 cm <strong>and</strong> toge<strong>the</strong>r with <strong>the</strong> supernatant water preserved<strong>in</strong> a borax-buffered 4% formaldehyde-seawater solution. Fur<strong>the</strong>rmore,a m<strong>in</strong>imum of four cores per deployment were used to scoopoff <strong>the</strong> upper 5 cm of sediment. This material was immediatelysieved <strong>in</strong> <strong>the</strong> lab with filtered seawater (32 lm mesh) over stackedsieves (1 mm, 500 lm, 100 lm <strong>and</strong> 32 lm) to prevent clogg<strong>in</strong>g.The reta<strong>in</strong>ed 500 lm, 100 lm <strong>and</strong> 32 lm fractions were pooled<strong>and</strong> stored at 80 °C. Back at <strong>the</strong> laboratory, <strong>the</strong> nematodes wereextracted for fatty acid analyses.2.2. Nematode parametersSediment samples dest<strong>in</strong>ed for identify<strong>in</strong>g <strong>the</strong> nematode <strong>community</strong>were r<strong>in</strong>sed with tap water over a 32 lm mesh sieve (noupper sieve size used). The fraction reta<strong>in</strong>ed on <strong>the</strong> 32 lm sievewas three times centrifugated with <strong>the</strong> colloidal silica polymerLevasil Ò (H.C. Stark, 200/40%, q = 1.17, for 6 m<strong>in</strong> at 4000 rpm)<strong>and</strong> kaol<strong>in</strong> (McIntyre <strong>and</strong> Warwick, 1984) to extract all organisms.After sta<strong>in</strong><strong>in</strong>g with Rose Bengal, all metazoan organisms weremanually sorted to higher taxon level (follow<strong>in</strong>g Higg<strong>in</strong>s <strong>and</strong> Thiel,1988) <strong>and</strong> counted under a Leica MZ 12.5 stereomicroscope (8–100 magnification). Where possible, about 50–100 nematodeswere picked out r<strong>and</strong>omly with a f<strong>in</strong>e needle from each centimetersediment layer. They were gradually transferred to glycer<strong>in</strong>e (Se<strong>in</strong>horst,1959) before be<strong>in</strong>g mounted on glass slides. Nematodeswere identified to genus level under a compound microscope(1000 magnification). Adults were dist<strong>in</strong>guished from juvenilesbased on <strong>the</strong> development of a vulva <strong>and</strong> uterus <strong>in</strong> females <strong>and</strong> agonad <strong>and</strong> spicules <strong>in</strong> males. Based on mouth morphology, all identified<strong>in</strong>dividuals were classified <strong>in</strong>to four feed<strong>in</strong>g type groupsaccord<strong>in</strong>g to Wieser (1953): selective deposit feeders (1A), nonselectivedeposit feeders (1B), epistratum feeders (2A), <strong>and</strong> predators/scavengers(2B). By us<strong>in</strong>g a Leica DMR compound microscope<strong>and</strong> Leica LAS 3.3 imag<strong>in</strong>g software, nematode length (L, filiformtail excluded) <strong>and</strong> maximal width (W) were measured. Nematode
82 K. Guil<strong>in</strong>i et al. / Progress <strong>in</strong> Oceanography 110 (2013) 80–92Fig. 1. Location of <strong>the</strong> ANDEEP-SYSTCO stations. (A) Bathymetric map situat<strong>in</strong>g <strong>the</strong> stations across <strong>the</strong> Sou<strong>the</strong>rn Ocean, along <strong>the</strong> Prime Meridian. Exact coord<strong>in</strong>ates are given<strong>in</strong> Table 1. The map shows follow<strong>in</strong>g features of <strong>the</strong> Antarctic Circumpolar Current: Subtropical Front (STF), Subantarctic Front (SAF), Sou<strong>the</strong>rn Antarctic Circumpolar CurrentFront (sACCf), Polar Front (PF), Sou<strong>the</strong>rn Boundary of <strong>the</strong> Antarctic Circumpolar Current (sbACC) (Orsi et al., 1995). (B) Cross-section of <strong>the</strong> bathymetry along <strong>the</strong> transect with<strong>in</strong>dication of <strong>the</strong> stations. Bathymetry data provided by ETOPO1 (Amante <strong>and</strong> Eak<strong>in</strong>s, 2009).Table 1Overview of <strong>the</strong> ANDEEP-SYSTCO stations, deployments per station <strong>and</strong> core codes of <strong>the</strong> samples that were processed for meiofaunal densities <strong>and</strong> additionally for nematode<strong>community</strong> composition, diversity <strong>and</strong> biomass (<strong>in</strong> bold). Date, depth, longitude <strong>and</strong> latitude are listed. Per station, <strong>the</strong> labile portion of <strong>the</strong> organic carbon flux (LC org ), ascalculated by Sachs et al. (2009) based on <strong>in</strong> situ <strong>and</strong> ex situ measurements of O 2 profiles <strong>in</strong> surface sediments, is shown.Location Station-deployment (core code) Date Depth (m) Latitude Longitude LC org flux (mg C m 2 d 1 )PF 090-2 (2–8) 29.01.2008 3980 49°0.95 0 S 0°0.03 0 E 2.4sPF 013-12 (2–6–12) 06.12.2007 2963 52°2.22 0 S 0°1.04 0 W 3.3sPF 013-14 (1–4–9) 06.12.2007 2970 52°2.25 0 S 0°1.11 0 WsPF (2nd visit) 085-5 (2–3–11) 26.01.2008 2965 52°1.20 0 S 0°0.20 0 E 8.4 ± 1.0sPF (2nd visit) 085-7 (1–4–8) 27.01.2008 2964 52°1.53 0 S 0°0.16 0 EcWS 033-10 (3–4) 30.12.2007 5323 62°0.80 0 S 2°59.05 0 W 3.0MR 039-10 (5) 03.01.2008 2116 64°28.83 0 S 2°52.48 0 E 2.1 ± 0.4MR 039-12 (8) 03.01.2008 2123 64°28.83 0 S 2°52.53 0 EMR 039-14 (11) 03.01.2008 2119 64°28.84 0 S 2°52.49 0 ELS 017-12 (6–8–11) 22.12.2007 1935 70°4.86 0 S 3°22.59 0 W 2.0LS 017-14 (1–11–12) 22.12.2007 1951 70°4.80 0 S 3°22.71 0 Wbiomass was <strong>the</strong>n calculated with Andrassy’s formula (Andrassy,1956): wet weight (lg) = L (lm) W 2 (lm)/1.6 10 6 , <strong>and</strong> a dryto-wet-weightratio of 0.25 was assumed (Heip et al., 1985). To calculatetotal biomass of each sediment layer <strong>and</strong> sampl<strong>in</strong>g station,total nematode densities were taken <strong>in</strong>to account.Samples that were stored frozen for fatty acid analyses werethawed <strong>and</strong> triple centrifugated with Levasil Ò <strong>and</strong> kaol<strong>in</strong> (6 m<strong>in</strong>at 4000 rpm) to extract <strong>the</strong> meiofauna. The extracted meiofauna(size range: 1 mm to 32 lm) was r<strong>in</strong>sed with MilliQ water <strong>and</strong> processedimmediately. Two to three times 300–550 bulk nematode<strong>in</strong>dividuals per station (equal<strong>in</strong>g m<strong>in</strong>imum 33.1 lg to maximum193.3 lg dry weight) were h<strong>and</strong>picked with a f<strong>in</strong>e sterile needle.After r<strong>in</strong>s<strong>in</strong>g <strong>in</strong> MilliQ water to remove adher<strong>in</strong>g particles <strong>the</strong>ywere transferred <strong>in</strong> MilliQ water <strong>in</strong>to 4.0 ml GC vials with a
K. Guil<strong>in</strong>i et al. / Progress <strong>in</strong> Oceanography 110 (2013) 80–92 83m<strong>in</strong>imum of MilliQ water <strong>and</strong> frozen aga<strong>in</strong> at 80 °C before freezedry<strong>in</strong>g.Hydrolysis of total lipids <strong>and</strong> methylation to fatty acidmethyl esters (FAME) for FA analysis was achieved by a modifiedone-step derivatisation method after Abdulkadir <strong>and</strong> Tsuchiya(2008). The boron trifluoride-methanol reagent was replaced by a2.5% H 2 SO 4 -methanol solution s<strong>in</strong>ce BF 3 -methanol can cause artefactsor loss of polyunsaturated FA (PUFA; Eder, 1995). The fattyacid methylnonadecanoate C19:0 (Fluka 74208) was added as an<strong>in</strong>ternal st<strong>and</strong>ard for <strong>the</strong> quantification. Samples were centrifuged(Eppendorf centrifuge 5810R) <strong>and</strong> vacuum dried (Rapid Vap LAB-CONCO). The FAME obta<strong>in</strong>ed from <strong>the</strong> replicate extracts of <strong>the</strong>nematodes <strong>in</strong> each of <strong>the</strong> five locations were analyzed us<strong>in</strong>g agas chromatograph (Hewlett Packard 6890N) coupled to a massspectrometer (HP 5973). All samples were run <strong>in</strong> splitless mode,with a 5 lL <strong>in</strong>jection per run, at an <strong>in</strong>jector temperature of250 °C, us<strong>in</strong>g a HP88 column (60 m 25 mm <strong>in</strong>ternal diameter,Df = 0.20; Agilent J&W; Agilent Co., USA) with He flow rate of1.3 ml m<strong>in</strong> 1 . The oven temperature was programmed at 50 °Cfor 2 m<strong>in</strong>, followed by a ramp at 25 °C m<strong>in</strong> 1 to 75 °C, <strong>the</strong>n a secondramp at 2 °C m<strong>in</strong> 1 to 230 °C with a f<strong>in</strong>al 4 m<strong>in</strong> hold. FAMEwere identified by comparison with <strong>the</strong> retention times <strong>and</strong> massspectra of au<strong>the</strong>ntic st<strong>and</strong>ards <strong>and</strong> available ion spectra <strong>in</strong> WILEYmass spectral libraries, <strong>and</strong> analyzed with <strong>the</strong> software MSDChemStation (Agilent Technologies). Quantification of <strong>in</strong>dividualFAME was accomplished by <strong>the</strong> use of external st<strong>and</strong>ards (SupelcoTM37 Component FAME Mix, Supelco # 47885, Sigma–AldrichInc., USA). The quantification function of each <strong>in</strong>dividual FAMEwas obta<strong>in</strong>ed by l<strong>in</strong>ear regression applied to <strong>the</strong> chromatographicpeak areas <strong>and</strong> correspond<strong>in</strong>g known concentrations of <strong>the</strong> st<strong>and</strong>ards(rang<strong>in</strong>g from 5 to 150 lgmL 1 ). Shorth<strong>and</strong> FA notationsof <strong>the</strong> form A:BxX were used, where A represents <strong>the</strong> number ofcarbon atoms, B gives <strong>the</strong> number of double bonds <strong>and</strong> X is <strong>the</strong> positionof <strong>the</strong> double bond closest to <strong>the</strong> term<strong>in</strong>al methyl group(Guckert et al., 1985). Some FA, used as biomarkers for <strong>the</strong> typeof <strong>in</strong>gested food, are of special <strong>in</strong>terest <strong>and</strong> widely used for <strong>the</strong><strong>in</strong>terpretation of an organism’s FA composition. Therefore wegrouped <strong>the</strong> planktonic markers 16:1x7, 18:1x9, 18:2x6,20:PUFA, 22:PUFA; <strong>and</strong> <strong>the</strong> bacterial markers 15:0, 17:0, 15:1,17:1, iso <strong>and</strong> anteiso-branched SFA <strong>and</strong> MUFA, 10-methylpalmiticacid, 16:1x7t, 18:1x7c, cy17:0 <strong>and</strong> cy19:0 (e.g. Dalsgaard et al.,2003 <strong>and</strong> references <strong>the</strong>re<strong>in</strong>; Camacho-Ibar et al., 2003 <strong>and</strong> references<strong>the</strong>re<strong>in</strong>; Desvilettes et al., 1997; Gurr <strong>and</strong> Harwood, 1991).2.3. Statistical analysisStatistical analyses were conducted us<strong>in</strong>g PRIMER version 6with PERMANOVA+ add-on software (Clarke <strong>and</strong> Gorley, 2006;Anderson et al., 2008). Prior to <strong>the</strong> analyses, nematode density<strong>and</strong> biomass data of <strong>the</strong> upper 5 cm layers were summed tak<strong>in</strong>g<strong>in</strong>to account <strong>the</strong> <strong>in</strong>dividual counts per depth layer. Structuraldiversity was assessed with Hill’s <strong>in</strong>dices that are variably dependenton relative genera abundances <strong>and</strong> thus cover both genusrichness <strong>and</strong> evenness (H 0 = number of genera, H 1 , H 2 , H <strong>in</strong>f ; Hill,1973; Heip et al., 1998). Additionlly, a rarefaction <strong>in</strong>dex, i.e. <strong>the</strong> expectednumber of genera present <strong>in</strong> a population of 100 <strong>in</strong>dividuals(EG(100); Hurlbert, 1971), was generated. To assess functionaldiversity, <strong>the</strong> trophic diversity <strong>in</strong>dex H 1 was calculated (Heipet al., 1988). Along <strong>the</strong> transect both univariate <strong>and</strong> multivariatenon-parametric permutational ANOVAs (PERMANOVA) were performedto test for differences <strong>in</strong> nematode density, biomass, diversity,FA content <strong>and</strong> nematode genus <strong>and</strong> FA composition,respectively. One replicate fatty acid sample (cWS) was omittedfrom <strong>the</strong> dataset due to exorbitant high measured concentrationscompared to <strong>the</strong> o<strong>the</strong>r samples. Euclidean distance similarity wasused as resemblance measure on untransformed univariate data,while Bray–Curtis similarity was used as resemblance measureon st<strong>and</strong>ardized <strong>and</strong> square root or log(x + 1) transformed genusabundances <strong>and</strong> FA relative percentages, respectively. Both modelshad an unbalanced one factor design <strong>in</strong>clud<strong>in</strong>g <strong>the</strong> fixed categoricalfactor ‘location’. Calculation of <strong>the</strong> Pseudo-F ratio <strong>and</strong> p value requiredunrestricted permutation of raw data (univariate) or 9999permutations of <strong>the</strong> residuals under a reduced model (multivariate).Post-hoc pairwise tests were only performed after PERMDISPconfirmation of homogeneity of multivariate sample dispersion<strong>and</strong> clarified between which locations or sediment depth layersthat <strong>the</strong> significant differences identified by <strong>the</strong> ma<strong>in</strong> tests werefound. Because of <strong>the</strong> restricted number of unique permutations<strong>in</strong> <strong>the</strong> pairwise tests, p values were obta<strong>in</strong>ed from Monte Carlosampl<strong>in</strong>gs (Anderson <strong>and</strong> Rob<strong>in</strong>son, 2003). A non-metric multidimensionalscal<strong>in</strong>g (MDS) plot was constructed to visualize <strong>the</strong>nematode <strong>community</strong> composition among all stations. To visualize<strong>the</strong> differences <strong>in</strong> nematode FA compositions among <strong>the</strong> stations aPr<strong>in</strong>cipal Coord<strong>in</strong>ates analysis (PCO) was used. PCO is comparableto MDS <strong>in</strong> that it is very flexible – it can be based on any (symmetric)resemblance matrix. However, it is also like a PCA, <strong>in</strong> that it is aprojection of <strong>the</strong> po<strong>in</strong>ts onto axes that m<strong>in</strong>imize residual variation<strong>in</strong> <strong>the</strong> space of <strong>the</strong> resemblance measure chosen. Due to <strong>the</strong> limitedsample-to-variable ratio, variables represented by less than fivesamples were deleted to improve <strong>the</strong> reliability <strong>and</strong> reproducibilityof <strong>the</strong> analysis as proposed by Tabachnick <strong>and</strong> Fidell (1989) for PCAanalyses (Budge et al., 2006). In addition, a new feature provided aspart of <strong>the</strong> PERMANOVA+ add-on is <strong>the</strong> ability to superimposevectors onto <strong>the</strong> plot that correspond to <strong>the</strong> raw correlations of<strong>in</strong>dividual variables with <strong>the</strong> ord<strong>in</strong>ation axes. We chose <strong>the</strong> Spearmanrank correlation that shows monotonic <strong>in</strong>creas<strong>in</strong>g or decreas<strong>in</strong>grelationships with axes. The vector overlay <strong>in</strong>cludes only thoseFA that correlated with more than 60% with one of <strong>the</strong> first twoPCO-axes. Additionally a RELATE analysis on replicate samples,based on <strong>the</strong> Spearman rank method, was used to test for a correlationbetween <strong>the</strong> nematode <strong>community</strong> composition (generic<strong>and</strong> trophic) <strong>and</strong> fatty acid composition at all stations.To test <strong>the</strong> effect of a settled phytoplankton bloom on differentnematode parameters (<strong>community</strong> composition, total <strong>and</strong> mean<strong>in</strong>dividual biomass, juvenile versus adult ratio) over 5 cm depthat <strong>the</strong> sPF station, multivariate <strong>and</strong> univariate PERMANOVA analyseswith a balanced fully crossed three factor design were used.The model <strong>in</strong>cluded <strong>the</strong> fixed categorical factors ‘time’ <strong>and</strong> ‘sedimentdepth’ with <strong>the</strong> r<strong>and</strong>om ‘replicate’ factor nested <strong>in</strong> ‘time’(s<strong>in</strong>ce data from different depth layers from a s<strong>in</strong>gle replicate coreare not fully <strong>in</strong>dependent), <strong>and</strong> all <strong>in</strong>teraction terms. Both multivariate<strong>and</strong> univariate analysis were run as described above.3. Results3.1. <strong>Latitud<strong>in</strong>al</strong> <strong>variability</strong> across <strong>the</strong> Sou<strong>the</strong>rn Ocean3.1.1. Nematode <strong>community</strong> <strong>structure</strong>Nematodes dom<strong>in</strong>ated <strong>the</strong> metazoan meiofauna at all locations,with a dom<strong>in</strong>ance rang<strong>in</strong>g from 80.5 ± 3.3% to 92.6 ± 0.3% (Table 2).Nematode densities ranged from 69 ± 5 <strong>in</strong>d. 10 cm 2 to1102 ± 233 <strong>in</strong>d. 10 cm 2 , with lowest densities found at <strong>the</strong> PF station<strong>and</strong> highest at <strong>the</strong> MR station. Nematode biomass ranged from11.3 ± 2.6 lg dwt 10 cm 2 at <strong>the</strong> PF station to 324.1 ± 175.5 lg dwt10 cm 2 at <strong>the</strong> MR station. The curiously low mean density <strong>and</strong>biomass at <strong>the</strong> Polar Front station confirm what was visually determ<strong>in</strong>edon board, i.e. that <strong>the</strong> samples were disturbed <strong>in</strong> <strong>the</strong> courseof <strong>the</strong> sampl<strong>in</strong>g process. Therefore, nematode st<strong>and</strong><strong>in</strong>g stocks of<strong>the</strong> PF station were not <strong>in</strong>cluded <strong>in</strong> <strong>the</strong> analyses. PERMANOVAfound significantly lower nematode densities at <strong>the</strong> sPF stationcompared to <strong>the</strong> MR station <strong>and</strong> at <strong>the</strong> sPF revisited station comparedto <strong>the</strong> stations cWS, MR <strong>and</strong> LS (Table 3). Significant
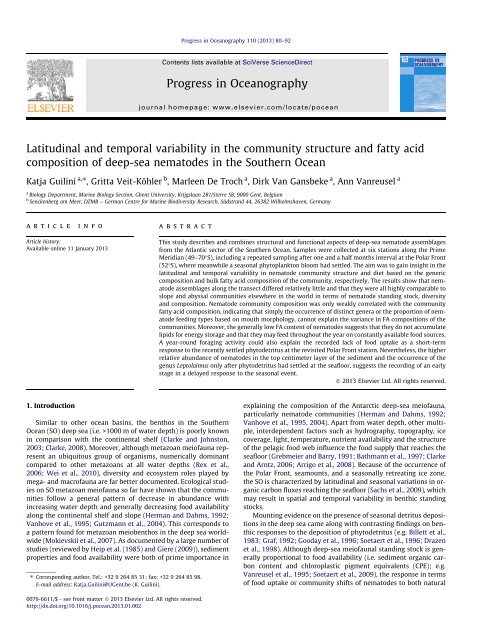
84 K. Guil<strong>in</strong>i et al. / Progress <strong>in</strong> Oceanography 110 (2013) 80–92Table 2Nematode relative abundance, density, biomass, diversity (H 0 , H 1 , H 2 , H <strong>in</strong>f , EG(100)) <strong>and</strong> relative abundance of <strong>the</strong> nematode feed<strong>in</strong>g types <strong>and</strong> trophic diversity (H 1 ) for <strong>the</strong> top5 cm of <strong>the</strong> sediment, averaged per location (± st<strong>and</strong>ard deviation).LocationNematode relativeabundance (%)Nematode density(<strong>in</strong>d. 10 cm 2 )Nematode biomass(lg dwt 10 cm 2 )H 0 H 1 H 2 H <strong>in</strong>f EG(100) Feed<strong>in</strong>g types H 11A 1B 2A 2BPF 90.9 ± 0.1 69 ± 5 11.3 ± 2.6 49.5 ± 4.9 24.7 ± 2.5 14.2 ± 0.4 5.7 ± 0.0 35.8 ± 2.5 53 ± 2 16 ± 1 24 ± 4 8 ± 1 2.7 ± 0.1sPF 85.5 ± 2.6 693 ± 258 105.7 ± 11.5 55.3 ± 2.9 26.5 ± 1.0 17.5 ± 2.0 7.8 ± 1.4 34.6 ± 1.0 30 ± 5 22 ± 1 42 ± 4 6 ± 2 3.1 ± 0.1sPF (2nd visit) 80.5 ± 3.3 480 ± 48 62.5 ± 21 54.3 ± 3.1 26.5 ± 1.4 17.3 ± 0.9 7.4 ± 0.8 33.5 ± 2.5 30 ± 7 15 ± 1 51 ± 6 4 ± 1 2.6 ± 0.1cWS 92.3 ± 2.8 648 ± 145 159.0 ± 58.3 47.5 ± 0.7 18.8 ± 1.1 10.4 ± 0.2 4.2 ± 0.1 28.8 ± 0.6 28 ± 2 43 ± 4 26 ± 0 3 ± 2 3.0 ± 0.2MR 92.6 ± 0.3 1102 ± 233 324.1 ± 175.5 45.3 ± 3.2 24.2 ± 3.7 17.2 ± 3.3 7.2 ± 0.9 33.7 ± 2.4 24 ± 2 17 ± 1 51 ± 4 9 ± 3 2.9 ± 0.2LS 86.4 ± 2.5 833 ± 132 294.5 ± 145.7 57.0 ± 1.0 30.8 ± 3.0 21.7 ± 3.8 9.5 ± 2.7 39.0 ± 1.0 29 ± 6 28 ± 6 33 ± 4 11 ± 2 3.5 ± 0.1differences <strong>in</strong> biomass were only detected between both sampl<strong>in</strong>gtimes at <strong>the</strong> sPF station (Table 3).A total of 137 genera belong<strong>in</strong>g to 36 families were identified.An overview of <strong>the</strong> dom<strong>in</strong>ant genera per station, with a relativeabundance higher than 2%, is given <strong>in</strong> Table 4. The four genera thatdom<strong>in</strong>ate at all stations, though with vary<strong>in</strong>g abundances, are Desmoscolex(16.8–3.3%), Acantholaimus (13.5–6.2%), Tricoma (6.8–2.3%) <strong>and</strong> Halalaimus (7.9–2.8%). Only between 6.0% <strong>and</strong> 16.6% of<strong>the</strong> genera were present with abundances lower than 1%. The percentageof genera that occurred exclusively at one station rangedfrom 2.1% at <strong>the</strong> MR station to 9.0% at <strong>the</strong> LS station. These exclusivegenera only accounted for 0.4–2.7% of <strong>the</strong> total abundances.PERMANOVA results showed that <strong>the</strong> nematode assemblages differedamong <strong>the</strong> stations (Table 3). Pairwise comparisons revealedthat significant differences were only found between <strong>the</strong> stationMR <strong>and</strong> all o<strong>the</strong>r stations, except for <strong>the</strong> sPF station; <strong>and</strong> between<strong>the</strong> stations sPF (2nd visit) <strong>and</strong> cWS <strong>and</strong> LS (Table 3). These resultswere visualized <strong>in</strong> an MDS plot (Fig. 2).Diversity <strong>in</strong>dices differed significantly among <strong>the</strong> stations (Table3). S<strong>in</strong>ce no consistent pattern among <strong>the</strong> stations occurred,due to vary<strong>in</strong>g relative abundances of rare genera, <strong>the</strong> averagediversity measures are <strong>in</strong>terpreted. Average structural diversity<strong>in</strong>dices were all highest for <strong>the</strong> LS station (Table 2), regardless of<strong>the</strong> emphasis given to relatively more or less abundant genera. Besides<strong>the</strong> highest average number of genera (H 0 = 57 ± 1) <strong>and</strong>expected number of genera on 100 <strong>in</strong>dividuals (EG(100) = 39 ± 1),genera also occurred most evenly (H <strong>in</strong>f = 9.5 ± 2.7), withAcantholaimus be<strong>in</strong>g <strong>the</strong> most dom<strong>in</strong>ant genus (9.2%). While <strong>the</strong>lowest number of genera was found at <strong>the</strong> MR station(45.3 ± 3.2), Hill’s diversity <strong>in</strong>dices <strong>in</strong>dicated lowest evenness dueto highest dom<strong>in</strong>ance of one genus (Theristus: 23.9%) at <strong>the</strong> deepeststation, cWS. In terms of evenness, diversity more or less decreasedwith water depth.Based on mouth morphology, nematode assemblages weredom<strong>in</strong>ated by epistratum feeders at most stations (sPF: 42 ± 4%,sPF (2nd visit): 51 ± 6%, MR: 51 ± 4% <strong>and</strong> LS: 33 ± 4%), followedby selective deposit (24 ± 2% to 30 ± 5%) <strong>and</strong> non-selective depositfeeders (15 ± 1% to 28 ± 6%). At <strong>the</strong> PF station <strong>the</strong> proportion of epistratum(24 ± 4%) <strong>and</strong> selective deposit feeders (53 ± 2%) was reversed,while at <strong>the</strong> cWS station non-selective deposit feedersdom<strong>in</strong>ated (43 ± 4%), followed by epistratum (28 ± 2%) <strong>and</strong> selectivedeposit feeders (26%) (Table 2). Predators <strong>and</strong> scavengershad <strong>the</strong> lowest abundances at all stations (3 ± 2% to 11 ± 2%). Trophicdiversity ranged from 2.6 ± 0.1 at <strong>the</strong> sPF (2nd visit) station to3.5 ± 0.1 at <strong>the</strong> LS station (Table 2), with a significantly higher trophicdiversity at <strong>the</strong> LS station compared to all o<strong>the</strong>r stations(Table 3).3.1.2. Nematodes fatty acid compositionsAt all stations, PUFA dom<strong>in</strong>ated <strong>in</strong> nematodes (34.2% to45.3 ± 9.5%; Table 5). When FA markers were allocated to <strong>the</strong> potentialfood source, planktonic FA (R 16:1x7c, 18:1x9, 18:2x6,Table 3Results from ma<strong>in</strong> <strong>and</strong> pairwise one-factor multivariate <strong>and</strong> univariate PERMANOVA analyses test<strong>in</strong>g for differences <strong>in</strong> nematode <strong>community</strong> composition, nematode fatty acidcomposition <strong>and</strong> nematode density, biomass, structural diversity <strong>and</strong> functional diversity, <strong>and</strong> nematode d 13 C <strong>and</strong> d 15 N values, respectively, <strong>in</strong> <strong>the</strong> top 5 cm of <strong>the</strong> sedimentamong all locations. Significant differences are <strong>in</strong>dicated <strong>in</strong> bold.FactorNematodedensityNematodebiomassNematode<strong>community</strong>Nematode diversityH 0 H 1 H 2 H <strong>in</strong>f EG(100) H 1Location df 4 4 5 5 5 5 5 5 5 5MS 1.0 10 7 39667 1758 62.2 37.4 34.2 7.8 26.7 0.3 253.1Pseudo-F 6,6857 a 3.29 3.33 b 7.49 a 6.41 a 5.67 a 3.71 a 7.75 a 12.67 a 4.31 bResiduals df 18 9 10 10 10 10 10 10 10 13MS 1.5 10 6 12072 528.6 8.3 5.8 6.0 2.1 3.4 0.02 58.7Total df 22 13 15 15 15 15 15 15 15 18PF, sPF t – – 1.86 1.73 1.20 2.22 2.07 0.78 4.04 b 1.75PF, sPF (2nd visit) t – – 1.85 1.40 1.04 4.45 a 2.98 1.00 0.57 2.15PF, cWS t – – 1.85 0.57 3.06 12.56 a 20.4 a 3.86 2.37 1.19PF, MR t – – 2.19 a 1.18 0.17 1.25 2.21 0.95 1.16 2.34 aPF, LS t – – 1.81 2.76 2.35 2.65 1.85 2.15 10.33 a 3.71 asPF, sPF (2nd visit) t 1.67 3.06 a 1.03 0.41 0.03 0.14 0.48 0.72 4.54 b 1.67sPF, cWS t 0.08 1.67 1.66 3.59 a 8.42 a 4.75 a 3.56 a 7.14 a 0.93 1.20sPF, MR t 2.72 a 2.15 1.78 4.01 a 1.06 0.12 0.73 0.63 1.49 1.57sPF, LS t 1.57 2.24 1.53 0.94 2.38 1.71 0.92 5.40 a 4.04 b 2.60 asPF (2nd visit), cWS t 2.59 a 2.78 2.02 a 2.96 6.34 a 9.97 a 5.67 a 2.46 2.77 1.56sPF (2nd visit), MR t 6.10 b 2.56 1.91 a 3.52 a 1.01 0.05 0.37 0.09 1.72 1.88 asPF (2nd visit), LS t 5.52 b 2.73 1.80 a 1.44 2.27 1.95 1.26 3.56 a 9.42 a 3.36 acWS, MR t 2.40 1.23 2.33 a 0.89 1.93 2.79 4.55 a 2.66 0.54 1.13cWS, LS t 1.66 1.20 1.75 11.4 a 5.22 a 3.96 a 2.61 12.61 a 4.49 b 2.75 aMR, LS t 2.26 0.58 2.13 a 6.00 a 2.43 1.56 1.40 3.55 a 4.26 b 2.48 aa 0.001 < p 6 0.05.b p 6 0.001Nematodefatty acids
K. Guil<strong>in</strong>i et al. / Progress <strong>in</strong> Oceanography 110 (2013) 80–92 85Table 4Mean relative abundance of dom<strong>in</strong>ant genera (>2%) per station, over 5 cm sediment depth.PF % sPF % sPF (2nd visit) % cWS % MR % LS %Desmoscolex 16.8 Acantholaimus 13.0 Acantholaimus 12.4 Theristus 23.9 Act<strong>in</strong>onema 11.7 Acantholaimus 9.2Acantholaimus 13.5 Daptonema 8.1 Microlaimus 10.6 Acantholaimus 11.5 Desmodora 11.4 Sabatieria 8.8Tricoma 6.8 Halalaimus 7.9 Chromador<strong>in</strong>a 8.0 Desmoscolex 7.8 Microlaimus 6.6 Desmoscolex 6.9Monhystrella 6.1 Act<strong>in</strong>onema 6.3 Halalaimus 6.0 Daptonema 7.8 Acantholaimus 6.2 Dichromadora 5.1Halalaimus 4.0 Desmoscolex 5.6 Act<strong>in</strong>onema 4.6 Halalaimus 4.5 Chromador<strong>in</strong>a 5.9 Cervonema 4.7Gammanema 3.5 Desmodorella 4.4 Tricoma 4.6 Dichromadora 4.2 Paramesacanthion 5.4 Daptonema 4.7Leptolaimus 3.5 Monhystrella 4.3 Monhystrella 4.5 Tricoma 4.1 Enchonema 3.8 Chromador<strong>in</strong>a 3.5Prototricoma 3.3 Chromador<strong>in</strong>a 4.0 Desmoscolex 4.1 Monhystrella 3.3 Dichromadora 3.5 Halalaimus 3.3Diplopeltoides 2.9 Tricoma 3.5 Daptonema 3.7 Intasia 3.0 Leptolaimus 3.5 Microlaimus 3.3Procamacolaimus 2.2 Pselionema 2.9 Desmodora 3.3 Microlaimus 2.7 Thalassomonhystera 3.4 Intasia 2.9Microlaimus 2.9 Leptolaimus 3.0 Enchonema 2.2 Desmoscolex 3.3 Bolbolaimus 2.8Intasia 2.5 Intasia 3.0 Prototricoma 2.2 Halalaimus 2.8 Desmodorella 2.6Paracantonchus 2.5 Paracantonchus 2.9 Leptolaimus 2.1 Tricoma 2.5 Tricoma 2.3Desmodora 2.2 Pselionema 2.7 Pselionema 2.1 Act<strong>in</strong>onema 2.1Desmodorella 2.4 Theristus 2.0Rest 37.5 Rest 29.8 Rest 24.2 Rest 20.5 Rest 27.9 Rest 35.73.2. Temporal <strong>variability</strong> at <strong>the</strong> south Polar FrontFig. 2. Non-parametric multi-dimensional scal<strong>in</strong>g (MDS) plot of <strong>the</strong> nematodecommunities <strong>in</strong> <strong>the</strong> top 5 cm of <strong>the</strong> sediment along <strong>the</strong> ANDEEP-SYSTCO transect.20:PUFA, 22:PUFA) were dom<strong>in</strong>ant <strong>in</strong> nematodes at all stations,with values vary<strong>in</strong>g from 59.4 ± 3.0% at <strong>the</strong> sPF station to67.6 ± 3.7% at <strong>the</strong> PF station. Only a few conventional bacterialFA biomarkers were found <strong>in</strong> <strong>the</strong> nematodes (15:0, 17:0,17:1x7c). Toge<strong>the</strong>r <strong>the</strong>y accounted for a maximum of 5.7 ± 0.9%of <strong>the</strong> total amount of FA at <strong>the</strong> PF station. The predom<strong>in</strong>ant <strong>in</strong>dividualfatty acids that reached more than 10% relative abundanceat one of <strong>the</strong> stations were 14:0, 16:0, 18:1x9t, 18:1x9c,20:4x6, 20:5x3, <strong>and</strong> 22:6x3. Total FA content of nematodes, expressedas <strong>the</strong> percentage of dry weight, varied from 0.29 ± 0.03%at <strong>the</strong> PF station to 6.21 ± 4.4% at <strong>the</strong> cWS station (Table 5), withsignificant differences only found between <strong>the</strong> stations PF <strong>and</strong>MR (Pairwise test, P(perm) = 0.038) <strong>and</strong> between LS <strong>and</strong> MR (Pairwisetest, P(perm) = 0.005). The PERMANOVA analysis also <strong>in</strong>dicateda difference <strong>in</strong> FA composition between <strong>the</strong> LS station <strong>and</strong>all o<strong>the</strong>r stations, <strong>and</strong> between <strong>the</strong> MR station <strong>and</strong> <strong>the</strong> PF <strong>and</strong>sPF (2nd visit) stations (Table 3). The PCO analysis expla<strong>in</strong>ed54.5% of total variance <strong>in</strong> FA compositions of nematodes <strong>in</strong> <strong>the</strong> firsttwo axes (29% <strong>and</strong> 25.5%, respectively) (Fig. 3). The vector overlay<strong>in</strong>dicates FA-specific correlation of more than 60% with one of <strong>the</strong>first two PCO axes, <strong>and</strong> thus identifies which FA are characteristicfor <strong>the</strong> observed patterns <strong>in</strong> <strong>the</strong> ord<strong>in</strong>ation. The most obvious f<strong>in</strong>d<strong>in</strong>gis that nematodes from <strong>the</strong> LS station differed from all o<strong>the</strong>rstations ma<strong>in</strong>ly due to <strong>in</strong>creased levels of <strong>the</strong> FA 16:1x7c, 14:0,20:5x3 <strong>and</strong> 20:0 (Fig. 3, Table 5). Accord<strong>in</strong>g to <strong>the</strong> RELATE analysisnematode fatty acid compositions were only poorly correlated tonematode <strong>community</strong> composition, both on generic (rho = 0.304,p = 0.04) <strong>and</strong> trophic level (rho = 0.491, p = 0.02).Between pre- <strong>and</strong> post-settlement of <strong>the</strong> phytoplankton bloom,<strong>the</strong> nematode <strong>community</strong> composition did not change (Table 3).This was also <strong>the</strong> case when PERMANOVA considered each centimeterseparately (Table 6). At <strong>the</strong> sPF station Acantholaimus was<strong>the</strong> most dom<strong>in</strong>ant genus before (13.0%) as well as after (12.4%)<strong>the</strong> bloom had settled (Table 4). All o<strong>the</strong>r dom<strong>in</strong>ant genera that occurredat <strong>the</strong> pre-bloom situation rema<strong>in</strong>ed dom<strong>in</strong>ant over time,although with small variations <strong>in</strong> relative abundances. Leptolaimus,however, only appeared after <strong>the</strong> bloom had settled (3.0%, Table 4).Although total nematode densities per centimeter layer did notchange with time (Table 6), a significantly higher portion of nematodeswas found <strong>in</strong> <strong>the</strong> top centimeter after compared to before<strong>the</strong> bloom had settled (44.5 ± 7.5% versus 32.8 ± 10%, respectively;Fig. 4, Table 6). A significant difference <strong>in</strong> total nematode biomasswas found based on <strong>the</strong> <strong>in</strong>teraction term ‘Time Sediment depth’(Fig. 4, Table 6). Never<strong>the</strong>less, a PERMDISP analysis revealed thatthis difference was due to a difference <strong>in</strong> relative data dispersionbetween <strong>the</strong> two sampl<strong>in</strong>g times. Therefore no valid pairwise comparisonbetween <strong>the</strong> different sediment depth layers of <strong>the</strong> differentsampl<strong>in</strong>g times could be performed. Mean <strong>in</strong>dividual biomassof nematodes <strong>and</strong> <strong>the</strong> relative proportions of juveniles <strong>and</strong> adultsdid also not change over time (Table 6).4. Discussion4.1. <strong>Latitud<strong>in</strong>al</strong> <strong>variability</strong> across <strong>the</strong> Sou<strong>the</strong>rn Ocean4.1.1. Nematode <strong>community</strong> <strong>structure</strong>The dom<strong>in</strong>ance of nematodes <strong>in</strong> meiofaunal assemblages is <strong>in</strong>accordance with o<strong>the</strong>r observations <strong>in</strong> <strong>the</strong> SO (Herman <strong>and</strong> Dahms,1992; Vanhove et al., 1995, 2004; Gutzmann et al., 2004), <strong>and</strong> correspondsto a broad range of deep-sea sediments throughout <strong>the</strong>world’s oceans (Mokievskii et al., 2007). Along <strong>the</strong> latitud<strong>in</strong>al AN-DEEP-SYSTCO transect, however, nematode relative proportionsamong <strong>the</strong> meiofauna as well as meiofaunal densities <strong>and</strong> nematodest<strong>and</strong><strong>in</strong>g stock did not consistently decrease with water depthas usually found along cont<strong>in</strong>ental slopes. We ra<strong>the</strong>r suggest that,along <strong>the</strong> transect, <strong>the</strong> variable productivity <strong>and</strong> water depth, are<strong>in</strong>teract<strong>in</strong>g driv<strong>in</strong>g forces that determ<strong>in</strong>e nematode st<strong>and</strong><strong>in</strong>gstocks. Never<strong>the</strong>less, most of <strong>the</strong> meiofaunal densities are situatedslightly above <strong>the</strong> World Ocean’s regression l<strong>in</strong>e provided <strong>in</strong> Soltwedel(2000) <strong>and</strong> Wei et al. (2010). Likewise, nematode biomass isrelatively high compared to areas worldwide at similar depths(Mokievskii et al., 2007).
86 K. Guil<strong>in</strong>i et al. / Progress <strong>in</strong> Oceanography 110 (2013) 80–92Table 5Relative concentrations of <strong>in</strong>dividual FA (% of total FA) <strong>in</strong> nematodes from all ANDEEP-SYSTCO stations: saturated FA (SFA), monounsaturated FA (MUFA), polyunsaturated FA(PUFA). FA of planktonic <strong>and</strong> bacterial orig<strong>in</strong> <strong>and</strong> <strong>the</strong> ratios of FA 16:1x7/16:0 <strong>and</strong> 20:5x6/22:6x3 are reported as biomarkers. Total dry weight (lg), FA concentration (lg/350 llextract) <strong>and</strong> <strong>the</strong> fraction of total FA versus nematodes dry weight are given for <strong>the</strong> total number of nematode <strong>in</strong>dividuals analyzed per sample. All concentrations <strong>and</strong> ratios areexpressed as average ± st<strong>and</strong>ard deviation of P2 (pseudo-)replicates.PF sPF sPF (2nd visit) cWS MR LSPS 71/90 PS 71/13 PS 71/85 PS 71/33 PS 71/39 PS 71/1712:0 0.7 ± 0.9 0.9 ± 0.2 0.5 ± 0.2 1.7 0.6 ± 0.2 0.4 ± 0.114:0 3.3 ± 0.3 5.7 ± 1.7 4.8 ± 0.9 5.1 4.1 ± 0.8 11.0 ± 2.114:1x5c – – 1.2 ± 1.1 – – –15:0 1.7 ± 0.9 1.4 ± 0.8 1.0 ± 0.5 0.7 1.0 ± 0.1 0.5 ± 0.216:0 7.7 ± 1 11.8 ± 3.9 10.2 ± 3.5 6.3 7.5 ± 3.3 10.6 ± 1.916:1x7c 2.2 ± 0.5 3.5 ± 2.0 4.0 ± 3.4 3.6 3.1 ± 1.3 6.0 ± 0.617:0 2.6 ± 2 4.3 ± 0.1 3.0 ± 0.5 2.1 2.5 ± 0.7 1.4 ± 0.317:1x7c – – 0.4 ± 0.6 – – –18:0 4.9 ± 0.2 7.4 ± 0.8 5.4 ± 0.6 3.9 5.6 ± 0.9 3.4 ± 0.418:1x9t 13.6 ± 4.4 7.2 ± 2.9 7.0 ± 1.2 8.7 7.7 ± 1.4 10.9 ± 0.818:1x9c 8.6 ± 0.01 8.2 ± 1.4 8.8 ± 1.4 10.1 6.6 ± 0.8 10.1 ± 0.518:2x6t 3.7 ± 5.2 – – – 0.9 ± 1.8 –18:2x6c 6.0 ± 1.8 1.0 ± 0.6 1.3 ± 0.4 2.9 1.8 ± 0.2 2.1 ± 0.820:0 – 0.7 ± 1.1 – 1.6 0.6 ± 1.5 2.5 ± 0.220:1x9t 2.8 ± 1.6 1.9 ± 0.6 1.8 ± 0.5 3.0 2.2 ± 1.0 2.5 ± 0.620:1x9c 3.0 ± 0.1 2.4 ± 1.4 3.3 ± 0.9 3.8 2.8 ± 0.5 2.5 ± 0.820:2x6 3.1 ± 1.6 1.4 ± 0.3 1.2 ± 0.7 3.4 3.7 ± 0.8 1.2 ± 0.220:3x3 – – 0.1 ± 0.1 0.9 0.2 ± 0.6 0.2 ± 0.320:3x6 – – 7.6 ± 1.8 – 2.6 ± 3.7 –20:4x6 13.7 ± 2.8 8.9 ± 1.3 9.9 ± 4.9 11.2 10.3 ± 3.5 5.8 ± 1.220:5x3 6.9 ± 0.1 9.3 ± 2.2 9.3 ± 3.5 8.6 7.6 ± 0.4 12.3 ± 0.822:1x9 – 1.1 ± 1.0 0.9 ± 0.7 1.5 0.9 ± 0.2 0.8 ± 0.122:6x3 9.7 ± 2.8 19.7 ± 3.8 15.9 ± 2.9 17.5 15.5 ± 5.0 13.8 ± 1.324:1x6 5.9 ± 2.4 3.2 ± 1.9 2.4 ± 0.2 3.4 2.6 ± 0.2 1.8 ± 0.1P SFA 20.8 ± 4.7 32.1 ± 5.8 25.0 ± 4.4 21.3 20.6 ± 3.3 29.9 ± 4.5P MUFA 36.1 ± 3.9 27.6 ± 0.4 29.7 ± 5.2 15.3 25.4 ± 3.6 34.7 ± 2.2P PUFA 43.1 ± 8.5 40.4 ± 6.2 45.3 ± 9.5 34.2 41.2 ± 4.2 35.4 ± 3.9P planktonic 67.6 ± 3.7 59.4 ± 3.0 65.1 ± 3.8 67.0 67.4 ± 3.0 62.5 ± 4.2P bacterial 4.3 ± 2.9 5.7 ± 0.9 4.4 ± 1.4 – 3.5 ± 0.7 2.0 ± 0.416:1x7/16:0 0.3 ± 0.03 0.3 ± 0.1 0.4 ± 0.2 0.6 0.5 ± 1.4 0.6 ± 0.1Number of nematodes 300 300 313 ± 22 543 ± 11 300 300Nematodes dry weight (lg) 51.1 ± 25.4 87.0 ± 55.8 63.8 ± 21.9 121.5 ± 56 85.1 ± 42.1 112.9 ± 62.3FA concentrations (lg/350 lL extract) 0.6 ± 0.001 0.7 ± 0.1 1.4 ± 0.8 5.1 ± 3.5 1.4 ± 0.5 2.6 ± 1.3FA fractions (% of nematode dwt) 0.29 ± 0.03 0.63 ± 0.05 0.92 ± 0.6 6.21 ± 4.4 1.16 ± 0.4 3 ± 1.4Fig. 3. Pr<strong>in</strong>cipal Coord<strong>in</strong>ates (PCO) plot based on <strong>the</strong> relative fatty acid composition of nematodes from all ANDEEP-SYSTCO stations. The vector overlay <strong>in</strong>dicates FA-specificcorrelations of more than 60% with one to <strong>the</strong> first two PCO axes.
K. Guil<strong>in</strong>i et al. / Progress <strong>in</strong> Oceanography 110 (2013) 80–92 87Table 6Results from ma<strong>in</strong> <strong>and</strong> pairwise one-factor multivariate <strong>and</strong> univariate PERMANOVA <strong>and</strong> PERMDISP analyses test<strong>in</strong>g for differences <strong>in</strong> nematode <strong>community</strong> composition, <strong>and</strong>nematode density, relative abundance, biomass, mean <strong>in</strong>dividual biomass, <strong>and</strong> juvenile/adult ratio (J/A), respectively, over <strong>the</strong> top 5 cm of <strong>the</strong> sediment between <strong>the</strong> sPF <strong>and</strong> sPF(2nd visit) station. Significant differences are <strong>in</strong>dicated <strong>in</strong> bold.Test Factor Nematode<strong>community</strong>NematodedensityNematode relativeabundanceNematodebiomassNematode mean<strong>in</strong>dividual biomassPERMANOVA Time df 1 1 1 1 1 1MS 2169.6 1.3 10 6b 3.4 10 12 559.2 a 7.9 10 4 0.13Pseudo-F 1.49 4.58 Denom<strong>in</strong>ator is 0 9.35 0.10 7.65Sediment depth df 4 4 4 4 4 4MS 3865.3 3781300 2439.8 1159.5 0.03 0.27Pseudo-F 3.66 b 33.61 b 53.43 b 27.48 b 3.14 a 3.57 aRe(Time) df 4 10 10 4 4 2MS 1456 287860 5.3 10 13 59.8 0.008 0.28Pseudo-F 1.38 a 2.56 a Negative 1.42 0.91 4.27 aTime x Sediment depth df 4 4 4 4 4 4MS 929.8 188480 192.0 202.0 0.002 0.054Pseudo-F 0.88 1.68 4.20 a 4.79 a 0.26 0.84Residuals df 16 40 40 16 16 8MS 1055.1 112510 45.66 42.19 0.009 0.07Total df 29 59 59 29 29 29PERMDISP Sediment depth F 0.49 0.05 0.41 8.89 a 0.007 1.97df 1 1 1 1 1 1 4df 2 8 8 8 8 8 25Pairwise test 0–1 cm: sPF, sPF (2nd visit) t 1.12 0.20 2.40 a 1.551–2 cm: sPF, sPF (2nd visit) t 0.91 2.15 1.05 0.322–3 cm: sPF, sPF (2nd visit) t 1.26 2.22 2.02 0.053–4 cm: sPF, sPF (2nd visit) t 0.92 1.28 0.13 0.164–5 cm: sPF, sPF (2nd visit) t 0.90 2.10 1.37 1.37a 0.001 < p 6 0.05.b p 6 0.001).Nematode J/ADespite <strong>the</strong> broad latitud<strong>in</strong>al range covered along <strong>the</strong> ANDEEP-SYSTCO transect (49–70° S, i.e. around 2400 km), relatively littlevariation is found between <strong>the</strong> deep-sea nematode communities<strong>in</strong> terms of generic composition. Although <strong>the</strong> MDS plot (Fig. 2)gives an <strong>in</strong>dication of a subdivision <strong>in</strong>to four communities, <strong>the</strong>low percentage of exclusive genera at each station, toge<strong>the</strong>r with<strong>the</strong> dom<strong>in</strong>ance of <strong>the</strong> same four genera between all stations <strong>and</strong>meiofauna-<strong>in</strong>herent, high small-scale <strong>variability</strong> with<strong>in</strong> <strong>the</strong> stationscreates considerable overlap between most of <strong>the</strong> stations.It is more likely that identification to species level would reveala clearer separation <strong>in</strong> subcommunities, s<strong>in</strong>ce a high degree ofspecies turnover between SO stations was found before (Vermeerenet al., 2004; Fonseca et al., 2006; Ingels et al., 2006; De Meselet al., 2006). The most remarkable <strong>community</strong> composition differenceamong <strong>the</strong> ANDEEP-SYSTCO stations is however <strong>the</strong> <strong>community</strong>at <strong>the</strong> seamount Maud Rise (MR) which differs from all but<strong>the</strong> abyssal south Polar Front (sPF) station. Similarly, <strong>the</strong> compositionof several macrofaunal groups at this station showed aclearly different composition from o<strong>the</strong>r formerly sampled stations<strong>in</strong> <strong>the</strong> deep Weddell Sea (Br<strong>and</strong>t et al., 2011). Moreover,similar to <strong>the</strong> nematode assemblages, <strong>the</strong> composition of polychaetesat this seamount showed highest aff<strong>in</strong>ity to <strong>the</strong> sPF stations(Wilmsen <strong>and</strong> Schüller, 2011). The unique hydrographyregime at <strong>the</strong> seamount MR creates conditions that result <strong>in</strong> a differentfrequency, quantity <strong>and</strong> quality of fresh food compared too<strong>the</strong>r Weddell Sea areas (Abelmann <strong>and</strong> Gersonde, 1991; Wefer<strong>and</strong> Fischer, 1991). However, s<strong>in</strong>ce MR is under <strong>in</strong>fluence fromseasonal sea-ice coverage, result<strong>in</strong>g <strong>in</strong> a lower organic carbon fluxwith a different composition compared to <strong>the</strong> Polar Front region(Wefer <strong>and</strong> Fischer, 1991), <strong>the</strong> ecological conditions that determ<strong>in</strong>e<strong>the</strong> similarity between <strong>the</strong> nematode communities of <strong>the</strong>serelatively distant areas are unknown. The fauna at o<strong>the</strong>r seamounthabitats is, however, apparently often similar to neighbor<strong>in</strong>gareas that fall with<strong>in</strong> organisms’ preferred depth ranges (Clarket al., 2010).The composition of <strong>the</strong> deep-sea nematode assemblages consideredat genus level along <strong>the</strong> ANDEEP-SYSTCO transect is comparablewith deep-sea nematode communities worldwide. Threeout of four genera that dom<strong>in</strong>ate at all ANDEEP-SYSTCO stations(Acantholaimus, Halalaimus, <strong>and</strong> Desmoscolex) are known as dom<strong>in</strong>antgenera (>2% relative abundance) at deep-sea (i.e. slope to hadalzone) areas worldwide (Vanreusel et al., 2010). Our results<strong>the</strong>refore confirm that <strong>the</strong>re is no dist<strong>in</strong>ct Antarctic nematode<strong>community</strong> at genus level (Vanhove et al., 1999, 2004; Sebastianet al., 2007). In <strong>the</strong> study of Vanhove et al. (1999) nematode (generic)structural <strong>and</strong> trophic diversity decreased from <strong>the</strong> shelfbreak <strong>and</strong> upper slope (EG(100) = 40, H 1 = 3.85–3.45) towardsdown slope (EG(100) = 30, H 1 = 2.94). In comparison, <strong>the</strong> LazarevSea (LS) station at a comparable depth as <strong>the</strong> downslope station <strong>in</strong><strong>the</strong> Eastern Weddell Sea, has a higher structural <strong>and</strong> trophic diversity(EG(100) = 39, H 1 = 3.5). The rarefaction <strong>in</strong>dex for <strong>the</strong> LSslope station also agreed well with <strong>the</strong> <strong>in</strong>dex calculated for slopesworldwide (EG(100) = 40; Vanreusel et al., 2010.) Similarly to whatwas found on a worldwide scale, <strong>the</strong> rarefaction <strong>in</strong>dex reducedwhen <strong>the</strong> less diverse abyssal communities were taken <strong>in</strong>to account(EG(100) = 34.5 versus 35.5 <strong>in</strong> Vanreusel et al. (2010)). TheLS station seemed to be <strong>the</strong> area of highest polychaete diversitytoo (Wilmsen <strong>and</strong> Schüller, 2011). Two factors that are generallybelieved to <strong>in</strong>crease diversity at slopes compared to <strong>the</strong> abyss areenhanced food <strong>in</strong>put <strong>and</strong> <strong>the</strong> reduced stability of <strong>the</strong> cont<strong>in</strong>entalslope environment due to <strong>the</strong> higher eventuality of l<strong>and</strong>slides(Wilmsen <strong>and</strong> Schüller, 2011 <strong>and</strong> references <strong>the</strong>re<strong>in</strong>).Epistratum feeders (2A) sensu Wieser (1953) dom<strong>in</strong>ated at moststations (LS, MR, sPF). Vanhove et al. (1995, 1999, 2004) <strong>and</strong> Sebastianet al. (2007) observed a dom<strong>in</strong>ance of epistratum feeders <strong>in</strong>Sou<strong>the</strong>rn Ocean slope <strong>and</strong> abyssal sediments where <strong>the</strong> highest <strong>in</strong>putof organic matter was expected based on highest nematodedensities. They expla<strong>in</strong>ed this as a functional adaptation of nematodecommunities to short-term events of fresh food supply. However,no such l<strong>in</strong>k emerges when our feed<strong>in</strong>g type compositions are
88 K. Guil<strong>in</strong>i et al. / Progress <strong>in</strong> Oceanography 110 (2013) 80–92compared with <strong>the</strong> labile portion of <strong>the</strong> carbon flux at each AN-DEEP-SYSTCO station, calculated by Sachs et al. (2009) (Table 1).4.2. Nematode fatty acid compositionsMost food web studies that <strong>in</strong>vestigate FA compositions of Antarcticmar<strong>in</strong>e organisms focus on plankton (reviewed by Dalsgaardet al. (2003)). Although benthos is <strong>the</strong> richest element <strong>in</strong> <strong>the</strong> mar<strong>in</strong>efood web <strong>in</strong> terms of numbers of species, <strong>the</strong>ir roles <strong>and</strong> <strong>in</strong>teractionsare poorly known (Griffiths, 2010). Würzberg et al.(2011a,b) were <strong>the</strong> first to analyze <strong>the</strong> FA composition of membersof different Antarctic, benthic, polychaete families <strong>and</strong> orders ofperacarid crustaceans, <strong>in</strong> addition to <strong>the</strong>ir potential food sources,<strong>in</strong>clud<strong>in</strong>g sediment, bottom-water POM <strong>and</strong> foram<strong>in</strong>iferans. Thiswas done on samples collected at <strong>the</strong> same ANDEEP-SYSTCO stationsas <strong>the</strong> nematode samples for this study orig<strong>in</strong>ated from.Moreover, <strong>the</strong> analyzed sediments orig<strong>in</strong>ated from pseudo-replicatesamples, i.e. from <strong>the</strong> same multiple corer drops as <strong>the</strong> samplescollected to study <strong>the</strong> nematodes; thus allow<strong>in</strong>g comparison.An <strong>in</strong>dication for selective feed<strong>in</strong>g behavior by nematodes isfound when compar<strong>in</strong>g nematode FA patterns with FA data obta<strong>in</strong>edfor sediment <strong>and</strong> bottom-water POM from <strong>the</strong> stations sPF(2nd visit), cWS, MR <strong>and</strong> LS by Würzberg et al. (2011b). SFA(16:0, 18:0) <strong>and</strong> MUFA (16:1x7, 18:1x9, 18:1x7) dom<strong>in</strong>ated sediment<strong>and</strong> bottom-water POM, while typical <strong>in</strong>dicators of freshplanktonic detritus (PUFA; e.g. 20:5x3, 22:6x3) that occur <strong>in</strong> highproportions <strong>in</strong> nematodes (34–45%), were only detected <strong>in</strong> m<strong>in</strong>orproportions <strong>in</strong> <strong>the</strong> sediment <strong>and</strong> bottom-water POM (9.4–28.7%<strong>and</strong> 9.1–19.2%, respectively, Table 7; Würzberg et al., 2011b). Thehigh portion of PUFAs <strong>in</strong> nematodes confirms that mar<strong>in</strong>e nematodescan be a high quality food source for predators (Leduc,2009). Never<strong>the</strong>less, <strong>the</strong> FA content of nematodes is relativelylow compared to e.g. mar<strong>in</strong>e zooplankton, i.e. m<strong>in</strong>imum <strong>and</strong> maximumdiffer<strong>in</strong>g by one order of magnitude (Lee et al., 2006). Thisgenerally low FA content of <strong>the</strong> nematodes, toge<strong>the</strong>r with <strong>the</strong> predom<strong>in</strong>anceof typical phospholipids of biomembranes (20:5x3,22:6x3 <strong>and</strong> 16:0; Graeve et al., 1997) <strong>in</strong>dicates that <strong>the</strong>y do notaccumulate lipids for energy storage. This is <strong>in</strong> contrast with <strong>the</strong>study of Danovaro et al. (1999) who suggested that energy storageis a survival strategy of deep-sea nematodes based on <strong>the</strong>ir elevatedlipid concentrations compared to coastal nematodes. No <strong>in</strong>crease<strong>in</strong> fatty acid content with depth appears along <strong>the</strong> ANDEEP-SYSTCO transect <strong>and</strong> <strong>the</strong> average fatty acid content <strong>in</strong> <strong>the</strong> Antarcticdeep-sea nematodes is considerably lower than <strong>in</strong> <strong>the</strong> Mediterrane<strong>and</strong>eep-sea nematodes (2% versus 17% of nematode dry weight,respectively). Whe<strong>the</strong>r <strong>the</strong> overall low fatty acid content of nematodes<strong>in</strong> this study is <strong>the</strong> result of low food availability or a constantfeed<strong>in</strong>g behavior throughout <strong>the</strong> year is addressed fur<strong>the</strong>r<strong>in</strong> <strong>the</strong> discussion based on <strong>the</strong> response to <strong>the</strong> seasonal food <strong>in</strong>put.Overall, although FA profiles of polar lipids change with dietarycomposition (Peters et al., 2006), caution has to be taken when<strong>in</strong>terpret<strong>in</strong>g FA patterns of organisms with low lipid reserves. S<strong>in</strong>ceselective <strong>in</strong>gestion of fresh planktonic detritus cannot be dist<strong>in</strong>guishedfrom strong retention of <strong>the</strong>se highly unsaturated FA <strong>in</strong>metabolic processes (Brett <strong>and</strong> Müller-Navarra, 1997) <strong>the</strong>ir proportionscould be enhanced (Würzberg et al., 2011b).A significant difference <strong>in</strong> nematode FA composition between<strong>the</strong> sou<strong>the</strong>rnmost slope station (LS) <strong>and</strong> all o<strong>the</strong>r stations wasfound. Fur<strong>the</strong>rmore, FA proportions of nematodes at <strong>the</strong> seamountMR differed from those at abyssal sPF (2nd visit) <strong>and</strong> PF stations.S<strong>in</strong>ce <strong>the</strong> pattern <strong>in</strong> FA compositions among stations is only weaklycorrelated with <strong>the</strong> pattern <strong>in</strong> nematode <strong>community</strong> compositions,<strong>the</strong> occurrence of dist<strong>in</strong>ct genera or dist<strong>in</strong>ct nematode feed<strong>in</strong>ggroups (sensu Wieser, 1953) alone cannot expla<strong>in</strong> <strong>the</strong> variance <strong>in</strong>FA compositions of <strong>the</strong> communities. We expect that <strong>the</strong> observedvariance <strong>in</strong> FA compositions can ra<strong>the</strong>r be expla<strong>in</strong>ed by <strong>the</strong> comb<strong>in</strong>ationof variance <strong>in</strong> <strong>the</strong> FA composition of available food sources<strong>and</strong> <strong>the</strong> occurrence of dist<strong>in</strong>ct species with species-specific foodpreferences or metabolic characteristics result<strong>in</strong>g <strong>in</strong> different FAcompositions. The <strong>in</strong>terpretation of FA as tracers of different foodsources is, however, complicated by many factors. Hydrodynamicprocesses <strong>in</strong> <strong>the</strong> first place, <strong>in</strong>fluence temperature, light <strong>and</strong> nutrientavailability, three key factors affect<strong>in</strong>g <strong>the</strong> FA pattern of <strong>the</strong> localplanktonic primary producers (Dalsgaard et al., 2003). Waterdepth may also play a role, s<strong>in</strong>ce lipid compositions of plankton<strong>and</strong> detritus can be altered considerably dur<strong>in</strong>g sedimentationFig. 4. Nematode relative abundance (%) <strong>and</strong> total biomass (lg dwt per 10 cm 2 ) per centimeter from <strong>the</strong> south Polar Front station, before (black bars) <strong>and</strong> after (gray bars) <strong>the</strong>bloom settled. The averages <strong>and</strong> st<strong>and</strong>ard deviation of triplicates are plotted.Table 7Relative concentrations of saturated FA (SFA), monounsaturated FA (MUFA) <strong>and</strong> polyunsaturated (PUFA) <strong>in</strong> nematodes, sediment <strong>and</strong> bottom-water POM at <strong>the</strong> different ANDEEP-SYSTCO stations, based on data obta<strong>in</strong>ed <strong>in</strong> this study <strong>and</strong> <strong>the</strong> study of Würzberg et al. (2011b), respectively.PF sPF sPF (2nd visit) cWS MR LSNem Nem Nem Sed POM Nem Sed POM Nem Sed POM Nem Sed POMP SFA 20.8 32.1 25.0 35.1 47.9 21.3 25 58.9 20.6 31.2 62 29.9 30.9 45.4P MUFA 36.1 27.6 29.7 20.2 19 15.3 50.2 15.4 25.4 40.9 15.3 34.7 24.8 28.2P PUFA 43.1 40.4 45.3 11 11.3 34.2
K. Guil<strong>in</strong>i et al. / Progress <strong>in</strong> Oceanography 110 (2013) 80–92 89<strong>and</strong> after deposition due to catabolic processes <strong>and</strong> FA-specific diageneticsusceptibility (Graeve et al., 1997 <strong>and</strong> references <strong>the</strong>re<strong>in</strong>;Camacho-Ibar et al., 2003 <strong>and</strong> references <strong>the</strong>re<strong>in</strong>). In turn, diageneticalteration depends on environmental factors such as watertemperature <strong>and</strong> dissolved oxygen concentration (Camacho-Ibaret al., 2003 <strong>and</strong> references <strong>the</strong>re<strong>in</strong>). The LS station is <strong>the</strong> shalloweststation, located closest to <strong>the</strong> shelf, where strong seasonality of icecoverage<strong>and</strong> of high carbon fluxes are reported (Bathmann et al.,1991; Fischer et al., 2000; Isla et al., 2009). Both sea-ice <strong>and</strong> pelagicblooms are largely composed of diatoms superimposed on a backgroundof Phaeocystis <strong>and</strong> d<strong>in</strong>oflagellates (Dalsgaard et al., 2003<strong>and</strong> references <strong>the</strong>re<strong>in</strong>). Phaeocystis spp. <strong>in</strong> this region are muchless rich <strong>in</strong> x3-PUFA, which toge<strong>the</strong>r with a low 16:1x7/16:0 ratio<strong>and</strong> an elevated concentration of 18:1x9 dist<strong>in</strong>guishes <strong>the</strong>m fromdiatoms (Skerratt et al., 1995). Our results <strong>in</strong>dicate, however, thatboth 20:5x3 <strong>and</strong> 18:1x9 are high <strong>and</strong> <strong>the</strong> ratio of 16:1x7/16:0is low, suggest<strong>in</strong>g a mixed diet <strong>in</strong>clud<strong>in</strong>g both diatoms <strong>and</strong> Phaeocystis,similar to what was found for <strong>the</strong> planktonic copepod Calanoidesacutus <strong>in</strong> <strong>the</strong> Lazarev Sea (Falk-Petersen et al., 1999). Ingeneral, however, it is impossible to say whe<strong>the</strong>r nematodes areprimary or secondary consumers of phytodetritus s<strong>in</strong>ce zooplanktonmay <strong>in</strong>corporate FA markers from phytoplankton unchanged.The occurrence of 20:1x9 <strong>in</strong> nematodes along <strong>the</strong> ANDEEP-SYSTCOtransect might for example po<strong>in</strong>t towards <strong>the</strong> <strong>in</strong>corporation ofremnants of <strong>the</strong> Antarctic pelagic herbivorous copepods (e.g.Calanoides acutus <strong>and</strong> Calanus prop<strong>in</strong>quus) that are known to biosyn<strong>the</strong>sizethis MUFA de novo as storage product, while it is nota common phytoplankton FA (Hagen et al., 1993). Toge<strong>the</strong>r withMetridia gerlachei, both copepod species accounted for >50% of<strong>the</strong> total zooplankton <strong>in</strong> stations along <strong>the</strong> Prime Meridian fromaround 50° southwards (Froneman et al., 2000). Results from severalsediment trap studies <strong>in</strong>dicate that with<strong>in</strong> <strong>the</strong> Marg<strong>in</strong>al IceZone, copepods <strong>and</strong> krill may contribute substantially to totaldownward particle flux (Pakhomov et al., 2002 <strong>and</strong> references<strong>the</strong>re<strong>in</strong>). Never<strong>the</strong>less, it is more generally accepted that outside<strong>the</strong> periods of sedimentation of ice-algae <strong>and</strong> phytoplanktonblooms, <strong>the</strong> s<strong>in</strong>k<strong>in</strong>g fecal material of zooplankton, that often conta<strong>in</strong>shigh concentrations of lipid droplets (Najdek et al., 1994) orundigested phytoplankton cells (Bathmann et al., 1991), largelydom<strong>in</strong>ates <strong>the</strong> downward vertical flux of POC (Pakhomov et al.,2002 <strong>and</strong> references <strong>the</strong>re<strong>in</strong>). This may enable nematodes to feedyear-round as suggested by <strong>the</strong>ir relatively low FA content.What complicates <strong>the</strong> <strong>in</strong>terpretation of FA patterns even more isto what extent typical FA are <strong>in</strong>corporated unmodified <strong>and</strong> <strong>the</strong> species-specificabilities to biosyn<strong>the</strong>size new FA. Knowledge on suchprocesses <strong>in</strong> <strong>the</strong> mar<strong>in</strong>e realm is limited to mostly crustaceous zooplankton<strong>and</strong> fish (e.g. see Dalsgaard et al., 2003 for review), <strong>and</strong> sofar unknown for deep-sea benthic <strong>in</strong>vertebrates. Fur<strong>the</strong>rmore, <strong>the</strong>specificity of some conventional FA markers, as applied <strong>in</strong> this study,can be challenged. The proportion of 20:4x6, for example, is high <strong>in</strong>nematodes at all stations. While it is generally considered to be aphytoplankton derived FA, it was also found <strong>in</strong> macroalgae, bacteria,copepods <strong>and</strong> deep-sea foram<strong>in</strong>iferans (Nichols et al., 1997; Russell<strong>and</strong> Nichols, 1999; Bühr<strong>in</strong>g et al., 2002; Gooday et al., 2002; Suhret al., 2003; Caramujo et al., 2008). S<strong>in</strong>ce it was however detected<strong>in</strong> only very small proportions <strong>in</strong> two typical dom<strong>in</strong>ant herbivorouscopepods <strong>in</strong> <strong>the</strong> SO (Calanoides acutus <strong>and</strong> Metridia gerlachei, max.1.3 ± 0.8%; Albers et al., 1996), <strong>and</strong> <strong>in</strong> considerable proportions <strong>in</strong>foram<strong>in</strong>iferans at <strong>the</strong> ANDEEP-SYSTCO stations (max. 20.5 ± 8.4%;Würzberg et al., 2011a), <strong>the</strong> relatively high proportion found <strong>in</strong> nematodes(max. 13.7 ± 2.8%) might <strong>in</strong>dicate feed<strong>in</strong>g on foram<strong>in</strong>iferans,feed<strong>in</strong>g on <strong>the</strong> food source where foram<strong>in</strong>iferans obta<strong>in</strong> this FA from,or partially by de novo biosyn<strong>the</strong>sis. The latter is feasible s<strong>in</strong>ce <strong>the</strong>presence of D5 <strong>and</strong> D6 desaturase <strong>and</strong> x6 PUFA elongase activity<strong>in</strong> cultured nematodes (Caenorhabditis elegans <strong>and</strong> Panagrellus redivivus)has proven to result <strong>in</strong> de novo biosyn<strong>the</strong>sis of 20:4x6(Watts<strong>and</strong> Browse, 2002; Schlechtriem et al., 2004). Also <strong>the</strong> shallow waterfree-liv<strong>in</strong>g nematode <strong>and</strong> bacterivore Rhabditis (Pellioditis) mediterraneashowed <strong>the</strong> ability to biosyn<strong>the</strong>size 20:3x6 <strong>and</strong> 20:4x6 whilecultured <strong>in</strong> a medium that did not conta<strong>in</strong> <strong>the</strong>se FA (Leduc <strong>and</strong> Probert,2009). Fur<strong>the</strong>rmore, both 20:5x3 <strong>and</strong> 22:6x3 are generally usedas biomarkers for phytoplankton s<strong>in</strong>ce most mar<strong>in</strong>e organisms lack<strong>the</strong> ability to syn<strong>the</strong>size <strong>the</strong>m de novo. Several deep-sea bacteria,however, have shown <strong>the</strong> ability to produce <strong>the</strong>se PUFA (e.g. Russell<strong>and</strong> Nichols, 1999; Nogi et al., 1998a,b; Nogi et al., 2002). Soalthough <strong>the</strong> small portion of conventional bacterial FA markers <strong>in</strong>nematodes along <strong>the</strong> ANDEEP-SYSTCO transect (max 5.7%) suggeststhat bacteria are of m<strong>in</strong>or importance to <strong>the</strong>ir diet, it is necessary todeterm<strong>in</strong>e <strong>the</strong> FA composition of bacteria sampled along <strong>the</strong> transectto validate this statement.4.3. Temporal <strong>variability</strong> at <strong>the</strong> south Polar FrontThe deposition of fresh phytodetritus at <strong>the</strong> abyssal sPF stationwas evidenced by <strong>the</strong> visual presence of a green fluffy layer, aneightfold <strong>in</strong>crease <strong>in</strong> chlorophyll-a content <strong>in</strong> <strong>the</strong> first half centimetersediment layer <strong>and</strong> higher oxygen consumption due to enhancedrespiratory activity <strong>in</strong> <strong>the</strong> top centimeters, 52 days after<strong>the</strong> bloom was observed at <strong>the</strong> sea-surface (Veit-Köhler et al.,2011). In contrast to observations from subtidal North Sea sediments(Vanaverbeke et al., 2004), this event did not <strong>in</strong>duce a rapid<strong>in</strong>crease <strong>in</strong> total nematode densities <strong>and</strong> biomass. Never<strong>the</strong>less,<strong>the</strong> occurrence of <strong>the</strong> genus Leptolaimus solely after <strong>the</strong> bloomhad settled <strong>and</strong> <strong>the</strong> significantly higher relative abundance <strong>in</strong> <strong>the</strong>top centimeter at that time suggests that some changes are tak<strong>in</strong>gplace. Leptolaimus was demonstrated before to be a successfulearly colonizer of disturbed patches, <strong>in</strong>clud<strong>in</strong>g experimental phytodetritusdeposits (Ullberg <strong>and</strong> Ólafsson, 2003; Schratzbergeret al., 2004; Gallucci et al., 2008; Guil<strong>in</strong>i et al., 2011). Its occurrencemight confirm <strong>the</strong> early stage of a succession process that is triggeredby <strong>the</strong> deposition of phytodetritus. Veit-Köhler et al.(2011) speculated that <strong>the</strong> higher relative abundance of meiofauna<strong>in</strong> <strong>the</strong> top centimeter <strong>in</strong>dicates migration toward upper sedimentlayers due to <strong>the</strong> enhanced availability of organic material. If <strong>the</strong>latter is true, <strong>the</strong>n we expect to f<strong>in</strong>d evidence for uptake of freshorganic material <strong>in</strong>, for example, <strong>the</strong> total fatty acid content of<strong>the</strong> nematodes; which we did not f<strong>in</strong>d. Instead, <strong>the</strong> lack of a significant<strong>in</strong>crease <strong>in</strong> relative FA content (% of dry weight) <strong>in</strong> <strong>the</strong> nematodesafter <strong>the</strong> phytoplankton bloom had settled at <strong>the</strong> seafloorfavors <strong>the</strong> idea of a cont<strong>in</strong>uous feed<strong>in</strong>g activity throughout <strong>the</strong>year, which was also formulated by Würzberg et al. (2011a,b) forperacarid crustaceans <strong>and</strong> polychaetes orig<strong>in</strong>at<strong>in</strong>g from <strong>the</strong> sameANDEEP-SYSTCO stations based on <strong>the</strong>ir generally low total FAcontent (1.0–5.1% of <strong>in</strong>dividual dry weight, respectively). The ideathat meiofauna ma<strong>in</strong>ly feeds on degraded material is also supportedby <strong>the</strong> f<strong>in</strong>d<strong>in</strong>gs of Veit-Köhler et al. (2013) who report ononly small differences of carbon stable isotope composition amongsediment <strong>and</strong> meiofauna. The short-term response to <strong>the</strong> settledphytodetritus flux of nematodes <strong>in</strong>habit<strong>in</strong>g <strong>the</strong> sediment surfacelayer might, however, be underestimated consider<strong>in</strong>g a potentialdilution effect when pool<strong>in</strong>g toge<strong>the</strong>r nematodes from 5 cm sedimentprior to <strong>the</strong> FA analysis. Never<strong>the</strong>less, <strong>the</strong> reaction <strong>in</strong> termsof shifts <strong>in</strong> <strong>community</strong> <strong>structure</strong> or redistribution <strong>in</strong> <strong>the</strong> sedimentwas only weak <strong>and</strong> <strong>the</strong>refore po<strong>in</strong>ts to an overall slow responsepossibly expla<strong>in</strong>ed by <strong>the</strong> lack of an urge to feed at times of an excessof relatively fresh, labile, organic matter.5. ConclusionUnravell<strong>in</strong>g <strong>the</strong> feed<strong>in</strong>g ecology of deep-sea nematodes isma<strong>in</strong>ly impeded by <strong>the</strong>ir small size which implies group<strong>in</strong>g a large
90 K. Guil<strong>in</strong>i et al. / Progress <strong>in</strong> Oceanography 110 (2013) 80–92number of <strong>in</strong>dividuals to meet <strong>the</strong> biomass requirements for perform<strong>in</strong>gbiochemical analysis. S<strong>in</strong>ce cultur<strong>in</strong>g deep-sea nematodeshas been unsuccessful until now, FA analyses on species or genuslevel was restricted to communities where a s<strong>in</strong>gle species dom<strong>in</strong>ates(Van Gaever et al., 2009). By comb<strong>in</strong><strong>in</strong>g analyses of <strong>community</strong><strong>structure</strong> with fatty acid content <strong>and</strong> composition of deep-seanematodes <strong>in</strong> bulk, however, some <strong>in</strong>terest<strong>in</strong>g <strong>in</strong>sights <strong>in</strong> <strong>the</strong>irfeed<strong>in</strong>g ecology were ga<strong>in</strong>ed, both on a latitud<strong>in</strong>al <strong>and</strong> a <strong>temporal</strong>scale. Nematode <strong>community</strong> composition was only weaklycorrelated with <strong>the</strong> <strong>community</strong> fatty acid composition, <strong>in</strong>dicat<strong>in</strong>gthat <strong>the</strong> occurrence of dist<strong>in</strong>ct genera or <strong>the</strong> proportion ofnematode feed<strong>in</strong>g types sensu Wieser (1953) alone, cannot expla<strong>in</strong><strong>the</strong> variance <strong>in</strong> FA compositions of <strong>the</strong> communities. Moreover, <strong>the</strong>generally low FA content of nematodes <strong>in</strong>dicates that nematodesdo not have energy reserves <strong>and</strong> suggests that <strong>the</strong>y may feedthroughout <strong>the</strong> year. A year-round forag<strong>in</strong>g activity could alsoexpla<strong>in</strong> <strong>the</strong> recorded lack of food uptake as a short-term responseto <strong>the</strong> recently settled phytodetritus at <strong>the</strong> Polar Front. Never<strong>the</strong>less,<strong>the</strong> higher relative abundance of nematodes <strong>in</strong> <strong>the</strong> topcentimeter layer of <strong>the</strong> sediment <strong>and</strong> <strong>the</strong> occurrence of <strong>the</strong> genusLeptolaimus only after phytodetritus had settled at <strong>the</strong> seafloor,suggests <strong>the</strong> record<strong>in</strong>g of an early stage <strong>in</strong> <strong>the</strong> response to this seasonalevent.The lack of knowledge on <strong>the</strong> abilities of deep-sea nematodes tobiosyn<strong>the</strong>size FA de novo or to bioaccumulate unmodified FAimpedes to conclude which food sources nematodes actually use.Never<strong>the</strong>less, this study may serve as a base for comparison <strong>and</strong>directive for future work. Comparative studies that <strong>in</strong>clude <strong>the</strong>FA analysis on both deep-sea nematodes <strong>and</strong> a spectrum ofpotential food sources have great potential to fur<strong>the</strong>r elucidate<strong>the</strong> deep-sea food web. Moreover, a differentiated analysis on <strong>the</strong>separate feed<strong>in</strong>g groups accord<strong>in</strong>g to Wieser (1953) could help todeterm<strong>in</strong>e whe<strong>the</strong>r this commonly used classification has justified,practical implications for <strong>the</strong> role or functionality of deep-seanematodes.AcknowledgementsWe thank capta<strong>in</strong> Uwe Pahl <strong>and</strong> his crew of RV Polarstern, <strong>the</strong>cruise leader Ulrich Bathmann <strong>and</strong> SYSTCO project leader AngelikaBr<strong>and</strong>t for <strong>the</strong>ir help <strong>and</strong> support dur<strong>in</strong>g <strong>the</strong> ANT XXIV-2expedition. We acknowledge Annika Hellmann who was <strong>in</strong>charge of <strong>the</strong> SYSTCO-logistics <strong>and</strong> <strong>the</strong> multicorer deploymentson board, Marco Bruhn who coord<strong>in</strong>ated sample treatment <strong>and</strong>sorted <strong>the</strong> meiofauna, <strong>and</strong> Kathar<strong>in</strong>a Bruch <strong>and</strong> Daniela Hugowho helped with sample process<strong>in</strong>g. Niels Viaene <strong>and</strong> AnnickVan Kenhove are also greatly acknowledged for <strong>the</strong>ir help withglass slide preparation <strong>and</strong> nematode measurements. We thank<strong>the</strong> Fl<strong>and</strong>ers Mar<strong>in</strong>e Institute (VLIZ), <strong>in</strong> particular Nathalie DeHauwere, for generat<strong>in</strong>g <strong>the</strong> bathymetric maps. The Census ofMar<strong>in</strong>e Life projects CeDAMar <strong>and</strong> CAML as well as Senckenbergam Meer – DZMB are thanked for f<strong>in</strong>ancial <strong>and</strong> logistical supportof <strong>the</strong> SYSTCO-team. This study was realised with <strong>the</strong> f<strong>in</strong>ancialsupport of <strong>the</strong> Research Foundation – Fl<strong>and</strong>ers (FWO, projectnumber 3G0346), <strong>the</strong> Special Research Fund (BOF, The relationbetween FUNction <strong>and</strong> biodiversity of Nematoda <strong>in</strong> <strong>the</strong> DEEPsea(FUNDEEP), project number 01J14909), <strong>the</strong> Belgian SciencePolicy (Belspo, Biodiversity of three representative groups of<strong>the</strong> Antarctic Zoobenthos – Cop<strong>in</strong>g with Change (BIANZO II), researchproject SD/BA/02A), Ghent University (BOF-GOA01GA1911W), <strong>and</strong> <strong>the</strong> Friedrich Wilhelm <strong>and</strong> Elise Marx Foundation.We also thank <strong>the</strong> three anonymous referees for <strong>the</strong>ir detailed<strong>and</strong> constructive feedback. This is ANDEEP-SYSTCOpublication # 176.ReferencesAbdulkadir, S., Tsuchiya, M., 2008. One-step method for quantitative <strong>and</strong> qualitativeanalysis of fatty acids <strong>in</strong> mar<strong>in</strong>e animal samples. Journal of ExperimentalMar<strong>in</strong>e Biology <strong>and</strong> Ecology 354, 1–8.Abelmann, A., Gersonde, R., 1991. Biosiliceous particle flux <strong>in</strong> <strong>the</strong> Sou<strong>the</strong>rn Ocean.Mar<strong>in</strong>e Chemistry 35, 503–536.Albers, C.S., Kattner, G., Hagen, W., 1996. The compositions of wax esters,triacylglycerols <strong>and</strong> phospholipids <strong>in</strong> Arctic <strong>and</strong> Antarctic copepods: evidenceof energetic adaptations. Mar<strong>in</strong>e Chemistry 55, 347–358.Amante, C., Eak<strong>in</strong>s, B.W., 2009. ETOPO1 1 Arc-M<strong>in</strong>ute Global Relief Model:Procedures, Data Sources <strong>and</strong> Analysis. NOAA Technical Memor<strong>and</strong>um NESDISNGDC-24.Anderson, M.J., Rob<strong>in</strong>son, J., 2003. Generalized discrim<strong>in</strong>ant analysis based ondistances. Australian <strong>and</strong> New Zeal<strong>and</strong> Journal of Statistics 45, 301–318.Anderson, M.J., Gorley, R.N., Clarke, K.R., 2008. PERMANOVA+ for PRIMER: Guide toSoftware <strong>and</strong> Statistical Methods. PRIMER-E, Plymouth.Andrassy, I., 1956. The determ<strong>in</strong>ation of volume <strong>and</strong> weight of nematodes. ActaZoologica Academiae Scientiarum Hungaricae 2, 1–15.Arrigo, K.R., van Dijken, G.L., Bush<strong>in</strong>sky, S., http://dx.doi.org/10.1029/2007JC004551, 2008. Primary production <strong>in</strong> <strong>the</strong> Sou<strong>the</strong>rn Ocean, 1997–2006.Journal of Geophysical Research C08004.Bathmann, U., Fischer, G., Müller, P.J., Gerdes, D., 1991. Short-term variations <strong>in</strong>particulate matter sedimentation off Kapp Norvegia, Weddell Sea, Antarctica:relation to water mass advection, ice cover, plankton biomass <strong>and</strong> feed<strong>in</strong>gactivity. Polar Biology 11, 185–195.Bathmann, U.V., Scharek, R., Klaas, C., Dubischar, C.D., Smetacek, V., 1997. Spr<strong>in</strong>gdevelopment of phytoplankton biomass <strong>and</strong> composition <strong>in</strong> major watermasses of <strong>the</strong> Atlantic Sector of <strong>the</strong> Sou<strong>the</strong>rn Ocean. Deep-Sea Research PartII 44, 51–67.Billett, D.S.M., Lampitt, R.S., Rice, A.L., Mantoura, R.F.C., 1983. Seasonalsedimentation of phytoplankton to <strong>the</strong> deep-sea benthos. Nature 302, 520–522.Br<strong>and</strong>t, A., Bathmann, U., Brix, S., Cisewski, B., Flores, H., Göcke, C., Janussen, D.,Krägefsky, S., Kruse, S., Leach, H., L<strong>in</strong>se, K., Pakhomov, E., Peeken, I., Riehl, T.,Sauter, E., Sachs, O., Schüller, M., Schrödl, M., Schwabe, E., Strass, V., vanFraneker, J.A., Wilmsen, E., 2011. Maud Rise – a snapshot through <strong>the</strong> watercolumn. Deep-Sea Research Part II 58 (19–20), 1962–1982.Brett, M.T., Müller-Navarra, D.C., 1997. The role of highly unsaturated fatty acids <strong>in</strong>aquatic food web processes. Freshwater Biology 38, 483–499.Budge, S.M., Iverson, S.J., Koopman, H.N., 2006. Study<strong>in</strong>g trophic ecology <strong>in</strong> mar<strong>in</strong>eecosystems us<strong>in</strong>g fatty acids: a primer analysis <strong>and</strong> <strong>in</strong>terpretation. Mar<strong>in</strong>eMammal Science 22 (4), 759–801.Bühr<strong>in</strong>g, S.I., Koppelmann, R., Christiansen, B., Weikert, H., 2002. Are Rhodophyceaea dietry component for deep-sea holothurians? Journal of <strong>the</strong> Mar<strong>in</strong>e BiologicalAssociation of <strong>the</strong> United K<strong>in</strong>gdom 82 (2), 347–348.Camacho-Ibar, V.F., Aveytua-Alcázar, L., Carriquiry, J.D., 2003. Fatty acid reactivities<strong>in</strong> sediment cores from <strong>the</strong> nor<strong>the</strong>rn Gulf of California. Organic Geochemistry34, 425–439.Caramujo, M.-J., Boschker, H.T.S., Admiraal, W., 2008. Fatty acid profiles of algaemark <strong>the</strong> development <strong>and</strong> composition of harpacticoid copepods. FreshwaterBiology 53, 77–90.Clark, M.R., Rowden, A.A., Schlacher, T., Williams, A., Consalvey, M., Stocks, K.I.,Rogers, A.D., O’Hara, T.D., White, M., Shank, T.M., Hall-Spencer, J.M., 2010. Theecology of seamounts: <strong>structure</strong>, function, <strong>and</strong> human impacts. Annual Reviewof Mar<strong>in</strong>e Science 2, 253–278.Clarke, A., 2008. Antarctic mar<strong>in</strong>e benthic diversity: patterns <strong>and</strong> processes. Journalof Experimental Mar<strong>in</strong>e Biology <strong>and</strong> Ecology 366 (1–2), 48–55.Clarke, A., Arntz, W.E., 2006. An <strong>in</strong>troduction to EASIZ (Ecology of <strong>the</strong> Antarctic SeaIce Zone): an <strong>in</strong>tegrated programme of water column, benthos <strong>and</strong> benthopelagiccoupl<strong>in</strong>g <strong>in</strong> <strong>the</strong> coastal environment of Antarctica. Deep-Sea ResearchPart II 53, 803–814.Clarke, K., Gorley, R.N., 2006. Primer v6: User Manual/Tutorial. PRIMER-E,Plymouth.Clarke, A., Johnston, N.M., 2003. Antarctic mar<strong>in</strong>e benthic diversity. Oceanography<strong>and</strong> Mar<strong>in</strong>e Biology 41, 47–114.Dalsgaard, J., St. John, M., Kattner, G., Müller-Navarra, D., Hagen, W., 2003. Fatty acidtrophic markers <strong>in</strong> <strong>the</strong> pelagic mar<strong>in</strong>e environment. Advances <strong>in</strong> Mar<strong>in</strong>e Biology46, 225–340.Danovaro, R., Dell’Anno, A., Martorano, D., Parodi, P., Marrale, N.D., Fabiano, M.,1999. Seasonal variation <strong>in</strong> <strong>the</strong> biochemical composition of deep-seanematodes: bioenergetic <strong>and</strong> methodological considerations. Mar<strong>in</strong>e EcologyProgress Series 179, 273–283.de Bovée, F., Guidi, L.D., Soyer, J., 1990. Quantitative distribution of deep-seameiobenthos <strong>in</strong> <strong>the</strong> Northwestern Mediterranean (Gulf of Lions). Cont<strong>in</strong>entalShelf Research 10, 1123–1145.De Mesel, I., Lee, H.J., Vanhove, S., V<strong>in</strong>cx, M., Vanreusel, A., 2006. Species diversity<strong>and</strong> distribution with<strong>in</strong> <strong>the</strong> deep-sea nematode genus Acantholaimus on <strong>the</strong>cont<strong>in</strong>ental shelf <strong>and</strong> slope <strong>in</strong> Antarctica. Polar Biology 29, 860–871.Desvilettes, C.H., Bourdier, G., Amblard, C.H., Barth, B., 1997. Use of fatty acids for<strong>the</strong> assessment of zooplankton graz<strong>in</strong>g on bacteria, protozoans <strong>and</strong> microalgae.Freshwater Biology 38, 629–637.Drazen, J.C., Baldw<strong>in</strong>, R.J., Smith, K.L., 1998. Sediment <strong>community</strong> response to a<strong>temporal</strong>ly vary<strong>in</strong>g food supply at an abyssal station <strong>in</strong> <strong>the</strong> NE pacific. Deep-SeaResearch Part II 45, 893–913.
K. Guil<strong>in</strong>i et al. / Progress <strong>in</strong> Oceanography 110 (2013) 80–92 91Eder, K., 1995. Gas chromatographic analysis of fatty acid methyl esters. Journal ofChromatographic Science 671, 113–131.Falk-Petersen, S., Sargent, J.R., Jørgen Lønne, O., Timofeev, S., 1999. Functionalbiodiversity of lipids <strong>in</strong> Antarctic zooplankton: Calanoides acutus, Calanusprop<strong>in</strong>quus, Thysanoessa macrura <strong>and</strong> Euphausia crystallorophias. Polar Biology31, 37–47.Fischer, G., Ratmeyer, V., Wefer, G., 2000. Organic carbon fluxes <strong>in</strong> <strong>the</strong> Atlantic <strong>and</strong><strong>the</strong> Sou<strong>the</strong>rn Ocean: relationship to primary production compiled from satelliteradiometer data. Deep-Sea Research Part II 47, 1961–1997.Fonseca, G., Vanreusel, A., Decraemer, W., 2006. Taxonomy <strong>and</strong> biogeography ofMolgolaimus Ditlevsen, 1921 (Nematoda: Chromadoria) with reference to <strong>the</strong>orig<strong>in</strong>s of deep-sea nematodes. Antarctic Science 18, 23–50.Froneman, P.W., Pakhomov, E.A., Periss<strong>in</strong>otto, R., McQuaid, C.D., 2000. Zooplankton<strong>structure</strong> <strong>and</strong> graz<strong>in</strong>g <strong>in</strong> <strong>the</strong> Atlantic sector of <strong>the</strong> Sou<strong>the</strong>rn Ocean <strong>in</strong> lateraustral summer 1993. Part 2. Biochemical zonation. Deep-Sea Research Part I47, 1687–1702.Galéron, J., Sibuet, M., Vanreusel, A., Mackenzie, K., Gooday, A.J., D<strong>in</strong>et, A., Wolff,G.A., 2001. Temporal patterns among meiofauna <strong>and</strong> macrofauna taxa related tochanges <strong>in</strong> sediment geochemistry at an abyssal NE Atlantic site. Progress <strong>in</strong>Oceanography 50, 303–324.Gallucci, F., Moens, T., Vanreusel, A., Fonseca, G., 2008. Active colonisation ofdisturbed sediments by deep-sea nematodes: evidence for <strong>the</strong> patch mosaicmodel. Mar<strong>in</strong>e Ecology Progress Series 367, 173–183.Giere, O., 2009. Meiobenthology: The Microscopic Motile Fauna of AquaticSediments. Spr<strong>in</strong>ger-Verlag, Berl<strong>in</strong>, Heidelberg.Gooday, A.J., 1988. A response by benthic Foram<strong>in</strong>ifera to <strong>the</strong> deposition ofphytodetritus <strong>in</strong> <strong>the</strong> deep sea. Nature 332, 70–73.Gooday, A.J., Pfannkuche, O., Lambshead, P.J.D., 1996. An apparent lack of responseby metazoan meiofauna to phytodetritus deposition <strong>in</strong> <strong>the</strong> bathyal North-Eastern Atlantic. Journal of <strong>the</strong> Mar<strong>in</strong>e Biological Association of <strong>the</strong> UnitedK<strong>in</strong>gdom 76, 297–310.Gooday, A.J., Pond, D.W., Bowser, S.S., 2002. Ecology <strong>and</strong> nutrition of <strong>the</strong> largeagglut<strong>in</strong>ated foram<strong>in</strong>iferan Bathysiphon capillare <strong>in</strong> <strong>the</strong> bathyal NE Atlantic:distribution with<strong>in</strong> <strong>the</strong> sediment profile <strong>and</strong> lipid biomarker composition.Mar<strong>in</strong>e Ecology Progress Series 245, 69–82.Graeve, M., Kattner, G., Piepenburg, D., 1997. Lipids <strong>in</strong> Arctic benthos: does <strong>the</strong> fattyacid <strong>and</strong> alcohol composition reflect feed<strong>in</strong>g <strong>and</strong> trophic <strong>in</strong>teractions? PolarBiology 18, 53–61.Graf, G., 1992. Benthic–pelagic coupl<strong>in</strong>g: a benthic view. Oceanography <strong>and</strong> Mar<strong>in</strong>eBiology 30, 149–190.Grebmeier, J.M., Barry, J., 1991. The <strong>in</strong>fluence of oceanographic processes onpelagic–benthic coupl<strong>in</strong>g <strong>in</strong> polar regions: a benthic perspective. Journal ofMar<strong>in</strong>e Systems 2, 495–518.Griffiths, H.J., 2010. Antarctic mar<strong>in</strong>e biodiversity – what do we know about <strong>the</strong>distribution of life <strong>in</strong> <strong>the</strong> Sou<strong>the</strong>rn Ocean? PLoS ONE 5 (8), e11683.Guckert, J.B., Antworth, C.P., Nichols, P.D., White, D.C., 1985. Phospholipid, esterl<strong>in</strong>kedfatty acid profiles as reproducible assays for changes <strong>in</strong> prokaryotic<strong>community</strong> <strong>structure</strong> of estuar<strong>in</strong>e sediments. FEMS Microbiology Ecology 31,147–158.Guil<strong>in</strong>i, K., van Oevelen, D., Soetaert, K., Middelburg, J.J., Vanreusel, A., 2010.Nutritional importance of benthic bacteria for deep-sea nematodes from <strong>the</strong>Arctic ice marg<strong>in</strong>: results of an isotope tracer experiment. Limnology <strong>and</strong>Oceanography 55 (5), 1977–1989.Guil<strong>in</strong>i, K., Soltwedel, T., van Oevelen, D., Vanreusel, A., 2011. Deep-sea nematodesactively colonise sediments, irrespective of <strong>the</strong> presence of a pulse of organicmatter: results from an <strong>in</strong> situ experiment. PLoS ONE 6 (4), e18912.Gurr, M.P., Harwood, J.L., 1991. Lipid Biochemistry. An Introduction, fourth ed.Chapman <strong>and</strong> Hall, London.Gutzmann, E., Martínez Arbizu, P., Rose, A., Veit-Köhler, G., 2004. Meiofaunacommunities along an abyssal depth gradient <strong>in</strong> <strong>the</strong> Drake Passage. Deep-SeaResearch Part II 51, 1617–1628.Hagen, W., Kattner, G., Greave, M., 1993. Calanoides acutus <strong>and</strong> Calanus prop<strong>in</strong>quus,Antarctic copepods with different lipid storage modes via wax esters ortriacylglycerols. Mar<strong>in</strong>e Ecology Progress Series 97, 135–142.Heip, C., V<strong>in</strong>cx, M., Vranken, G., 1985. The ecology of mar<strong>in</strong>e nematodes.Oceanography <strong>and</strong> Mar<strong>in</strong>e Biology 23, 399–489.Heip, C., Herman, P., Soetaert, K., 1988. Data process<strong>in</strong>g, evaluation, <strong>and</strong> analysis. In:Higg<strong>in</strong>s, R.P., Thiel, H. (Eds.), Introduction to <strong>the</strong> Study of Meiofauna.Smithsonsian Institution Press, Wash<strong>in</strong>gton, pp. 197–232.Heip, C., Herman, P., Soetaert, K., 1998. Indices of diversity <strong>and</strong> evenness. Oceanis24, 61–87.Herman, R.L., Dahms, H.U., 1992. Meiofauna communities along a depth transect offHalley Bay (Weddell Sea – Antarctica). Polar Biology 12, 313–320.Herrmann, S., Bathmann, U., 2010. Plankton parameters: chlorophyll a, particulateorganic carbon, biological silica. In: Bathmann, U. (Ed.), The Expedition of <strong>the</strong>Research Vessel ‘‘Polarstern’’ to <strong>the</strong> Antarctic <strong>in</strong> 2007/2008 (ANT-XXIV/2).Berichte zur Polar- und Meeresforschung, vol. 604, pp. 21–22.Higg<strong>in</strong>s, R.P., Thiel, H. (Eds.), 1988. Introduction to <strong>the</strong> Study of Meiofauna.Smithsonian Institution Press, Wash<strong>in</strong>gton, DC, London.Hill, M.O., 1973. Diversity <strong>and</strong> evenness: a unify<strong>in</strong>g notation <strong>and</strong> its consequences.Ecology 54, 427–432.Hurlbert, S.H., 1971. The nonconcept of species diversity: a critique <strong>and</strong> alternativeparameters. Ecology 52 (4), 577–586.Hurlbert, S.H., 1984. Pseudoreplication <strong>and</strong> <strong>the</strong> design of ecological fieldexperiments. Ecological Monographs 54 (2), 187–211.Ingels, J., Vanhove, S., De Mesel, I., Vanreusel, A., 2006. The biodiversity <strong>and</strong>biogeography of <strong>the</strong> free-liv<strong>in</strong>g nematode genera Desmodora <strong>and</strong> Desmodorella(family Desmodoridae) at both sides of <strong>the</strong> Scotia Arc. Polar Biology 29, 936–949.Isla, E., Gerdes, D., Palanques, A., Gili, J.-M., Arntz, W.E., König-Langlo, G., 2009.Downward particle fluxes, w<strong>in</strong>d <strong>and</strong> a phytoplankton bloom over a polarcont<strong>in</strong>ental shelf: a stormy impulse for <strong>the</strong> biological pump. Mar<strong>in</strong>e Geology259, 59–72.Kelly, J.R., Scheibl<strong>in</strong>g, R.E., 2012. Fatty acids as dietary tracers <strong>in</strong> benthic food webs.Mar<strong>in</strong>e Ecology Progress Series 446, 1–22.Leduc, D., 2009. Description of Oncholaimus moanae sp. nov. (Nematoda:Oncholaimidae), with notes on feed<strong>in</strong>g ecology based on isotopic <strong>and</strong> fattyacid composition. Journal of <strong>the</strong> Mar<strong>in</strong>e Biological Association of <strong>the</strong> UnitedK<strong>in</strong>gdom 89 (2), 337–344.Leduc, D., Probert, P.K., 2009. The effect of bacterivorous nematodes on detritus<strong>in</strong>corporation by macrofaunal detritivores: a study us<strong>in</strong>g stable isotope <strong>and</strong>fatty acid analyses. Journal of Experimental Mar<strong>in</strong>e Biology <strong>and</strong> Ecology 371,130–139.Lee, R.F., Hagen, W., Kattner, G., 2006. Lipid storage <strong>in</strong> mar<strong>in</strong>e zooplankton. Mar<strong>in</strong>eEcology Progress Series 307, 273–306.McIntyre, A.D., Warwick, R.M., 1984. Meiofauna techniques. In: Holme, N.A.,McIntyre, A.D. (Eds.), Methods for <strong>the</strong> Study of Mar<strong>in</strong>e Benthos, second ed.Blackwell, pp. 217–244.Mitchell, L., Harvey, S.M., Gage, J.D., Fallick, A.E., 1997. Organic carbon dynamics <strong>in</strong>shelf edge sediments off <strong>the</strong> Hebrides: a seasonal perspective. InternationaleRevue der Gesamten Hydrobiologie 82, 425–435.Mokievskii, V.O., Udalov, A.A., Azovskii, A.I., 2007. Quantitative distribution ofmeiobenthos <strong>in</strong> deep-water zones of <strong>the</strong> World Ocean. Oceanology 47 (6), 797–813.Najdek, M., Puskaric, S., Bochdansky, A.B., 1994. Contribution of zooplankton lipidsto <strong>the</strong> flux of <strong>the</strong> organic matter <strong>in</strong> <strong>the</strong> nor<strong>the</strong>rn Adriatic Sea. Mar<strong>in</strong>e EcologyProgress Series 111, 241–249.Nichols, D.S., Brown, J.L., Nichols, P.D., McMeek<strong>in</strong>, T.A., 1997. Production ofeicosapentaenoic <strong>and</strong> arachidonic acids by an Antarctic bacterium: responseto growth temperature. FEMS Microbiology Letters 152 (2), 349–354.Nogi, Y., Kato, C., Horikoshi, K., 1998a. Moritella japonica sp. nov., a novel barophilicbacterium isolated from a Japan Trench sediment. Journal of General <strong>and</strong>Applied Microbiology 44, 289–295.Nogi, Y., Masui, N., Kato, C., 1998b. Photobacterium profundum sp. nov., a new,moderately barophilic bacterial species isolated from a deep-sea sediment.Extremophiles 2, 1–7.Nogi, Y., Kato, C., Horikoshi, K., 2002. Psychromonas kaikoae sp. nov., a novelpiezophilic bacterium from <strong>the</strong> deepest cold-seep sediments <strong>in</strong> <strong>the</strong> JapanTrench. International Journal of Systematic <strong>and</strong> Evolutionary Microbiology 52,1527–1532.Orsi, A.H., Whitworth III, T., Nowl<strong>in</strong> Jr., W.D., 1995. On <strong>the</strong> meridional extent <strong>and</strong>fronts of <strong>the</strong> Antarctic Circumpolar Current. Deep-Sea Research Part I 42 (5),641–673.Pakhomov, E.A., Froneman, P.W., Wassmann, P., Ratkova, T., Arashkevich, E., 2002.Contribution of algal s<strong>in</strong>k<strong>in</strong>g <strong>and</strong> zooplankton graz<strong>in</strong>g to downward flux <strong>in</strong> <strong>the</strong>Lazarev Sea (Sou<strong>the</strong>rn Ocean) dur<strong>in</strong>g <strong>the</strong> onset of phytoplankton bloom: alagrangian study. Mar<strong>in</strong>e Ecology Progress Series 233, 73–88.Peters, J., Renz, J., van Beusekom, J., Boersma, M., Hagen, W., 2006. Trophodynamics<strong>and</strong> seasonal cycle of <strong>the</strong> copepod Pseudocalanus acuspes <strong>in</strong> <strong>the</strong> Central BalticSea (Bornholm Bas<strong>in</strong>): evidence from lipid composition. Mar<strong>in</strong>e Biology 149,1417–1429.Pfannkuche, O., 1993. Benthic response to <strong>the</strong> sedimentation of particulate organicmatter at <strong>the</strong> BIOTRANS station, 47°N, 20°W. Deep-Sea Research Part II 40, 135–149.Rex, M.A., Etter, R.J., Morris, J.S., Crouse, J., McCla<strong>in</strong>, C.R., Johnson, N.A., Stuart, C.T.,Dem<strong>in</strong>g, J.W., Thies, R., Avery, R., 2006. Global bathymetric patterns of st<strong>and</strong><strong>in</strong>gstock <strong>and</strong> body size <strong>in</strong> <strong>the</strong> deep-sea benthos. Mar<strong>in</strong>e Ecology Progress Series317, 1–8.Russell, N.J., Nichols, D.S., 1999. Polyunsaturated fatty acids <strong>in</strong> mar<strong>in</strong>e bacteria – adogma rewritten. Microbiology 145, 767–779.Sachs, O., Sauter, E.J., Schlüter, M., Rutgers van der Loeff, M.M., Jerosch, K., Holby, O.,2009. Benthic organic carbon flux <strong>and</strong> oxygen penetration reflect differentplankton prov<strong>in</strong>ces <strong>in</strong> <strong>the</strong> Sou<strong>the</strong>rn Ocean. Deep-Sea Research Part I 56, 1319–1335.Schlechtriem, C., Tocher, D.R., Dick, J.R., Becker, K., 2004. Incorporation <strong>and</strong>metabolism of fatty acids by desaturation <strong>and</strong> elongation <strong>in</strong> <strong>the</strong> nematode,Panagrellus redivivus. Nematology 6, 783–795.Schratzberger, M., Whomersley, P., Warr, K., Bolam, S.G., Rees, H.L., 2004.Colonisation of various types of sediment by estuar<strong>in</strong>e nematodes via lateral<strong>in</strong>faunal migration: a laboratory study. Mar<strong>in</strong>e Biology 145, 69–78.Sebastian, S., Raes, M., De Mesel, I., Vanreusel, A., 2007. Comparison of <strong>the</strong> nematodefauna from <strong>the</strong> Weddell Sea Abyssal Pla<strong>in</strong> with two North Atlantic abyssal sites.Deep-Sea Research Part II 54, 1727–1736.Se<strong>in</strong>horst, J.W., 1959. A rapid method for <strong>the</strong> transfer of nematodes from fixative toanhydrous glycer<strong>in</strong>e. Nematologica 4, 67–69.Skerratt, J.H., Nichols, P.D., McMeek<strong>in</strong>, T.A., Burton, H., 1995. Seasonal <strong>and</strong> <strong>in</strong>terannualchanges <strong>in</strong> planktonic biomass <strong>and</strong> <strong>community</strong> <strong>structure</strong> <strong>in</strong> easternAntarctica us<strong>in</strong>g signature lipids. Mar<strong>in</strong>e Chemistry 51, 93–113.Soetaert, K., Herman, P.M.J., Middelburg, J.J., 1996. Dynamic response of deep-seasediments to seasonal variations: a model. Limnology <strong>and</strong> Oceanography 41,1651–1668.
92 K. Guil<strong>in</strong>i et al. / Progress <strong>in</strong> Oceanography 110 (2013) 80–92Soetaert, K., Franco, M., Lampadariou, N., Muthumbi, A., Steyaert, M., V<strong>and</strong>epitte, L.,v<strong>and</strong>en Berge, E., Vanaverbeke, J., 2009. Factors affect<strong>in</strong>g nematode biomass,length <strong>and</strong> width from <strong>the</strong> shelf to <strong>the</strong> deep sea. Mar<strong>in</strong>e Ecology Progress Series392, 123–132.Soltwedel, T., 1997. Temporal variabilities <strong>in</strong> benthic activity <strong>and</strong> biomass on<strong>the</strong> western European cont<strong>in</strong>ental marg<strong>in</strong>. Oceanologica Acta 20, 871–879.Soltwedel, T., 2000. Metazoan meiobenthos along cont<strong>in</strong>ental marg<strong>in</strong>s: a review.Progress <strong>in</strong> Oceanography 46, 59–84.Soltwedel, T., Pfannkuche, O., Thiel, H., 1996. The size <strong>structure</strong> of deep-seameiobenthos <strong>in</strong> <strong>the</strong> North-eastern Atlantic: nematode size spectra <strong>in</strong> relation toenvironmental variables. Journal of <strong>the</strong> Mar<strong>in</strong>e Biological Association of <strong>the</strong>United K<strong>in</strong>gdom 76, 327–344.Suhr, S.B., Pond, D.W., Gooday, A.J., Smith, C.R., 2003. Selective feed<strong>in</strong>g by benthicforam<strong>in</strong>ifera on phytodetritus on <strong>the</strong> western Antarctic Pen<strong>in</strong>sula shelf:evidence from fatty acid biomarker analyses. Mar<strong>in</strong>e Ecology Progress Series262, 153–162.Tabachnick, B.G., Fidell, L.S., 1989. Us<strong>in</strong>g Multivariate Statistics. Harper Coll<strong>in</strong>sPublishers, New York, NY.Ullberg, J., Ólafsson, E., 2003. Effects of biological disturbance by Monoporeia aff<strong>in</strong>is(Amphipoda) on small-scale migration of mar<strong>in</strong>e nematodes <strong>in</strong> low-energy softsediments. Mar<strong>in</strong>e Biology 143, 867–874.Van Gaever, S., Moodley, L., Pasotti, F., Houtekamer, M., Middelburg, J.J., Danovaro,R., Vanreusel, A., 2009. Trophic specialisation of metazoan meiofauna at <strong>the</strong>Håkon Mosby Mud Volcano: fatty acid biomarker isotope evidence. Mar<strong>in</strong>eBiology 156, 1289–1296.Vanaverbeke, J., Soetaert, K., V<strong>in</strong>cx, M., 2004. Changes <strong>in</strong> morphometriccharcteristics of nematode communities dur<strong>in</strong>g a spr<strong>in</strong>g phytoplankton bloomdeposition. Mar<strong>in</strong>e Ecology Progress Series 273, 139–146.Vanhove, S., Wittoeck, J., Desmet, G., Van den Berghe, B., Herman, R.L., Bak, R.P.M.,Nieuwl<strong>and</strong>, G., Vosjan, J.H., Boldr<strong>in</strong>, A., Rabitti, S., V<strong>in</strong>cx, M., 1995. Deep-seameiofauna communities <strong>in</strong> Antarctica: structural analysis <strong>and</strong> relation with <strong>the</strong>environment. Mar<strong>in</strong>e Ecology Progress Series 127, 65–76.Vanhove, S., Arntz, W., V<strong>in</strong>cx, M., 1999. Comparative study of <strong>the</strong> nematodecommunities on <strong>the</strong> sou<strong>the</strong>astern Weddell Sea shelf <strong>and</strong> slope (Antarctica).Mar<strong>in</strong>e Ecology Progress Series 181, 237–256.Vanhove, S., Vermeeren, H., Vanreusel, A., 2004. Meiofauna towards <strong>the</strong> SouthS<strong>and</strong>wich Trench (750–6300 m), focus on nematodes. Deep-Sea Research Part II51, 1665–1687.Vanreusel, A., V<strong>in</strong>cx, M., Bett, B.J., Rice, A.L., 1995. Nematode biomass spectra at twoabyssal sites <strong>in</strong> <strong>the</strong> NE Atlantic with contrast<strong>in</strong>g food supply. InternationaleRevue der Gesamten Hydrobiologie 80 (2), 287–296.Vanreusel, A., Fonseca, G., Danovaro, R., da Silva, M.C., Esteves, A.M., Ferrer, T., Gad,G., Galtsova, V., Gambi, C., Genevois, V., Ingels, J., Ingole, B., Lampadariou, N.,Merckx, B., Miljut<strong>in</strong>, D.M., Miljut<strong>in</strong>a, M.M., Muthumbi, A., Netto, S., Portnova, D.,Radziejewska, T., Raes, M., Tchesunov, A., Vanaverbeke, J., Van Gaever, S.,Venekey, V., Bezerra, T., Fl<strong>in</strong>t, H., Copley, J., Pape, E., Zeppeli, D., Mart<strong>in</strong>ez, P.,Galéron, J., 2010. The contribution of deep-sea macrohabitat heterogeneity toglobal nematode diversity. Mar<strong>in</strong>e Ecology 31, 6–20.Veit-Köhler, G., Guil<strong>in</strong>i, K., Peeken, I., Sachs, O., Sauter, E.J., Würzberg, L., 2011.Antarctic deep-sea meiofauna <strong>and</strong> bacteria react to <strong>the</strong> deposition of particulateorganic matter after a phytoplankton bloom. Deep-Sea Research Part II 58,1983–1995.Veit-Köhler, G., Guil<strong>in</strong>i, K., Peeken, I., Quillfeldt, P., Mayr, C., 2013. Carbon <strong>and</strong>nitrogen stable isotope signatures of deep-sea meiofauna followoceanographical gradients across <strong>the</strong> Sou<strong>the</strong>rn Ocean. Progress <strong>in</strong>Oceanography 110, 69–79.Vermeeren, H., Vanreusel, A., Vanhove, S., 2004. Species distribution with<strong>in</strong> <strong>the</strong> freeliv<strong>in</strong>gmar<strong>in</strong>e nematode genus Dichromadora <strong>in</strong> <strong>the</strong> Weddell Sea <strong>and</strong> adjacentareas. Deep-Sea Research Part II 51, 1643–1664.Watts, J.L., Browse, J., 2002. Genetic dissection of polyunsaturated fatty acidsyn<strong>the</strong>sis <strong>in</strong> Caenorhabditis elegans. Proceed<strong>in</strong>gs of <strong>the</strong> National Academy ofSciences (USA) 99 (9), 5854–5859.Wefer, G., Fischer, G., 1991. Annual primary production <strong>and</strong> export flux <strong>in</strong> <strong>the</strong>Sou<strong>the</strong>rn Ocean from sediment trap data. Mar<strong>in</strong>e Chemistry 35 (1–4), 597–613.Wei, C.-L., Rowe, G.T., Escobar-Briones, E., Boetius, A., Soltwedel, T., Caley, M.J.,Soliman, Y., Huettmann, F., Qu, F., Yu, Z., Pitcher, C.R., Haedrich, R.L., Wicksten,M.K., Rex, M.A., Baguley, J.G., Sharma, J., Danovaro, R., MacDonald, I.R., Nunnally,C.C., Dem<strong>in</strong>g, J.W., Montagna, P., Lévesque, M., Weslawski, J.M., Wlodarska-Kowalczuk, M., Ingole, B.S., Bett, B.J., Billett, D.S.M., Yool, A., Bluhm, B.A., Iken, K.,Narayanaswamy, B.E., 2010. Global patterns <strong>and</strong> predictions of seafloor biomassus<strong>in</strong>g r<strong>and</strong>om forests. PloS ONE 5 (12), e15323.Wieser, W., 1953. Die Beziehung zwischen Mundhöhlengestalt, Ernährungsweiseund Vorkommen bei freilebenden mar<strong>in</strong>en Nematoden. E<strong>in</strong>e ökologischemorphologischeStudie. Arkiv Fur Zoologi 4, 439–483.Wilmsen, E., Schüller, M., 2011. Diversity <strong>and</strong> distribution of Polychaeta <strong>in</strong> deepAntarctic <strong>and</strong> Subantarctic waters along <strong>the</strong> Greenwich meridian. Deep-SeaResearch Part II 58, 2004–2012.Würzberg, L., Peters, J., Br<strong>and</strong>t, A., 2011a. Fatty acid patterns of Sou<strong>the</strong>rn Oceanshelf <strong>and</strong> deep sea peracarid crustaceans <strong>and</strong> a possible food source,foram<strong>in</strong>iferans. Deep-Sea Research Part II 58, 2027–2035.Würzberg, L., Peters, J., Schüller, M., Br<strong>and</strong>t, A., 2011b. Diet <strong>in</strong>sights of deep-seapolychaetes derived from fatty acid analyses. Deep-Sea Research Part II 58,153–162.


