Latitudinal and temporal variability in the community structure and ...
Latitudinal and temporal variability in the community structure and ...
Latitudinal and temporal variability in the community structure and ...
You also want an ePaper? Increase the reach of your titles
YUMPU automatically turns print PDFs into web optimized ePapers that Google loves.
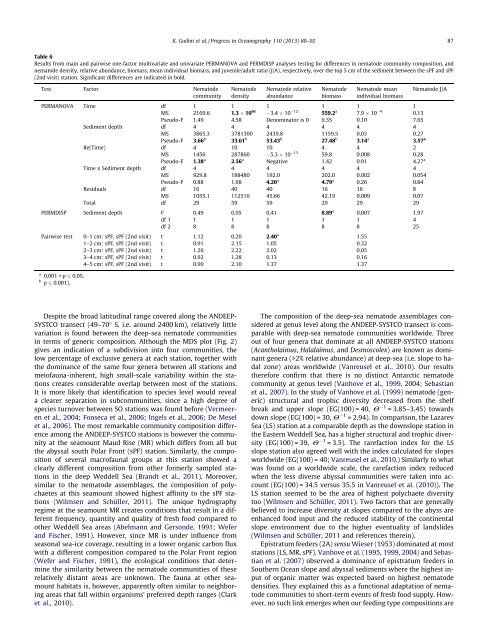
K. Guil<strong>in</strong>i et al. / Progress <strong>in</strong> Oceanography 110 (2013) 80–92 87Table 6Results from ma<strong>in</strong> <strong>and</strong> pairwise one-factor multivariate <strong>and</strong> univariate PERMANOVA <strong>and</strong> PERMDISP analyses test<strong>in</strong>g for differences <strong>in</strong> nematode <strong>community</strong> composition, <strong>and</strong>nematode density, relative abundance, biomass, mean <strong>in</strong>dividual biomass, <strong>and</strong> juvenile/adult ratio (J/A), respectively, over <strong>the</strong> top 5 cm of <strong>the</strong> sediment between <strong>the</strong> sPF <strong>and</strong> sPF(2nd visit) station. Significant differences are <strong>in</strong>dicated <strong>in</strong> bold.Test Factor Nematode<strong>community</strong>NematodedensityNematode relativeabundanceNematodebiomassNematode mean<strong>in</strong>dividual biomassPERMANOVA Time df 1 1 1 1 1 1MS 2169.6 1.3 10 6b 3.4 10 12 559.2 a 7.9 10 4 0.13Pseudo-F 1.49 4.58 Denom<strong>in</strong>ator is 0 9.35 0.10 7.65Sediment depth df 4 4 4 4 4 4MS 3865.3 3781300 2439.8 1159.5 0.03 0.27Pseudo-F 3.66 b 33.61 b 53.43 b 27.48 b 3.14 a 3.57 aRe(Time) df 4 10 10 4 4 2MS 1456 287860 5.3 10 13 59.8 0.008 0.28Pseudo-F 1.38 a 2.56 a Negative 1.42 0.91 4.27 aTime x Sediment depth df 4 4 4 4 4 4MS 929.8 188480 192.0 202.0 0.002 0.054Pseudo-F 0.88 1.68 4.20 a 4.79 a 0.26 0.84Residuals df 16 40 40 16 16 8MS 1055.1 112510 45.66 42.19 0.009 0.07Total df 29 59 59 29 29 29PERMDISP Sediment depth F 0.49 0.05 0.41 8.89 a 0.007 1.97df 1 1 1 1 1 1 4df 2 8 8 8 8 8 25Pairwise test 0–1 cm: sPF, sPF (2nd visit) t 1.12 0.20 2.40 a 1.551–2 cm: sPF, sPF (2nd visit) t 0.91 2.15 1.05 0.322–3 cm: sPF, sPF (2nd visit) t 1.26 2.22 2.02 0.053–4 cm: sPF, sPF (2nd visit) t 0.92 1.28 0.13 0.164–5 cm: sPF, sPF (2nd visit) t 0.90 2.10 1.37 1.37a 0.001 < p 6 0.05.b p 6 0.001).Nematode J/ADespite <strong>the</strong> broad latitud<strong>in</strong>al range covered along <strong>the</strong> ANDEEP-SYSTCO transect (49–70° S, i.e. around 2400 km), relatively littlevariation is found between <strong>the</strong> deep-sea nematode communities<strong>in</strong> terms of generic composition. Although <strong>the</strong> MDS plot (Fig. 2)gives an <strong>in</strong>dication of a subdivision <strong>in</strong>to four communities, <strong>the</strong>low percentage of exclusive genera at each station, toge<strong>the</strong>r with<strong>the</strong> dom<strong>in</strong>ance of <strong>the</strong> same four genera between all stations <strong>and</strong>meiofauna-<strong>in</strong>herent, high small-scale <strong>variability</strong> with<strong>in</strong> <strong>the</strong> stationscreates considerable overlap between most of <strong>the</strong> stations.It is more likely that identification to species level would reveala clearer separation <strong>in</strong> subcommunities, s<strong>in</strong>ce a high degree ofspecies turnover between SO stations was found before (Vermeerenet al., 2004; Fonseca et al., 2006; Ingels et al., 2006; De Meselet al., 2006). The most remarkable <strong>community</strong> composition differenceamong <strong>the</strong> ANDEEP-SYSTCO stations is however <strong>the</strong> <strong>community</strong>at <strong>the</strong> seamount Maud Rise (MR) which differs from all but<strong>the</strong> abyssal south Polar Front (sPF) station. Similarly, <strong>the</strong> compositionof several macrofaunal groups at this station showed aclearly different composition from o<strong>the</strong>r formerly sampled stations<strong>in</strong> <strong>the</strong> deep Weddell Sea (Br<strong>and</strong>t et al., 2011). Moreover,similar to <strong>the</strong> nematode assemblages, <strong>the</strong> composition of polychaetesat this seamount showed highest aff<strong>in</strong>ity to <strong>the</strong> sPF stations(Wilmsen <strong>and</strong> Schüller, 2011). The unique hydrographyregime at <strong>the</strong> seamount MR creates conditions that result <strong>in</strong> a differentfrequency, quantity <strong>and</strong> quality of fresh food compared too<strong>the</strong>r Weddell Sea areas (Abelmann <strong>and</strong> Gersonde, 1991; Wefer<strong>and</strong> Fischer, 1991). However, s<strong>in</strong>ce MR is under <strong>in</strong>fluence fromseasonal sea-ice coverage, result<strong>in</strong>g <strong>in</strong> a lower organic carbon fluxwith a different composition compared to <strong>the</strong> Polar Front region(Wefer <strong>and</strong> Fischer, 1991), <strong>the</strong> ecological conditions that determ<strong>in</strong>e<strong>the</strong> similarity between <strong>the</strong> nematode communities of <strong>the</strong>serelatively distant areas are unknown. The fauna at o<strong>the</strong>r seamounthabitats is, however, apparently often similar to neighbor<strong>in</strong>gareas that fall with<strong>in</strong> organisms’ preferred depth ranges (Clarket al., 2010).The composition of <strong>the</strong> deep-sea nematode assemblages consideredat genus level along <strong>the</strong> ANDEEP-SYSTCO transect is comparablewith deep-sea nematode communities worldwide. Threeout of four genera that dom<strong>in</strong>ate at all ANDEEP-SYSTCO stations(Acantholaimus, Halalaimus, <strong>and</strong> Desmoscolex) are known as dom<strong>in</strong>antgenera (>2% relative abundance) at deep-sea (i.e. slope to hadalzone) areas worldwide (Vanreusel et al., 2010). Our results<strong>the</strong>refore confirm that <strong>the</strong>re is no dist<strong>in</strong>ct Antarctic nematode<strong>community</strong> at genus level (Vanhove et al., 1999, 2004; Sebastianet al., 2007). In <strong>the</strong> study of Vanhove et al. (1999) nematode (generic)structural <strong>and</strong> trophic diversity decreased from <strong>the</strong> shelfbreak <strong>and</strong> upper slope (EG(100) = 40, H 1 = 3.85–3.45) towardsdown slope (EG(100) = 30, H 1 = 2.94). In comparison, <strong>the</strong> LazarevSea (LS) station at a comparable depth as <strong>the</strong> downslope station <strong>in</strong><strong>the</strong> Eastern Weddell Sea, has a higher structural <strong>and</strong> trophic diversity(EG(100) = 39, H 1 = 3.5). The rarefaction <strong>in</strong>dex for <strong>the</strong> LSslope station also agreed well with <strong>the</strong> <strong>in</strong>dex calculated for slopesworldwide (EG(100) = 40; Vanreusel et al., 2010.) Similarly to whatwas found on a worldwide scale, <strong>the</strong> rarefaction <strong>in</strong>dex reducedwhen <strong>the</strong> less diverse abyssal communities were taken <strong>in</strong>to account(EG(100) = 34.5 versus 35.5 <strong>in</strong> Vanreusel et al. (2010)). TheLS station seemed to be <strong>the</strong> area of highest polychaete diversitytoo (Wilmsen <strong>and</strong> Schüller, 2011). Two factors that are generallybelieved to <strong>in</strong>crease diversity at slopes compared to <strong>the</strong> abyss areenhanced food <strong>in</strong>put <strong>and</strong> <strong>the</strong> reduced stability of <strong>the</strong> cont<strong>in</strong>entalslope environment due to <strong>the</strong> higher eventuality of l<strong>and</strong>slides(Wilmsen <strong>and</strong> Schüller, 2011 <strong>and</strong> references <strong>the</strong>re<strong>in</strong>).Epistratum feeders (2A) sensu Wieser (1953) dom<strong>in</strong>ated at moststations (LS, MR, sPF). Vanhove et al. (1995, 1999, 2004) <strong>and</strong> Sebastianet al. (2007) observed a dom<strong>in</strong>ance of epistratum feeders <strong>in</strong>Sou<strong>the</strong>rn Ocean slope <strong>and</strong> abyssal sediments where <strong>the</strong> highest <strong>in</strong>putof organic matter was expected based on highest nematodedensities. They expla<strong>in</strong>ed this as a functional adaptation of nematodecommunities to short-term events of fresh food supply. However,no such l<strong>in</strong>k emerges when our feed<strong>in</strong>g type compositions are


