savewater!® Alliance Inc. Annual Report 2011/12 - Savewater.com.au
savewater!® Alliance Inc. Annual Report 2011/12 - Savewater.com.au
savewater!® Alliance Inc. Annual Report 2011/12 - Savewater.com.au

Create successful ePaper yourself
Turn your PDF publications into a flip-book with our unique Google optimized e-Paper software.
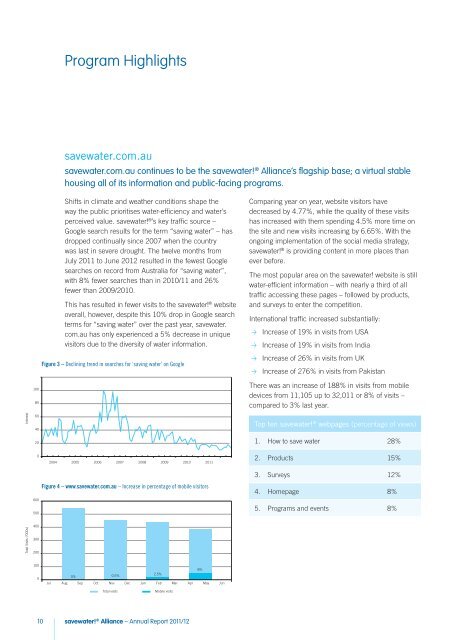
Program Highlights<strong>savewater</strong>.<strong>com</strong>.<strong>au</strong><strong>savewater</strong>.<strong>com</strong>.<strong>au</strong> continues to be the <strong>savewater</strong>! ® <strong>Alliance</strong>’s flagship base; a virtual stablehousing all of its information and public-facing programs.InterestInterest100100 8060 8040 6020 40Shifts in climate and weather conditions shape theway the public prioritises water-efficiency and water’sperceived value. <strong>savewater</strong>! ® ’s key traffic source –Google search results for the term “saving water” – hasdropped continually since 2007 when the countrywas last in severe drought. The twelve months fromJuly <strong>2011</strong> to June 20<strong>12</strong> resulted in the fewest Googlesearches on record from Australia for “saving water”,with 8% fewer searches than in 2010/11 and 26%fewer than 2009/2010.This has resulted in fewer visits to the <strong>savewater</strong>! ® websiteoverall, however, despite this 10% drop in Google searchterms for “saving water” over the past year, <strong>savewater</strong>.<strong>com</strong>.<strong>au</strong> has only experienced a 5% decrease in uniquevisitors due to the diversity of water information.Figure 3 – Declining trend in searches for ‘saving water’ on GoogleComparing year on year, website visitors havedecreased by 4.77%, while the quality of these visitshas increased with them spending 4.5% more time onthe site and new visits increasing by 6.65%. With theongoing implementation of the social media strategy,<strong>savewater</strong>! ® is providing content in more places thanever before.The most popular area on the <strong>savewater</strong>! website is stillwater-efficient information – with nearly a third of alltraffic accessing these pages – followed by products,and surveys to enter the <strong>com</strong>petition.International traffic increased substantially:> > <strong>Inc</strong>rease of 19% in visits from USA> > <strong>Inc</strong>rease of 19% in visits from India> > <strong>Inc</strong>rease of 26% in visits from UK> > <strong>Inc</strong>rease of 276% in visits from PakistanThere was an increase of 188% in visits from mobiledevices from 11,105 up to 32,011 or 8% of visits –<strong>com</strong>pared to 3% last year.Top ten <strong>savewater</strong>! ® webpages (percentage of views)20002004 2005 2006 2007 2008 2009 2010 <strong>2011</strong>2004 2005 2006 2007 2008 2009 2010 <strong>2011</strong>1. How to save water 28%2. Products 15%600500 600Figure 4 – www.<strong>savewater</strong>.<strong>com</strong>.<strong>au</strong> – <strong>Inc</strong>rease in percentage of mobile visitors3. Surveys <strong>12</strong>%4. Homepage 8%5. Programs and events 8%Total Visits Total (’000s) Visits (’000s)400 500300 400200 300100 200100008%0% 0.5%2.5%Jul Aug Sep Oct Nov Dec Jan Feb Mar Apr 8% May Jun0% 0.5%2.5%Total visitsMobile visitsJul Aug Sep Oct Nov Dec Jan Feb Mar Apr May JunTotal visitsMobile visits10<strong>savewater</strong>! ® <strong>Alliance</strong> – <strong>Annual</strong> <strong>Report</strong> <strong>2011</strong>/<strong>12</strong>