GDF Annual Report - Gauteng Provincial Treasury
GDF Annual Report - Gauteng Provincial Treasury
GDF Annual Report - Gauteng Provincial Treasury

You also want an ePaper? Increase the reach of your titles
YUMPU automatically turns print PDFs into web optimized ePapers that Google loves.
<strong>Annual</strong> <strong>Report</strong>2010/11Building a results drivenenvironment, seeing theplans throughfinanceDepartment: FinanceGAUTENG PROVINCE
CONTENTSForeword by the MEC........................................................................................ 2Executive Summary........................................................................................... 4Section 1: Departmental Overview................................................................... 7Mandate and Purpose of the Department.................................................9Other Mandate: Alignment to Batho Pele Principles.............................. 10Other Mandate: Support to <strong>Provincial</strong> Priorities..................................... 10Section 2: <strong>Report</strong> on Organisational Systems and Resources....................11Vision, Mission, Value System and Strategic Objectives........................ 13Value Statement....................................................................................... 14Strategic Objectives.................................................................................. 14Organisational Structure.......................................................................... 15Section 3: <strong>Report</strong> on the Performance of Programmes...............................17Section 4: <strong>Annual</strong> Financial Statements.................................................... 133<strong>Report</strong> of the Auditor-General................................................................135<strong>Report</strong> of the Audit Commitee...............................................................138<strong>Report</strong> of the Accounting Officer............................................................140Financial Statements.............................................................................145Section 5: Outlook for the coming Financial Year (2011-2012)............... 211Section 6: Oversight <strong>Report</strong>..........................................................................217<strong>Gauteng</strong> Department of Finance1
FOREWORD BY THE MECAs an activist, developmental and interventionistdepartment, we are moving with the necessary speedto ensure a targeted and balanced approach in theallocation of both financial and non-financial resourcesto areas that support the achievement of our prioritiesas reflected in the GPG Medium Term StrategicFramework.Indeed, the past financial year has seen <strong>Gauteng</strong>Department of Finance making significant progresson key performance areas aimed at ensuring that weimplement our mandate effectively. In line with ourroadmap to achieve the goals we set for ourselves by2014, we’ve moved with the necessary speed to:• Increase fiscal management capacity to achieveoperational efficiency and promote accountabilityin government;• Provide strategic leadership and technical supportin fiscal management and discipline;• Develop and implement efficient internal systemsand processes; and• Provide guidance and leadership in theimplementation of fiscal management reforms forboth provincial and local government.• Identify and leverage alternative revenue streams;• Provide strategic and operational support todepartments and municipalities in the delivery oftheir mandates.This we have done, and will continue to do in futurebecause it contributes significantly to the achievementof <strong>Gauteng</strong> <strong>Provincial</strong> Government’s goal of building adevelopmental state that is efficient in the way it conductits business, is responsive to the needs of people andquicker in the manner in which it provides services tocommunities. Hence GPG’s tagline: “Kuyasheshwa,<strong>Gauteng</strong> Working Better”.Information contained in this <strong>Annual</strong> <strong>Report</strong>indicates that we have made significant progress inthe configuration of the department to provide theleadership necessary for a development state that weare in the process of creating to appropriately respondto the needs of our people.In this regard we have finalised the merger of the<strong>Gauteng</strong> <strong>Treasury</strong>, <strong>Gauteng</strong> Shared Services Centreand the <strong>Gauteng</strong> Fund Project Office. The Departmentof Public Service and Administration has endorsedthe organisational structure of <strong>GDF</strong>, which provides anoperational framework for our department. The nextfinancial year will see us placing existing personnel inpositions and fill funded vacant posts.We moved with the necessary speed to reconfigurethe Shared Services Centre in line with therecommendations of the review process. There is nodoubt that we will complete this process as planned.The SSC will become strategic and highly focused,streamlining and improving transactional processeswhile realising economies of scale through the bulkbuying power of the provincial government.This report also provides details of the measuresthat we have taken to enhance the internal controlenvironment and improve financial management inthe province. Amongst other things, in line with thePresidential directive, we introduced the outcomesbased budgeting approach. Our focus in this regardwas to ensure that scares resources are allocated toprogrammes aligned with the priorities of the provincialgovernment; and departments work together toaccelerate implementation.Furthermore, we continued with our austerity measures,shifting funds from non-core to core programmes andprojects. Our focus, as always, was to facilitate strict costcontainment measures, tight contract managementprocesses and stringent payment plans to ensurecompliance with the Public Finance ManagementAct. Our aim in this regard has been on ensuring thatdepartments spend within their allocated budgets andthat there is no wastage.22<strong>Annual</strong> <strong>Report</strong> 2010 / 2011
FOREWORD BY THE MECThese and other successes would not have beenrecorded if it was not for the hard work, dedicationand passion of the highly skilled staff of <strong>GDF</strong>under the leadership of HOD, Mr Stewart Lumka. Myheartfelt thanks to you all, you are indeed our mostimportant asset.As you continue with your important duties every day,bear in mind that the democratic developmental statethat <strong>GDF</strong> is mandated to build will not only improve theway government conducts its business and accelerateservice delivery to our people. It will foster economicgrowth and development as the allocation of resourceswill be aligned to priorities that promote productive andincome generating economic activities. This will lead tojob creation, facilitating the inclusive economic growththat we desire to build a better future for the peopleof <strong>Gauteng</strong>.…………………………………………Mr. Mandla Nkomfe<strong>Gauteng</strong> Finance MEC<strong>Gauteng</strong> Department of Finance3
EXECUTIVE SUMMARYThe 2010/2011 fiscal period was a successful onefor the <strong>Gauteng</strong> Department of Finance (<strong>GDF</strong>). Thedepartment recorded numerous important milestonesin its effort to effect prudent financial management inthe province, job creation and service delivery to thepeople of <strong>Gauteng</strong>.Achieving efficiencies in financial management andenhancing the internal control environment was one ofour key priorities for the year under review. As such, weimplemented stringent cost containment measures toensure that business units spend within their budgets.Amongst other things, we amended the TelephonePolicy, reduced monthly allowances for landlinesand mobile phones across the board. In addition, weimplemented a Soft-Lock facility on all departmentalmobile phones and also transferred mobile phonecontracts from the <strong>GDF</strong> to respective employees.With regards to our fleet management, we introduced theG-Fleet Control System, which resulted in the reductionof our transport operating expenditure. Significantsavings were also achieved by centralising stationery,stores, travelling, catering, and in the procurementof telephone, training, bursaries, and resettlementcosts. Finally, we introduced a moratorium on filling allnon-critical vacancies across the department. Thesemeasures enabled the <strong>GDF</strong> to operate within its budgetbaseline. As a result, the department had spent 98% ofits adjusted budget appropriation of R1, 515bn by theend of the financial year.Other successes achieved were in the managementof supplier payments. They were realised in a difficultperiod which was bedeviled by cash-flow challenges. Inthis regard, not only did we reduce the department’sliabilities, but also minimised potential and reallitigation, and it’s concomitant and negative publicity.The Procure to Pay Unit continued to provideprocurement services to the <strong>Gauteng</strong> <strong>Provincial</strong>Government. We also leveraged from advancedtechnology to automate, standardise, and streamlinedadministrative processes. These initiatives enabled usto source 2% of all agricultural produce consumed by theprovincial government directly from emerging farmers.Consequently, we contributed to the creation of decentwork, and in building a growing- inclusive economy andsustainable livelihoods. For the second successiveyear, Procure to Pay received the South African Bureauof Standards prestigious ISO 9001:2008 certification.This award confirmed the high excellence standardsemployed in this business unit.From a health empowerment front, we awarded 74.1%of all maintenance contracts for medical equipment toBEE suppliers. These entities were accredited agentsunder the Original Equipment Manufacturer (OEM)standard. What’s more, we realized an average of8% savings valued at R11, 2m on the procurement ofMedical Equipment.We intensified our drive to provide a world-class,customer-focused and consultative human resourceservice to the GPG. In this regard, we implemented anumber of innovative solutions to improve customerexperience in human resource administration. Inresponse to the high volumes of CVs that our TalentAttraction Unit received monthly, we established aProfessional Job Centre at the Thusong Centre whichis located in the Maponya Mall in Soweto. This was thefirst facility of this nature which brought governmentrecruitment closer to where people live, and in a retailcomplex frequented by millions.This intervention meant that whilst Sowetan’s weredoing their shopping and other related activities, theywere enabled to walk into our facility, check availablevacancies, receive career advice, and apply online forsuch vacancies.Other innovations considered and implementedincluded efforts to reduce the high volume of manualcapturing of payment of allowances. As such, the PayrollService Unit automated these processes which resultedin the reduction of processing times from three (3) days44<strong>Annual</strong> <strong>Report</strong> 2010 / 2011
EXECUTIVE SUMMARYto one (1) day from the date of receipt of a mandatefrom GPG departments. This process has since beenimplemented in seventeen (17) GPG entities to date.As custodians of provincial resources, we areresponsible for the equitable appropriation of provincialresources. We are equally responsible for ensuring thatdepartments are adequately equipped to spend theseresources in accordance with approved provincial plans,which are in accordance with SCM and governance dueprocess.that they could further their studies in various socioeconomicfields. This intervention was to further ourgoal of becoming a learning organisation, and to realiseour quest for information and knowledge that couldenhance the way in which we conduct our business.In view of the above, I hereby present the <strong>Annual</strong><strong>Report</strong> of the <strong>GDF</strong> for the 2010/2011 financial year,which provides details of our performance against settargets.In line with <strong>GDF</strong>’s value statement, our employeesfulfill a pivotal role in ensuring that we deliver on ourmandate. As such, we emphasise the importanceof career development and training as a means ofenhancing their competitiveness and competence.In this regard, the department awarded bursaries tonumerous officials during the year under review so…………………………………………Mr. Stewart LumkaHead of Department:<strong>Gauteng</strong> Department of Finance<strong>Gauteng</strong> Department of Finance5
SECTION 1:DEPARTMENTAL OVERVIEW
SECTION 1:DEPARTMENTAL OVERVIEW1. SECTION I: DEPARTMENTALOVERVIEWMANDATE AND PURPOSE OF THEDEPARTMENTThe <strong>Gauteng</strong> Department of Finance derives itsmandate from the following Legislation:The Constitution of the Republic of South Africa (Act108 of 1996)The Mandate of and environment within whichNational, <strong>Provincial</strong> and Local Government FinancialDepartments and Treasuries operate, is specificallydescribed in Chapter 13: General Financial Matters.Division of Revenue ActProvides for the equitable division of revenue raisednationally, inclusive of conditional grants, amongst thethree spheres of government, and matters incidentalthereto.Basic Conditions of Employment Act, 1997 (Act 75of 1997)Provides regulatory prescripts, in addition to the PublicService Act, 1994 and the Public Service Regulations,2001, regarding the conditions of employment of staffin the <strong>Gauteng</strong> Government.Borrowing Powers of <strong>Provincial</strong> Government Act,1996 (Act 48 of 1996)Provides norms and conditions which the Departmentmust adhere to in negotiating loans for the <strong>Provincial</strong>Government.Employment Equity Act, 1998 (Act 55 of 1998)Regulates the processes and procedures of theDepartment in achieving a diverse and competentworkforce broadly representative of the demographicsof <strong>Gauteng</strong>, and eliminating unfair discrimination inemployment towards implementing employment equity.Intergovernmental Fiscal Relations Act, 1997 (Act97 of 1997)Defines the role of the Minister of Finance and EconomicDevelopment and that of the Department of Financeas representatives of the <strong>Provincial</strong> Government, inpromoting co-operation between other spheres ofgovernment on fiscal, budgetary and financial matters;to provide insight into the prescribed processes for thedetermination of the equitable share and allocation ofrevenue raised nationally and for matters in connectiontherewith.Labour Relations Act, 1995 (Act 66 of 1995)To regulate and guide the Department in recognisingand fulfilling its role in effecting labour harmony andthe democratisation of the workplace.Municipal Finance Management Act (2004)To support and monitor financial management inmunicipalities.Municipality Systems Act (2000) and DevelopmentFacilitation Act (1995)To support and monitor municipal IntegratedDevelopment Planning (IDP) processes.Preferential Procurement Policy Framework Act (2000)Provides a framework for the implementation ofpreferential procurement policy.Promotion of Access to Information Act, 2000 (Act 2of 2000)To give effect to the constitutional right of access to anyinformation held by the State and any information thatis held by another person and that is required for theexercise or protection of any rights; and to provide formatters connected therewith.Public Finance Management Act, 1999 (Act 1 of 1999)Regulates financial management in the Departmentto ensure that all revenue, expenditure, assets andliabilities of the Department are managed efficientlyand effectively; to provide for the responsibilities ofpersons entrusted with financial management in theDepartment and to provide for matters connectedtherewith. To fulfil all Departmental responsibilitieswith respect to other departments and public entities.<strong>Gauteng</strong> Department of Finance9
SECTION 1:DEPARTMENTAL OVERVIEWPublic Service Act, 1994 (Act 103 of 1994)Provides for the organisation and administration ofthe Department and for human resource managementwhich includes the regulation of conditions ofemployment, terms of office, discipline, retirement anddischarge of staff members of the Department andmatters connected therewith.<strong>Gauteng</strong> Tender Board Repeal Act, 2002Gives effect to new procurement reform initiatives in<strong>Gauteng</strong>.Occupational Health and Safety Act, 1995Provides a framework for the standards andrequirements for workplaces, facilities and employeehealth and safety.The National Archives Act, 1996Provides for the archiving, storage and accessibility ofinformation, and for the manner in which governmentbodies store documents, papers and records.Public Service Laws Amendment Act 1997Regulates the functions and conditions of service ofheads of provincial departments and the conditionsof service of heads of organisational components;provides for the appointment of persons on thegrounds of policy considerations; and makes provisionsin connection with inefficiency and misconductPromotion of Administrative Justice Act, 2000Gives effect to the right to administrative action thatis lawful, reasonable and procedurally fair and to theright to written reasons for administrative action ascontemplated in section 33 of the Constitution of theRepublic of South Africa.Prevention and Combating of Corrupt Activities Act, 2004The Prevention and Combating of Corrupt Activities Actmakes corruption a crime. It covers anyone workingfor government (such as Ministers, department staff,and the police) and people outside of government (likesomeone working for a business).Government Employees Pension Law, 1996 and 2004amendmentOTHER MANDATE: Alignment to BathoPele PrinciplesIn addition to the above Legislative Mandates, the<strong>Gauteng</strong> Department of Finance ensures alignment to,and support of, the principles of Batho Pele by ensuringthat spending agencies create value for money; andthrough the provision of technical assistance andanalysis - some of these mechanisms include theEfficiency Study, CIBA and SAM; and by promotingtransparency and access to information throughpublications such as the MTBPS, the Budget Statementand the budget insert in local newspapers during thebudget speech period.OTHER MANDATE: Support to provincialprioritiesIn addition, the Department of Finance was reconfiguredin 2009 in order that its functional units fully supportthe 2009 – 2014 <strong>Provincial</strong> Priorities. This will bethrough the manner in which it targets and balancesthe allocations of resources (both financial and nonfinancial)to areas that support inclusive economicdevelopment and job creation, as well as enhancedsocial service delivery in the province.Whilst there may not be direct action by the <strong>Gauteng</strong>Department of Finance that can be specificallycorrelated to each provincial priority, the Departmentwill ensure that resources allocated to Departmentsare effectively utilised and are directed towards theachievement of the electoral mandate and the stated<strong>Gauteng</strong> <strong>Provincial</strong> Government priorities, as follows:1. Creating decent work and building a growing,inclusive economy.2. Promoting quality education and skills development.3. Better health care for all.4. Stimulating rural development and food security.5. Intensifying the fight against crime and corruption.6. Building cohesive and sustainable communities.7. Strengthening the developmental state and goodgovernance.1010<strong>Annual</strong> <strong>Report</strong> 2010 / 2011
SECTION 2:REPORT ON ORGANISATIONAL SYSTEMS AND RESOURCES
SECTION 2: REPORT ON ORGANISATIONALSYSTEMS AND RESOURCESSECTION II : REPORT ONORGANISATIONAL SYSTEMS ANDRESOURCES2. VISION, MISSION, VALUE SYSTEMAND STRATEGIC OBJECTIVES2.1 VISIONIn delivering in line with its statement of purpose, the<strong>Gauteng</strong> Department of Finance sets for itself thefollowing vision:“To be an activist, developmental and interventionistdepartment; providing strategic and operationalsupport to the Province, towards the achievement ofinclusive growth.”The Department defines the key terms reflected in itsVision statement above, as follows:• Developmental: To mobilise towards a commonunderstanding (one-mind) of the strategic agendaof the Province. To rally together, a partnership. Afocus on impact – “A department able to mobilisethe provincial resources of GPG towards impact– the achievement of provincial priorities.” Tofocus on both the capacity of the state and thesustainability of provincial resources.• Activist: To encourage public participation inplanning / budgeting. To ensure that resourceallocation is informed by communities on theground. To be pro-active, not passive. The <strong>GDF</strong>should participate in strategy planning sessions ofdepartments to better understand their businessand to be able to exercise oversight. In this regard,the <strong>GDF</strong> will collaborate with GPC to enhanceprovincial planning. To get involved, and be forwardlooking. To be a champion – an activist throughinnovation and research.• Interventionist: If things are not happening, the<strong>GDF</strong> should put in place sustainable measuresto enhance delivery. Not just intervening atan administrative level –but through strategicpartnering. The <strong>GDF</strong> should also influence, and inso doing, instil fiscal discipline in departments andmunicipalities. To be proactive in intervening – weneed systems and capacity (e.g. a rapid responseteam). We must question how we can best utilisetools such as early warning systems.• Strategic: To provide leadership and direction.This will require a forecasting capacity. The focusis on sustainability. We need the ability to predictand to be able to navigate the province in terms ofoptimal resource utilisation. We should be radical.We work to “de-bureaucratise” the state.2.2 MISSIONIn order to achieve its defined Vision, the <strong>Gauteng</strong>Department of Finance sets for itself the followingstatement of Mission:“We are a strategic, pro-active and value addingpartner that will promote and enhance effectiveservice delivery, by:• Ensuring allocative and operational efficiencies• Instilling fiscal discipline and sound corporategovernance• Mobilising alternative funding sources andresourcing solutions• Ensuring innovation and leading edge technologiesand processes• Professionalising the public service by investing in“human capital”.<strong>Gauteng</strong> Department of Finance13
SECTION 2: REPORT ON ORGANISATIONALSYSTEMS AND RESOURCES2.3 VALUE STATEMENTConsultationService StandardsAccessCourtesyInformationOpenness and TransparencyRedressValue for MoneyCitizens should be consulted about the level and quality of the Public Services they receive and, wherever possible, should be given achoice about the services that are offered.Citizens should be told what level and quality of Public Services they would receive so that they are aware of what to expect.All citizens should have equal access to the services to which they are entitled.Citizens should be treated with courtesy and consideration.Citizens should be given full, accurate informationCitizens should be told how national and provincial departments are run, how much they cost, and who is in charge.If the promised standard of service is not delivered, citizens should be offered an apology, a full explanation, and a speedy and effectiveremedy; and when complaints are made, citizens should receive a sympathetic, positive response.Public services should be provided economically and efficiently in order to give citizens the best possible Value for Money.2.4 STRATEGIC OBJECTIVES1. To be a centre of excellence in the public sector in strategic and innovative information solutions;2. To ensure sound corporate governance in the province and to provide robust resource management services;3. To provide proactive strategic and operational institutional support to stakeholders, thus enabling them to deliver quality services;4. To secure alternative finance sources, including the creation of new revenue streams;5. To ensure cost efficiencies and consolidating resources for economies of scale;6. To ensure effective and efficient management of the <strong>GDF</strong> and its programmes;7. To be a preferred employer, attracting and retaining highly skilled and performing individuals.1414<strong>Annual</strong> <strong>Report</strong> 2010 / 2011
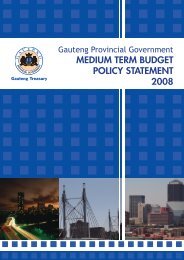
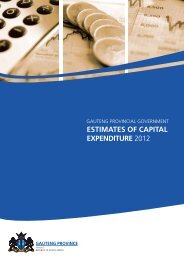
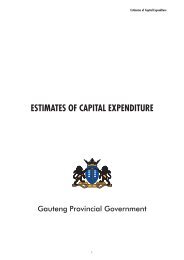
SECTION 2: REPORT ON ORGANISATIONALSYSTEMS AND RESOURCES2.5 ORGANISATIONAL STRUCTUREOffice of the MEC<strong>Gauteng</strong> Department of FinanceHOD:<strong>Gauteng</strong> Department of Finance<strong>Gauteng</strong> FundStrategic Planning andMonitoring and Evaluation<strong>Treasury</strong> ServicesShared ServicesAudit ServicesFinancialGovernanceSustainableResourceManagement<strong>Provincial</strong>AccountingServicesProcureto PayHire toRetireTechnologySupportServicesDocumentManagementCentreOffice of the CFOCorporate Support<strong>Gauteng</strong> Department of Finance15
SECTION 3:REPORT ON THE PERFORMANCE OF PROGRAMMES
SECTION 3: REPORT ON THE PERFORMANCE OF PROGRAMMES1. Programme: Administration(Corporate Support)1.1. PurposeThe purpose of Corporate Support is to provide clearlyarticulated strategies to achieve the <strong>GDF</strong> strategicobjectives, ensure that the Department is adequatelyresourced to execute its programmes and report to thestakeholders on the progress on priorities and strategicprogrammes1.2. Strategic Objectives• To be a centre of excellence in the public sector instrategic and innovative information solutions.• To ensure sound corporate governance inthe province and to provide robust resourcemanagement services• To provide proactive strategic and operationalinstitutional support to stakeholders, thusenabling them to deliver quality services• To secure alternative finance sources, includingthe creation of new revenue streams.• To ensure cost efficiencies and consolidatingresources for economies of scale• To ensure effective and efficient management ofthe <strong>GDF</strong> and its programmes• To be a preferred employer, attracting and retaininghighly skilled and performing individuals.The department did not change the purpose andobjectives of programmes during the year underreview. However, changes to targets are reflected undereach relevant programme and sub-programme (ReferAdjusted Estimates of <strong>Provincial</strong> Expenditure). For easeof auditing the department’s performance information,the <strong>Annual</strong> Performance <strong>Report</strong> structure has beenkept the same as the approved <strong>Annual</strong> PerformancePlan.1.3. Sub-programme1: MEC’s OfficePurpose:To provide proactive, strategic and administrativesupport to the executive authority, thereby ensuringthat the MEC is able to provide political leadershipand direction to the departmentStrategic Objectives:• To provide proactive strategic and operationalinstitutional support to stakeholders, thusenabling them to deliver quality services.Measurable Objectives:• To support and challenge departments to helpthem deliver public services.<strong>Gauteng</strong> Department of Finance19
SECTION 3: REPORT ON THE PERFORMANCE OF PROGRAMMESPerformance against output targetsOutputs/ keydeliverablesImplementedactivities andplans of theexecutiveauthority asprioritisedMonitoring andevaluation reportsand opinion piece,political advicePerformanceIndicatorsPrioritised activitiesand plans of theexecutive authorityOutcome of the Policyanalysis monitoringand evaluation reportsand opinion piece<strong>Annual</strong> Target Actual Performance against Output target Reasons for deviations100% implementationof the prioritisedactivities and plans ofthe executive authority4 outcomes to the policyanalysis, 4 monitoringand evaluation reportsand opinion piece (asper requirement)All (100%) priorities activities of the Officeof the MEC have been implemented asper Programme of the Executive Council,legislature and stakeholders (both internaland external). The high level activities wereconsolidated into milestone activity plan(including the provincial POA).3 policy analysis & monitoring and evaluationreports on the 1st, 2nd & 3rd quarterreports of the <strong>GDF</strong> were produced as wellas 2 analyses on the oversight report ofthe Legislature on the 1nd and 2rd quarterreport of <strong>GDF</strong>.The unit also produced six month (January–June 2010) analysis of the Legislaturequestions that have a bearing on theportfolio of the executive authority.All Executive Council submissions weremonitored as per Executive Council system.During the first quarter of the year underreview, we did not produce policy analysisreport because we were still in the stageof clarifying our M&E system, and theDepartment was also still working on its M&Emodel. As the Office of the MEC, we took adecision to operate in the departmental M&Espace. This was to enable the office to assesswhether the department is keeping with itsstrategic objectives/ outcomes.2020<strong>Annual</strong> <strong>Report</strong> 2010 / 2011
SECTION 3: REPORT ON THE PERFORMANCE OF PROGRAMMESOutputs/ keydeliverablesPerformanceIndicators<strong>Annual</strong> Target Actual Performance against Output target Reasons for deviationsTrackedparliamentarymattersTracked parliamentarymatters in terms ofthe Legislature`sprogramme, orderpaper and questionpaper100% closure of thetracked parliamentarymattersAll 131 (100%) parliamentary matters weretracked and closed.Review and Enhancethe tracking system onparliamentary mattersTracked publicqueries andresponsesprovidedTracked public queriesand responsesprovided.Review and Enhancethe internal publicquery tracking system100% resolved/ closureof the tracked publicqueries.All 22 (100% public queries referred to theOffice of the MEC were resolved.<strong>Gauteng</strong> Department of Finance21
SECTION 3: REPORT ON THE PERFORMANCE OF PROGRAMMESKEY ACHIEVEMENTS• Management of prioritised activities: During theyear under review, we have managed all prioritisedactivities of the Office of the MEC (includingthe annual milestone activity plan) as per theprogramme of Executive Council, departmental,Legislature and internal and external stakeholders.• Policy Monitoring and Evaluation: The focus ofpolicy monitoring and evaluation was on analysingreports and submissions of the department inimplementing the Five Year Strategic Plan and<strong>Annual</strong> Performance Plan. The sub programmecompleted analysis of the first, second and thirdquarter reports of the <strong>Gauteng</strong> Departmentof Finance, and the oversight report of theLegislature`s Finance Portfolio Committee onthe first and second quarter performance of <strong>GDF</strong>.We have also managed to track and analyse allExecutive Council matters that have bearing onthe portfolio of the Executive Authority. In additionto the work we have completed, we also finalisedthe six month (January –June 2010) analysis of theLegislature questions that have policy implicationson the portfolio of the Executive Authority.• Management of parliamentary matters: Theunit continued to track and close all Legislaturematters (For example: questions, motions, reportsfor tabling, sittings of the house, meeting of thecommittees and legislations) that have a bearingon the portfolio of Executive Authority of <strong>GDF</strong>.We have a tracking system in place and it isfunctioning very well. During the year underreview, we tracked and closed all 131 (100%)parliamentary matters.• Management of public queries: We tracked andfacilitated closure of all public queries directed atthe Office of the MEC.• Communication: We have worked closely withthe Communication unit in developing andimplementing media plans as per our priorityactivities (Milestone Activity Plan). We alsocompleted all the speeches needed as part of oursupport to the Executive Authority.OUTLOOK FOR THE YEAR AHEAD(2011/2012)• In a bid and as part of rendering effectiveoversight support to the Executive Authority onthe implementation of the strategic objectives andpriorities of <strong>GDF</strong>, the sub programme’s prioritiesgoing forward includes:~ Evaluating <strong>GDF</strong> performance on policyobjectives ( Contribution/support of GPGpriority outcomes);~ Tracking and facilitating the closure of theparliamentary matters;~ Tracking and facilitating the closure of publicqueries;~ Analysis of public policy discourse in relationto issues that have a bearing on the portfolioof the Executive Authority.1.4. Sub-programme 2: Office of theHODThe HOD’s <strong>Report</strong> in the APR will be compiled when thefinancial and non-financial performance informationhas been audited. The report talks to the aggregatedperformance of the department, focusing on thefollowing stated annual targets:• Complete implementation of Impact MeasurementSystem for <strong>GDF</strong> programmes• Strategic Business partnerships that promote theeffectiveness of the <strong>GDF</strong>• New revenue streams created• Improved capacity and capability of the department• Clean Audit <strong>Report</strong> for <strong>GDF</strong>.1.5. Sub-programme 3: Office of theDivisional Head: <strong>Treasury</strong> ServicesThe Head of <strong>Treasury</strong>’s <strong>Report</strong> in the APR will becompiled when the financial and non-financial2222<strong>Annual</strong> <strong>Report</strong> 2010 / 2011
SECTION 3: REPORT ON THE PERFORMANCE OF PROGRAMMESperformance information has been audited. The reporttalks to the aggregated performance of the <strong>Provincial</strong><strong>Treasury</strong> in terms of the role, mandate and functionof <strong>Treasury</strong>, focusing on the following stated annualtargets:• 100% implementation of <strong>Provincial</strong> Fiscal Plan• 2% Variance on <strong>Treasury</strong> compiled forecasts ofGPG Expenditure at Budget vs. Actual expenditureas at the End of Year Fiscal <strong>Report</strong>• Assessments of impact alignment of strategiesfunded through projects and other initiatives• 50% increase in performance at departmentallevel in timeliness and quality of in-year-monitoring• 2 Assessments of <strong>Gauteng</strong>’s financial stabilityand risk management• 20% decrease in error rates of financial activities.1.6. Sub-programme 4: Office of theDivisional Head: Shared ServicesThe Head of Shared Services’ <strong>Report</strong> in the APR willbe compiled when the financial and non-financialperformance information has been audited. The reporttalks to the aggregated performance of the departmentin terms of the role, mandate and function of theShared Service Centre, focusing on the following statedannual targets:• 75% customer requirements satisfied by SharedServices• 20% Efficiency improvement in services deliveredby Shared Services• 10 % reduction in overall transactional costs• Advancement in organisational learning andinnovation.1.7. Sub-programme 5: CFO’s OfficePurpose:• To provide strategic financial planning support,financial management and quality supply chainmanagement services to the <strong>GDF</strong>.Strategic Objectives:• To ensure effective and efficient management of the<strong>GDF</strong> and its programmes.• To provide proactive strategic and operationalinstitutional support to stakeholders thus enablingthem to deliver quality services• To ensure cost efficiencies and consolidatingresources for economies of scale.Measurable objectives:• To appropriate financial management measuresthat enables the <strong>GDF</strong> to be compliant with thePFMA, <strong>Treasury</strong> Regulations and other legislativerequirements.• To provide professional, cost effective and qualitysupply chain management service to the <strong>GDF</strong>.<strong>Gauteng</strong> Department of Finance23
SECTION 3: REPORT ON THE PERFORMANCE OF PROGRAMMESPerformance against output targetsOutputs/ key deliverables Performance Indicators <strong>Annual</strong> Target Actual achieved against target Reasons for DeviationsIYM <strong>Report</strong>s;Adjustment Budget;MTEF Budget.Managed <strong>GDF</strong> spendaccording to operationalplansTimely submission offinancial allocations of<strong>GDF</strong>’s short and long-termpriorities.% Budget spendaccording to priorities100% of IYM <strong>Report</strong>ssubmitted no later than the15th of every month.100% budgetspendImproved compliance Audit report 100% compliance100%Compliance98% spendImprovement will be measuredwhen the audit for 2010/11 iscompletedCash outlays on items not originallybudgeted for, including the payment ofprior year accruals.Reduced logistics costs% reduction in totallogistics cost20% reduction in totallogistics cost20% reduction in total logisticscostThoroughly Integrated SupplyChain to avoid complaintsand achieve hassle freedeliveries% satisfaction of internalcustomer deliveryrequirements100% satisfaction ofinternal customer deliveryrequirements100% satisfaction of internalcustomer delivery requirements2424<strong>Annual</strong> <strong>Report</strong> 2010 / 2011
SECTION 3: REPORT ON THE PERFORMANCE OF PROGRAMMESKEY ACHIEVEMENTS• <strong>GDF</strong> revisited all long outstanding interdepartmental debts, and through a process of reengagementwith affected provincial departmentsmanaged to resolve 90% of them. This shouldsee the <strong>GDF</strong> reporting a very high percentage ofconfirmed interdepartmental debt and improvecollection in the New Year. Another area ofachievement was the management of supplierpayments in the light of cash flow challenges,which was conducted in a manner that minimisedlitigation and negative publicity, without a need foranother Operation Bhadala;• In order to assist budget holders make informedbusiness decisions, the unit issued monthlytechnical reports, which provided an overview ofrespective spending at economic classificationlevel, and an analysis of spending patterns andtrends;• We have institutionalised regular meetings withbudget holders, at which occasions we tabledtheir respective expenditure reports. Also thesesessions were used to address any other budgetrelatedconcerns managers had;• The budget planning and development wentoff relatively smoothly, notwithstanding theconstraints brought to bear on the department bythe budget gap;• All time lines established by <strong>Treasury</strong> wereadhered to and required information provided inaccordance with set requirements;• Within the limited resources available, areas ofpriority were established and funds directed tothose specified areas of need;• As at financial year-end, <strong>GDF</strong> had spent 98% of itsadjusted appropriation, i.e., R1, 515-billion.OUTLOOK FOR THE COMING YEAR(2011/2012)• <strong>GDF</strong> will ensure that provincial departmentsare brought to a level of self management oftransversal service consumption through precommittingof funds that will be utilised for paymentof those services. This may affect services like SitaMainframe costs and call centre services whereuser departments may be requested to suspendfunds upfront, for the consumption of the services;• Develop and implement modern budgeting andcontrol techniques;• Monitor and report on departmental expenditureand provide regular IYM reports;• Plan, develop and implement Adjustment andMTEF budgets for the department.1.8. Sub-programme 6: CorporateServicesPurpose• To provide internal support services to the <strong>GDF</strong> -with regard to human resources management,legal and regulatory - thereby enabling the <strong>GDF</strong> toachieve its strategic objectives.Strategic Objectives:• To be a preferred employer, attracting andretaining appropriately skilled and high performingindividuals.Measurable Objectives• To develop a professional organisation with highstandards and ethics, with appropriate skillsand competencies; ensuring a high performanceculture within the <strong>GDF</strong>.KEY ACHIEVEMENTSInternal HR and Logistic ServicesInternal HR achieved the approval of the organisationalstructure by the MEC and HOD and successfullyconsulted relevant trade unions in the DCMPT on theentire process of reconfiguration, including the matchingand placement process which will be implementedduring the 2011/12 financial year. A labour forum withrepresentatives from management and trade unions<strong>Gauteng</strong> Department of Finance25
SECTION 3: REPORT ON THE PERFORMANCE OF PROGRAMMESwas also established. Additional to this, the functioningand operations of Internal HR processes were efficientlyintegrated following the merger of the units from theformer <strong>Gauteng</strong> <strong>Treasury</strong> and <strong>Gauteng</strong> Shared ServicesCentre (GSSC). All internal HR policies were reviewedand consultation processes with the trade unions areunderway, and will be concluded in 2011/12.In spite of the reconfiguration processes Internal HR stillmanaged to achieve 3.42% of People with Disabilitiesto occupy the staff establishment versus the 2% set outby <strong>Provincial</strong> Target.The fleet of the Department was reduced from 62 to 42vehicles in an attempt to curb expenditure.Legal Services:The Legal and Regulatory Services sub-unit continuedproviding professional, above average in-houselegal services and support to the <strong>GDF</strong>. This was bestevidenced by the volume of finalised formal legalcontracts produced and the well-researched andtimeous legal advice and opinions delivered. The legalteam also provided advice for and actively supportedvarious <strong>GDF</strong> governance structures.2626<strong>Annual</strong> <strong>Report</strong> 2010 / 2011
SECTION 3: REPORT ON THE PERFORMANCE OF PROGRAMMESPerformance against output targetsOutputs/ keydeliverablesPerformance Indicators<strong>Annual</strong> TargetActual Performance against OutputtargetReasons for deviationsBest Practice inPeople ManagementStrategy developed,implemented andevaluated.Developed Framework forBest Practice in PeopleManagement.CRF accredited BestEmployerDeveloped Frameworkfor Best Practice inPeople Management.Achieve Top 50 statusin CRF accredited BestEmployerTarget deferred to 2011/2012 APP.Deferred pending further investigation onthe viability of the projectReconfiguration process delays.Reconfiguration process delays.Compliance to <strong>GDF</strong>service ethosCompliance to <strong>GDF</strong> serviceethos100% Compliance to<strong>GDF</strong> Service ethos<strong>GDF</strong> achieved objectives of the annualService Delivery Improvement Plans (SDIP)– service ethos is based on the Batho Peleprinciples measured in the SDIPApprovedorganisation andstaff establishmentfor <strong>GDF</strong>.Progress onimplementation of<strong>GDF</strong> organisationstructure (Approvedand implementedorganisational structure)Completeimplementation of <strong>GDF</strong>organisation structure.100% achieved, structure reviewcompleted. Approved by MEC & HOD andconsulted with unions. Implementation willcommence in 2011/2012 FY.Completed PersonalDevelopment Plans% staff with completedpersonal developmentplans.100% staff withcompleted PersonalDevelopment Plans95 % of SMS88% of Level (1-12)Non adherence to deadlines<strong>Gauteng</strong> Department of Finance27
SECTION 3: REPORT ON THE PERFORMANCE OF PROGRAMMESOutputs/ keydeliverablesPerformance Indicators<strong>Annual</strong> TargetActual Performance against OutputtargetReasons for deviationsIncreased work doneby <strong>GDF</strong> personnel vs.Contractors.% Increase in work doneby <strong>GDF</strong> personnel vs.Contractors.20% Increase in workdone by <strong>GDF</strong> personnelvs. Contractors.Significant decrease in work done byexternal contractors.The final audited figures on use of externalconsultants will indicate a year on yeardecrease, meaning that <strong>GDF</strong> has increasein the use of own personnel in theexecution of its mandate.Voluntary turnover byperformance level% increase in voluntaryturnover by performancelevelVoluntary turnover byPerformance levelNumber of persons who exited theorganisation in 2010/11 was 171. Due tovarious reasons (Such as contract expiry;death; Misconduct dismissal; resignation;retirement and transfer)2828<strong>Annual</strong> <strong>Report</strong> 2010 / 2011
SECTION 3: REPORT ON THE PERFORMANCE OF PROGRAMMESOUTLOOK FOR THE YEAR AHEADDuring the 2011/2012 financial year, the CorporateServices business unit will focus its attention on anumber of key initiatives. These include:• The Human Recourses will focus on Developingand completing the Human Resource Plan.• Compliance with the provincial employment equitytargets;• The maintenance of vacancy levels below 10%;• Ensure that the <strong>GDF</strong> staff turnover rate does notexceed 10% annually.• The creation of awareness regarding theEmployee Wellness Programme as a benefit andthe encouragement of the utilisation of servicesavailable to employees; and• The capacitating of women, youth and peoplewith disabled through a capacity developmentprogramme. Partnerships will be formed withinstitutions of higher learning and The GCRA.• The provision of best infrastructure maintenancesystems.• The implementation, monitoring and managementof occupational health and safety compliance• X-ray machines to be installed in all security pointto enhance security• The entire security system at <strong>GDF</strong> is under reviewto be upgraded.1.9. Sub-programme 7: CustomerManagement ServicesPurpose• Ensures closer collaboration between <strong>GDF</strong>and its customers by providing Contact CentreManagement, Self Service Management,Document Management Centre, Service LevelManagement and Customer RelationshipManagementStrategic Objectives• To provide proactive strategic and operationalinstitutional support to stakeholders, thusenabling them to deliver quality services.• To ensure cost efficiencies and consolidatingresources for economies of scale.• To ensure sound corporate governance inthe province and to provide robust resourcemanagement services.• To be a centre of excellence in the public sector instrategic and innovative information solutions.Measurable objectives:• To deliver pro-active, strategic and innovativesolutions in Customer Management byimplementing a robust Service ManagementFramework• To optimise processes and technology in DocumentManagement• To provide leading practices in the management oftransactional and corporate records in accordanceto the legislative requirements.• To provide an innovative platform that providesinformation to the public i.e. clients and citizens.<strong>Gauteng</strong> Department of Finance29
SECTION 3: REPORT ON THE PERFORMANCE OF PROGRAMMESPerformance against output targetsOutputs/ key deliverables Performance Indicators <strong>Annual</strong> TargetActual achieved againsttargetReasons for DeviationsImplemented an effectiveand responsive ServiceManagement Framework% overall compliance to SLA 80% SLA Compliance 45%No. of reports on CustomerInteractions12 monthly reportson customerinteractions12 monthly reports oncustomer interactionsInconsistent SLA performance reportingas a result of not having reporting toolsand alternative methods of verifying andvalidating SLA performance dat.Develop, maintain andprovide innovative systemsand processes that areresponsive to businessneeds.% of implementation of automateddocument management solution –pilotFull roll-out of automated DocumentManagement solution100%20%100% completed in Q20%Not rollout due to budgetary constraintsDeveloped and implementintegrated and efficientsystems and effectiveprocesses% completion of electronic recordsmanagement system40%100% solution wasdeveloped in share pointEDRMS not rolled out due to budgetaryconstraints hence the implementation ofshare point3030<strong>Annual</strong> <strong>Report</strong> 2010 / 2011
SECTION 3: REPORT ON THE PERFORMANCE OF PROGRAMMESOutputs/ key deliverables Performance Indicators <strong>Annual</strong> TargetActual achieved againsttargetReasons for DeviationsProvide the correctinformation to citizens atthe first point of contact byprogressively increasing firstcall resolutionExpansion of service channels.80%Access throughtelephone call, selfservice, e-mail, walkin centres, sms,portal and web chat80%Introduced contact centreout-bound campaigns, faxesand e-mail, 2nd walk-incentre launched: MaponyaThusong Professional JobCentre<strong>GDF</strong> website was re-launchedand provided access tothe social media platformslike Facebook, Twitter andLinkedIn.Number of reviewed and signed –offSLAs11 SLAs Reviewedand signed11 SLAs Reviewed andsignedThe monthly tracking of customersatisfaction levels and resolving ofcustomer dissatisfaction80% Customersatisfaction75%The problem with SLA reporting impactson customer satisfaction i.e. theprojects on improving the reporting ofperformance information is a majordependency<strong>Gauteng</strong> Department of Finance31
SECTION 3: REPORT ON THE PERFORMANCE OF PROGRAMMESKEY ACHIEVEMENTS• All Service Level Agreements were signed;• Call Centre capacity was developed successfully;• Call Centre was relocated successfully to <strong>GDF</strong> main offices at 75 Fox Street,JohannesburgOUTLOOK FOR THE YEAR AHEAD(2011/2012)• <strong>Gauteng</strong> Premier Hotline Project launch• Improve customer satisfaction by 5%Strategic objectives• To provide proactive strategic and operational institutional support tostakeholders, thus enabling them to deliver quality services.• To ensure effective and efficient management of the <strong>GDF</strong> and its programmesMeasurable Objectives• To optimise communication with <strong>GDF</strong> clients and other stakeholders; whileensuring access to information by client departments and citizens in general.• To ensure a constant flow of accurate and timely information between themanagement and staff.1.10. Sub-programme 8: Communication ServicesPurpose• To bring clarity to what the <strong>GDF</strong> stands for among its many stakeholders andto enhance the reputation of department by communicating in a strategic andconsistent way.3232<strong>Annual</strong> <strong>Report</strong> 2010 / 2011
SECTION 3: REPORT ON THE PERFORMANCE OF PROGRAMMESPerformance against output targetOutputs/ keydeliverablesPerformance Indicators <strong>Annual</strong> Target Actual Achievement against target Reasons for Deviations% queries through Client On-sitequery resolution roadshows% queries through Public On-sitequery resolution roadshows20 Client On-site queryresolution roadshows30 Public On-site queryresolution roadshows21 Client On-site query resolution roadshows10 <strong>GDF</strong> Public Onsite roadshows conducted,partnering with the Office of the PremierThe number of roadshowsconducted are dependenton the Office of the Premieras the custodians of PublicOnsite roadshowsOptimisedcommunication andaccess to informationNumber of newsletters published6 newsletters published10 Newsletters published1 News letter printed and published9 Electronic newsletters published% Increase in the use ofelectronic platforms forcommunication10% Increase in the useof electronic platforms forcommunicationIntranet was re-launched for the Department ofFinance during the 3rd Quarter 2010/11 and<strong>Report</strong>s, documents, strategic plans, forms andtemplates were uploaded on the intranet forusage and accessibility for the staff.<strong>GDF</strong> website was re-launched and providedaccess to the social media platforms likeFacebook, Twitter and LinkedIn.Promote and enhancerelationships andpartnerships; and thebrand identity andimage of the <strong>GDF</strong><strong>Annual</strong> stakeholder perceptionsurveyBrand perception surveyYear-on-year increasein the stakeholderperceptionYear-on-year increase inthe <strong>GDF</strong> brand perceptionNot achieved<strong>Annual</strong> surveys not conducted100% Implementation of a ComprehensiveStakeholder management Programme and<strong>Annual</strong> Calendar of eventsNo stakeholder perceptionsurvey conducted due tobudgetary constraints.<strong>Gauteng</strong> Department of Finance33
SECTION 3: REPORT ON THE PERFORMANCE OF PROGRAMMESOutputs/ keydeliverablesPerformance Indicators <strong>Annual</strong> Target Actual Achievement against target Reasons for Deviations% Progress on implementationof a Comprehensive Stakeholdermanagement Programme and<strong>Annual</strong> Calendar of eventsTimely publication of prescribedlegislative documents e.g. <strong>Annual</strong><strong>Report</strong>, MTBPS, SERO, PERO, etc.100% Implementationof a ComprehensiveStakeholder managementProgramme and <strong>Annual</strong>Calendar of eventsTimely publication ofprescribed legislativedocuments e.g. <strong>Annual</strong><strong>Report</strong>, MTBPS, SERO,PERO, etc.100% Implementation of a ComprehensiveStakeholder management Programme and<strong>Annual</strong> Calendar of eventsTimely publication of prescribed legislativedocuments e.g. <strong>Annual</strong> <strong>Report</strong>, MTBPS, SERO,PERO, etc.1.11. Sub-programme 9: Strategy Management & Monitoring& EvaluationPurpose• To drive the development and implementation of departmental strategy andrender strategic support that contributes to operational excellence.Strategic objectives• To ensure effective and efficient management of the <strong>GDF</strong> and its programmes.• To provide proactive strategic and operational institutional support tostakeholders, thus enabling them to deliver quality services.• To be a Centre of Excellence in the public sector in strategic and innovativeinformation solutions.Measurable Objectives• To manage organisational transformation to becoming an effective andinterventionist Department of Finance through the development andmanagement of relevant strategies, sound tactical plan and establish a resultsmeasurement and feedback system.• To implement quality management and business process management BestPractices to improve service delivery.• To create Centres of Excellence (COE) that leverage existing capacity andresources to enable GPG to collaborate across disciplines and institutions, onstrategic projects relevant to enhancing the developmental state.3434<strong>Annual</strong> <strong>Report</strong> 2010 / 2011
SECTION 3: REPORT ON THE PERFORMANCE OF PROGRAMMESPerformance against output targetsOutputs/ KeydeliverablesPerformance Indicators <strong>Annual</strong> Targets Actual achievement against target Reasons for deviations% Progress on Plannedcontribution to POAAchieved 100%planned contribution toPOA100%<strong>Annual</strong> Performance Plan approved and submitted to BudgetManagement Unit for submission to National <strong>Treasury</strong> as well asthe <strong>Provincial</strong> LegislatureTracked implementation of POA – <strong>GDF</strong> contributionDevelop relevantstrategies, soundtactical plans and afeedback mechanismdriven by resultsM&E systems.% <strong>GDF</strong> strategiestranslated into businessplanning and resourceallocation processes(incl. Funding)% Progress in M&EProject deliveryAll <strong>GDF</strong> strategiestranslated into businessplanning and resourceallocation processes(incl. Funding)Institutionalised M& EsystemsRevised <strong>GDF</strong> Strategic Plan to ensure that strategies translatedinto business planning and resource allocation processes<strong>GDF</strong> specific outcome based M&E systems was developed andapproved internallyM&E Systems implementation 0%Planned automation ofM&E system.Delayed by the needto address technicalissues: serverreconfiguration andreloading of SASinformation<strong>Gauteng</strong> Department of Finance35
SECTION 3: REPORT ON THE PERFORMANCE OF PROGRAMMESOutputs/ KeydeliverablesPerformance Indicators <strong>Annual</strong> Targets Actual achievement against target Reasons for deviationsImplement QualityManagement andBusiness ProcessManagement BestPractices to improveservice delivery.% Progress in ISO 9001Project delivery.% Progress in ServiceDelivery ImprovementPlanISO 9001 Certification –HR Processes100% Progress onService DeliveryImprovement100%All core procure to pay processes were identified and mapped9 improvement projects facilitated (150%) annual target 6Procure to Pay was ISO 9001:2008 certified<strong>GDF</strong> consolidated and implemented Service DeliveryImprovement Plan (SDIP) implementedCreate COE’s thatleverage existingcapacity andresources to enablecollaboration onstrategic projectsacross disciplinesand institutions.% Progress in KnowledgeManagement systemProject delivery.Implemented a<strong>GDF</strong> KnowledgeManagement systemBlueprint Developed: Communities of Practice120% - 5 Seminars Coordinated; target was 33636<strong>Annual</strong> <strong>Report</strong> 2010 / 2011
SECTION 3: REPORT ON THE PERFORMANCE OF PROGRAMMESOutputs/ KeydeliverablesPerformance Indicators <strong>Annual</strong> Targets Actual achievement against target Reasons for deviations% Progress in InnovationProjectsCompleted 6 InnovationProjects4 Ideas driveFacilitated access of payslips through ESSFacilitated access of IRP5s through ESS.Note: The COI’s collaboration with Finance/ HR made the abovetwo projects possible. The projects reduced the use of papersand ink printings and further increased self service in ESS andas a result, staff consultations with HR/Finance concerningIRP5s and Payslips accessBusiness Unit impactedby resignations andmoratorium on filling ofvacancies% Progress in ResearchProjectsResearch reportsproduced forspecific Programmerequirements14 R&D projects completed:• Succession planning• Open Source System• Project management culture• Hire-to-Retire benchmarking and best practice• Contact centre benchmarking• <strong>GDF</strong> readiness assessment (hybrid shared services model)• Service Delivery Improvement Plan• E-Recruitment for <strong>GDF</strong>• Fraud and Corruption• Stewardship and governance• International Risk Management Case studies• Feasibility Study <strong>Report</strong> for M&E• Qualifications Identification Exercise for Matching and Placing• Analysis of Embracing Sound Records Management<strong>Gauteng</strong> Department of Finance37
SECTION 3: REPORT ON THE PERFORMANCE OF PROGRAMMESREASONS FOR MAJOR VARIANCESThe following projects were not implemented due tobudgetary constraints and reprioritisation.• Lean Six Sigma;• Knowledge Exchange Programme;• Facilitation of innovation culture and ideationdrive.OUTLOOK FOR THE YEAR AHEAD(2011/2012)During the 2011/12 financial year the Centre ofInnovation sub-program will focus on driving thedevelopment and implementation of innovation.To innovation render support that contributes tooperational excellence. To manage organisationaltransformation in order to becoming an effective andinterventionist Department of Finance, through theinnovation and management of processes.• The Centre of Innovation will focus on supportingstrategic decision making and operationalprocesses innovation.• Knowledge and Information Managementwill continue to provide a framework andtools for effective knowledge and informationmanagement, in order to build and enhance the<strong>GDF</strong>’s institutional memory and facilitation ofknowledge sharing.1.12. Sub-programme 10: SecurityServicesPurpose• Security Services forms part of Corporate Services.Strategic Objectives• To provide proactive strategic and operationalinstitutional support to stakeholder, thus enablingthem to deliver quality servicesMeasurable Objectives• To provide an effective and efficient securityservice and to protect proprietary and physicalassets, human capital and integrity to <strong>GDF</strong>.KEY ACHIEVEMENTSDuring the course of the financial year, Security Servicesfocused on physical security discipline which entail theguarding and the physical protection of the <strong>GDF</strong> assets.Security Services was re-structured to include a furthertwo disciplines, namely; information management andintegrity management. These changes were broughtabout to bring <strong>GDF</strong> security in line with the minimuminformation security standards and national securitydirectives. Information management entails IT securitymanagement and Integrity management is to ensurecompliance with national security standards.New uniforms were purchased to improve the corporateidentity of the organisation.3838<strong>Annual</strong> <strong>Report</strong> 2010 / 2011
SECTION 3: REPORT ON THE PERFORMANCE OF PROGRAMMESPerformance against output targetsOutputs/ keydeliverablesPerformance Indicators<strong>Annual</strong> TargetActual Achievement againsttargetReasons for DeviationsAutomation, Integrationand upgrading ofsecurity systemsAutomation, Integration andupgrading of security systems<strong>Report</strong> on the feasibilitystudy BPA reportProject put on holdTSS Resources had to redirected tothe <strong>Gauteng</strong> on line projectConduct Security RiskAssessmentsConduct security Riskassessments7 Risk Assessments6 conducted annually: 1 SAPS, 1State Security Agents ( previouslyknown as NIA), 1 <strong>Gauteng</strong> AuditServices (GAS) and 3 conducted bySecurity Services UnitChanging reporting lines withinthe Security Services Unit affectedthe implementation of 1 RiskassessmentSecurity SystemsmaintenanceSecurity Systems maintenanceBuilding Hardware to beupgradedSecurity Systems: CCTV and Accesscontrol upgradedSecurity Awareness Security Awareness 8 sessions and inductions8 sessions held with SMS members- security vetting and in staffinductionsStaff Development(performancemanagement)Staff Development (PerformanceManagement)100% of staff per quarter 90% (bursaries and training) Budgetary constraints<strong>Gauteng</strong> Department of Finance39
SECTION 3: REPORT ON THE PERFORMANCE OF PROGRAMMES<strong>Treasury</strong> Services2. Programme: SUSTAINABLE RESOURCEMANAGEMENTPurposeThis programme aims to optimise resource allocation, utilisation and revenue tomaximise the net social benefit to the citizens of <strong>Gauteng</strong>.The Programme consists of four sub-programmes:• Fiscal Policy and Economic Analysis• Budget Management• Public Finance• Public Private PartnershipsStrategic ObjectivesThe key Strategic Objectives of the Programme:• To be known as the producers of cutting edge finance and economic solutions;• To ensure credible financial and non-financial reporting;• To facilitate, advice and support the alignment and integration of planning anddelivery in the province;• To effectively manage the budgeting process for the province;• To manage and oversee the implementation of strategic financing solutions;• To institutionalise tools to inform the constraints, growth opportunities andallocation processes;• To ensure the effective and efficient management of the programme;• To attract highly skilled and competent people and foster high performance.4040<strong>Annual</strong> <strong>Report</strong> 2010 / 2011
SECTION 3: REPORT ON THE PERFORMANCE OF PROGRAMMES2.2 Sub-Programme: Programme SupportThe aim of this sub-programme is to render an efficient and co-ordinated management service to the programme.Performance against output targetsOutputs/ Key Deliverables Performance Indicators <strong>Annual</strong> TargetActual Performance againstOutput targetReasons fordeviationsQSR ManagementStakeholder surveyQuarterly ServicePerformance<strong>Report</strong>Policy ImplementedQuarterly Sustainable ResourceManagement Stakeholder survey.Quarterly Service Performance<strong>Report</strong>Status in implementation of policyframework to guide strategicpartnering initiativesQuarterly stakeholder survey tomonitor customer satisfaction byunitQuarterly Service Performance<strong>Report</strong>Consolidate above to SRM level andevaluate and identify gaps.Implemented policy framework forSRM to guide strategic partneringinitiativesNot doneNot doneThese targets wereto be implementedby the then <strong>Treasury</strong>and are some of thechanges encountereddue to the <strong>GDF</strong>reconfigurationprocessSRM policy ReviewedEvidence, through reporting, ofspecific policy, process and systemenhancementReview SRM policy, processes andsystems and identify areas requiringenhancement and implementchangesNot done<strong>Gauteng</strong> Department of Finance41
SECTION 3: REPORT ON THE PERFORMANCE OF PROGRAMMESOutputs/ Key Deliverables Performance Indicators <strong>Annual</strong> TargetUpdating <strong>Annual</strong> riskmanagement strategy andpolicies,Service Level AgreementsImplementedMonthly and year-end closuresubmissions to National<strong>Treasury</strong>Aligned sub-programmeplanning, budgeting,performance (M&E) andreporting processesModern budgeting andcontrol techniques effectivelyimplemented in unitImplementation of enhancedPerformance Managementprocess and practicesStatus in the development andimplementation of a comprehensiveRisk Management Strategy for<strong>Treasury</strong>Implemented Service LevelAgreements for all programmesuppliersQualitative and timeous submissionsto National <strong>Treasury</strong> including monthlyand year end closures Number ofMonthly and year-end closure timeoussubmissions to National <strong>Treasury</strong>Aligned sub-programme planning,budgeting, performance (M&E) andreporting processesModern budgeting and controltechniques effectively implemented inunitImplementation of enhancedPerformance Management processand practices<strong>Annual</strong> updating of <strong>Treasury</strong> riskmanagement strategy and policies,Implemented Service LevelAgreements for all programmesuppliers12411Actual Performance againstOutput targetNot doneNot done12 IYM and POA submitted toNational <strong>Treasury</strong> as well asthe Legislature4 Quarterly <strong>Report</strong>s as well asAPP submitted that is alignedwith the objectives of the subprogrammeand projects thatare budgeted forBudget process adheredto in compliance with thedepartmental rulesPerformance agreementsfinalisedReasons fordeviations4242<strong>Annual</strong> <strong>Report</strong> 2010 / 2011
SECTION 3: REPORT ON THE PERFORMANCE OF PROGRAMMES2.3 Sub-programme: Fiscal Policy andEconomic AnalysisPurposeThe aim of this sub programme is to maximise currentrevenue sources and optimise potential new revenuestreams; to develop and implement a comprehensiveprovincial revenue strategy; to provide advisory servicesto relevant stakeholders on fiscal policy matters andthe medium term fiscal framework; and to provideprovincial socio-economic research and analysis inorder to inform resources allocation and utilisation.Strategic Objectives• To be known as a producer of cutting edge financeand economic solutions;• To ensure credible financial and non-financialreporting;• To facilitate, advice and support the alignmentand integration of planning and delivery in theprovince;• To effectively manage the budgeting process forthe province;• To manage and oversee the implementation ofstrategic financing solutions;• To institutionalise tools to inform the constraints,growth opportunities and allocation processes;• To ensure the effective and efficient managementof the sub-programme.Measurable Objectives• Monthly and quarterly updated informationavailable from Sub-programme;• Detailed revenue reports produced for Legislature;• Provide inputs to the pre-benchmark presentationto Public Finance;• Quarterly and Bi-annual own revenue forumsfunctioning;• Share best practices on revenue management;• Produce revenue analysis report for the BudgetStatement;• Produce socio-economic analysis report for thebudget statement;• Produce the performance of the provincialeconomy report for the budget statement;• Investigate/assess new revenue sources;• Inform the Medium Term Framework;• Credible and reliable source of financial andeconomic information;• Econometric Modelling & Impact Analysis <strong>Report</strong>s(Using CGE & SAM Model);• Weekly Newsletters & Quartely Bulletin.• Reservoir of economic information;• Credible revenue projections submitted;• <strong>Annual</strong> assessment report on credible revenueprojection;• Tariff review requests approved;• Analysing of GPG debt position;• On-going interaction with NT, FFC on the review ofthe PES;<strong>Gauteng</strong> Department of Finance43
SECTION 3: REPORT ON THE PERFORMANCE OF PROGRAMMESOutputs/ key deliverables Performance Indicators <strong>Annual</strong> Target<strong>Report</strong> in the BS1 SubmittedInform the Medium TermFramework3 Workshops with revenuecollecting departmentsCredible and reliable sourceof financial and economicinformationCredible and reliable sourceof financial and economicinformationWeekly Economic Newslettersand Quarterly Bulletins (QB)Econometric modelling andimpact analysis reports (usingCGE & SAM models)Budget Statement Socio-Economic <strong>Report</strong> for theBS1Timely Published reporttabled at the <strong>Provincial</strong>LegislatureQuarterly workshops andpresentations1 Socio-Economic <strong>Report</strong>produced and submittedActual performance againstannual targetBudget Statement Socio-Economic<strong>Report</strong> for the BS1 completed2010 MTBPS published 2010 MTBPS published3 Workshops held 1 Workshop with Department ofRoads and Transport heldPERO publication 2010 PERO published 2010 PERO publishedSERO publication 2011 SERO published 2011 SERO publishedTimely Published <strong>Report</strong>s47 Economic Newsletters4 Quarterly Bulletins47 Economic Newsletters2 Quarterly BulletinsSimulation reports 2 Simulation reports 1 Simulation reportsReasons for deviations2 workshops with Departmentof Economic Development andHealth and Social Developmentwere not held due to staffshortageThe unit could not produce 4Quarterly bulletins because ofthe shortage of personnelShortage of trained personnelto run the model4444<strong>Annual</strong> <strong>Report</strong> 2010 / 2011
SECTION 3: REPORT ON THE PERFORMANCE OF PROGRAMMESPerformance against Output targetsOutputs/ key deliverables Performance Indicators <strong>Annual</strong> TargetMonthly and quarterly updatedinformation available fromSub-programmeDetailed revenue reportsproduced for LegislatureProvide inputs to the prebenchmarkpresentation toPublic Finance<strong>Report</strong> in the BS1 SubmittedQuarterly revenue forum formain revenue generatingdepartmentsBi-annual own revenue forumfor small revenue generatingdepartmentsSubmission of all monthlyand quarterly reportsFour quarterly revenuereports produced forLegislaturePreparation of prebenchmarkpresentation toPublic FinanceAnalysing of provincialreceipts (national transfersand own revenue)Main own revenue forumsfunctioningBy-annual own revenueforums functioning8 monthly and 4 quarterlyreports submitted4 revenue reports produced forLegislature consolidated for theprevious financial yearOne detailed revenue reportpresented at national treasurybenchmarks1 Revenue analysing provincialreceipts (national transfers andown revenue) report completed4 Own revenue forums meetingand discussions held2 Bi-annual own revenue forummeetings heldActual performance againstannual target8 monthly and 4 quarterly reportssubmitted4 Quarterly reports producedPresentation (Benchmark)Analysis of provincial receipts(national transfers and ownrevenue) was submitted4 Own revenue forums meetingand discussions held1 Bi-annual small revenueforum meeting heldReasons for deviations1 Bi-annual small revenueforum meeting was not helddue to staff shortage.<strong>Gauteng</strong> Department of Finance45
SECTION 3: REPORT ON THE PERFORMANCE OF PROGRAMMESOutputs/ key deliverables Performance Indicators <strong>Annual</strong> TargetOn-going interaction with NT,FFC on the review of the PESDebt management reportdevelopmentTariff review requestsapprovedShare best practices onrevenue managementTimeous comments on theFFC recommendationsAnalysing of GPG debtpositionReview and approve tariffrequest submittedInteract with provincialtreasuries and National<strong>Treasury</strong>Contributed to the DORA and theFFC discussion on the <strong>Provincial</strong>Equitable Share1 <strong>Report</strong> was produced with thelatest debt numbers2 tariff requestApprovedimprovement of revenuecollection within provincesActual performance againstannual targetResponse to the Stakeholderinterview questionnaire on theFFC’s role & mandate.Provided comments on behalf ofthe LegislatureDraft Debt <strong>Report</strong> producedResponded on the reviewed tariffsfor Boekenhoutkloof Traffic CollegeResponse for Case ManagementservicesApproval to Health UTFS TariffsMeeting held on the 23 March2011 at National <strong>Treasury</strong> onunpaid claims from other provinces<strong>Gauteng</strong> CFO Forum attendedRTA fees due to <strong>Gauteng</strong>Comments on sponsorship for<strong>Gauteng</strong> Sport Awards 2011Request for site visits to DLTCDraft Progress report on outdooradvertising: roadsReasons for deviations4646<strong>Annual</strong> <strong>Report</strong> 2010 / 2011
SECTION 3: REPORT ON THE PERFORMANCE OF PROGRAMMESKEY ACHIEVEMENTSAs part of the turnaround strategy of the MEC for Healthand Social Development, the Unit prepared a researchreport with clear recommendations on improvingrevenue management processes in the department.Furthermore, funding was made available for theimplementation of an electronic data interface to assistthe Department of Health and Social Development insubmitting electronic bills to Medical Aid Schemes.The project has been implemented in 14 provincialhospitals and patient records management andrevenue collection has improved significantly.<strong>Annual</strong> publications such as <strong>Provincial</strong> Economic Reviewand Outlook (PERO) and the Socio-Economic Reviewand Outlook (SERO) were published as per set targets.The objective of these publications is to provide a wellresearched review and outlook of the provincial economyfor policy decisions to have a point of reference. Inaddition, the Medium Term Budget Policy Statement(MTBPS) which outlines priorities of the provincialgovernment over the next three years was tabled atthe <strong>Provincial</strong> Legislature. Furthermore, a conferencedealing with the PERO and MTBPS was hosted.A revenue projections model for motor vehicle licensingfees was successfully piloted with the participation ofNational <strong>Treasury</strong>. This model has now been extendedto other provinces and will be used in the projections ofmotor vehicle revenue collection.REASONS FOR MAJOR VARIANCESA number of key staff members resigned or weretransferred to other government departments anda strategic decision was made to concentrate on themajor outputs of optimisation of own revenue, MTBPS,SERO and PERO. This decision resulted in the unitmanaging to publish only 2 Quarterly Bulletins outof the 4 which was required. Only one simulationreport was completed because of the shortage ofstaff and lack of training for the remaining staffmembers.OUTLOOK FOR THE YEAR AHEAD(2011/2012)The process of recruitment has been completed andthe unit will be filling vacant posts in the near future.This should help the unit run processes normally. Themajor publications will be produced and conferencesheld at appropriate times. In addition the major outputsof the unit of optimising own revenue will be prioritisedwith all workshops, consultations and forums held toensure revenue management and enhancement. At fullcapacity, the unit will be able to produce the 4 QuarterlyBulletins and with the training of staff on the CGEmodel, impact studies will be completed. Focus will bemainly on consolidating on previous achievements andensuring that challenges encountered are effectivelyaddressed.2.4 Sub-programme: BudgetManagementPurposeThe aim of this sub-programme is to allocate resourcesin an optimal and transparent manner that is aligned tonational and provincial priorities and addresses equity,need and spatial development; and secondly to implementbudget reforms that enhance budgeting processes in theprovince and enshrine the stochastic nature of budgeting.Strategic Objectives• To ensure financial and non-financial reporting;• To facilitate, advice and support the alignmentand integration of planning and delivery in theprovince;• To manage effectively the budgeting process forthe province;• To institutionalise tools to inform the constraints,growth opportunities and allocation processes.Measurable Objectives• Ensure financial and non-financial reporting;• Facilitate, advice and support the alignment andintegration of planning and delivery in the province;• Manage effectively the budgeting process for theprovince;• Institutionalise tools to inform constraints, growthopportunities and allocation processes.<strong>Gauteng</strong> Department of Finance47
SECTION 3: REPORT ON THE PERFORMANCE OF PROGRAMMESOutputs/ keydeliverablesAccurate provincialbudget databasePerformance Indicators<strong>Annual</strong> TargetActual performance against <strong>Annual</strong>targetThe project was developed butstopped near completion.Reasons for deviationsQuarterly monitoringreportTimeous, qualitativeand accurate legislatedsubmissions (QPR ,IYM,Sec 40 of the PFMA,provincial gazette, Sec32 of the PFMA) fromdepartments to NT(monthly and quarterly)Quarterly reports ontraining and handson support providedto departments andmunicipalitiesEvidence of an accurateprovincial Budget DatabaseQuarterly report on monitoringand evaluation of functionalityand effectiveness of the BudgetDatabase systemEvidence of the timeous,qualitative and accuratesubmissions from departmentsto the NTEvidence of quarterly reportson training and handson support provided todepartments and municipalitiesEnhance the provincial BudgetDatabaseQuarterly report on monitoringand evaluation of functionalityand effectiveness of the budgetdatabase systemTimeous, qualitative andaccurateLegislated submissions(S32 of PFMA, QPR,APP, In- Year Monitoring, MainandAdjustment budget,<strong>Provincial</strong> Gazette interms of DoRA,reporting on provincialgazette) from departments andto NT(monthly, quarterly and annual)Quarterly reports ontraining and supportprovidedThe project was developed butstopped near completion.Consolidated the monthly IYM reportsand submitted to NTSubmitted the APPs to NT on time.Analysed and verified the submissionsand tabled the Adjustments Budget on26th November 2011.Analysed and verified thesubmissions. Submitted to NT ontime. Tabled the Main Budget on 01stMarch 2011.The <strong>Provincial</strong> Gazettes werepublished; on 21st January 2011(Adjustments Budget) and 14th April2011 (Main Budget).Feedback reports were finalized andemailed to departments, except forthe fourth quarter due to the highwork load during this quarter.Project discontinued due tofunds constraintsProject discontinued due tofunds constraintRecord of various trainingand support provided todepartment partially keptduring the MTEF budgetpreparation due to high workload versus limited staff andtime constraints4848<strong>Annual</strong> <strong>Report</strong> 2010 / 2011
SECTION 3: REPORT ON THE PERFORMANCE OF PROGRAMMESOutputs/ keydeliverablesPerformance Indicators<strong>Annual</strong> TargetActual performance against <strong>Annual</strong>targetReasons for deviationsTimeous and accurateIYM and QPR for the BMUnitMTEF and adjustmentbudgetDevelopment of thedatabase warehouseDocumented proceduresand processes for the BMunitQualitative and timeoussubmission to NT andHOD including monthlyand year-end closuresEvidence of timely submissionof accurate IYM and QPR forthe BM UnitEvidence of qualitativefeedback reports on 2010MTEF budgetEvidence of the MTEC reportto inform Executive decisionmakingAccurate, credible and timeousbudget data available throughthe data warehouseEvidence of documentedprocedures and processes forthe BM unitQualitative and timeoussubmission to NT and HODincluding monthly and year-endclosuresTimeous and accurate IYM andQPRTabling of an MTEF andadjustment budget that isinformed bygovernment prioritiesProduce the MTEC report toinform Executive decisionmakingTo ensure historicalaccurate, credible andtimeous budget data throughthe datawarehouseEnhanced unit processes andsystemsMonthly and quarterlySubmissions to HOD,National <strong>Treasury</strong> andSCOPA / Legislaturethat are qualitative andtimeously submittedMonthly IYM <strong>Report</strong>s and Quarterly<strong>Report</strong>s for the BM Unit weresubmitted on time.Adjustment Budget tabled on 26thNovember 2010 and the Main Budgettabled on 01st March 2011.MTEC reports were produced inNovember 2010Project discontinued due to fundsconstraintsDocumented MTEF budgetpreparation process. The <strong>GDF</strong>’sStandard Procedure Manual forMaintaining <strong>Provincial</strong> BudgetDatabase was issued during thefourth quarter.<strong>Report</strong>s were submitted on time.The Project was the lastphase of the Budget Databaseproject. This phase was notstarted due to the stoppedBudget Database project<strong>Gauteng</strong> Department of Finance49
SECTION 3: REPORT ON THE PERFORMANCE OF PROGRAMMESOutputs/ keydeliverablesPerformance Indicators<strong>Annual</strong> TargetActual performance against <strong>Annual</strong>targetReasons for deviationsModern budgeting andcontrol techniqueseffectively implementedin the unitEvidence of the implementationof modern budgeting andcontrol techniquesModern budgeting andControl techniquesEffectively implemented in unitThe unit successfully implemented theOutcome-Based Budgeting approachduring the 2011 MTEF budgetprocess.Evidence that staff memberssigned performanceagreements aligned to the SRMstrategyAll staff have SignedPerformanceagreements, aligned to the SRMstrategyPerformance Agreements signed by allthe members of the unit.Enhancement in theperformance of staffEvidence that performanceappraisals are completed4 Quarterly performanceAppraisals for all staffQuarterly Performance Appraisalsdone for all 4 quarters.Quarterly reports of <strong>Annual</strong> Reviewsto be provided in the interim whileawaiting a summary report ofappraisals by Friday 21/07/2011)Evidence that performance ofstaff members is enhancedImplementation of enhancedPerformance Managementprocesses and practicesRegular output reports submitted toHead of the Unit.Implementation of 2010MTEF BudgetEvidence that the 2010 budgethas been captured on BAS bydepartmentsEnsured capturing of the 2010main budget on BASBudget capture Certification receivedfrom departmentsEffective managementof the provincial budgetprocessEvidence that the provincialbudget process is managedeffectively<strong>Annual</strong> tabling of main budget2011/12 Main Budget was tabled atthe Legislature on 01 March 2011.5050<strong>Annual</strong> <strong>Report</strong> 2010 / 2011
SECTION 3: REPORT ON THE PERFORMANCE OF PROGRAMMESKEY ACHIEVEMENTSReview of the provincial budget processThe unit reviewed the provincial budget process andre-engineered it in a manner that allowed for smoothtransition to the implementation to the Outcomes-Based Budgeting; improved allocative efficiency interms of resourcing government outcomes. Undertight circumstances, where there was a significantincrease in the demands from top management and the<strong>Provincial</strong> Executive, the budget process was managedeffectively to accommodate all strategic requests thatwere informing service delivery.Timeous, qualitative and accurate legislatedsubmissionsThe unit is required by legislation, i.e. PFMA and<strong>Treasury</strong> Regulations, to submit on time the financialand non-financial performance reports to the National<strong>Treasury</strong>. Within the tight timeframes and operatingwith less human capacity, the unit successfullycompiled and verified the quality of reports and furthersubmitted the following to the National <strong>Treasury</strong>;• Monthly and quarterly financial and non-financialreports; i.e. In-Year Monitoring and QuarterlyPerformance <strong>Report</strong>s;• Analysed and quality checked departmental<strong>Annual</strong> Performance Plans;• Compiled and verified the Main and Adjustmentbudget submission of provincial departments;• Published in the gazette the indicative annualallocations per school in the province as well asthe budgets of all hospitals in the province, asrequired by the Division of Revenue Act of 2010.Implementation of the Outcomes-Based Budgetingfor the 2011 MTEFIn the 2010/2011 financial year, the Presidentannounced the adoption of the Outcomes Approachto service delivery. This required all departmentsto ensure that their MTEF plans and budgets wereoutcomes driven.The unit championed the process (in collaboration withthe <strong>Gauteng</strong> Planning Commission) of implementingthe Outcomes-Based Budgeting for the 2011 MTEF.To ensure that this was achieved, a comprehensiveresearch paper was tabled and adopted at the FinanceLekgotla held in July 2010. This new approach toplanning and budgeting was adopted in the courseof the financial year. The unit revised its plans andprocesses to ensure the implementation of the processthat would give effect to the new political directives.Main and Adjustment Budget ForumThe Main and Adjustment Budget Forum is a key forumwhere <strong>Treasury</strong> engages all provincial departmentson new budget reforms and trains and workshopsdepartments on the 2011 MTEF budget preparationguidelines. This forum is central in ensuring thatall provincial departments understand the budgetpreparation frameworks that guide the preparationand compilation of the 2011 MTEF budget. This forumwas successfully held over two days in August 2010.Medium-Term Expenditure Committee engagementsIn the past, the Medium-Term Expenditure Committee(MTEC) meetings were held in the form of one-on-onesessions between <strong>Treasury</strong> and individual provincialdepartments. For the purposes of ensuring allocativeefficiency and optimally funding the governmentoutcomes, the entire MTEC engagement process wasreviewed.The process was customised to ensure that thediscussions focused on the extent to which provincialdepartments will contribute and achieve thegovernment outcomes. Instead of one-on-one sessions,the engagements were attended by the departmentprimarily responsible for a particular outcome,including departments that were regarded as supportdepartments. The Committee was also reviewed andconstituted representations from the <strong>Gauteng</strong> PlanningCommission, the Office of the Premier and the National<strong>Treasury</strong>.PBC engagementsThe Premier Budget Committee (PBC) is the highestresource allocation Committee in the province convenedby <strong>Treasury</strong>. The nature and character of the PBC wasalso reviewed to ensure that provincial departmentsmake submissions to the PBC demonstrating how<strong>Gauteng</strong> Department of Finance51
SECTION 3: REPORT ON THE PERFORMANCE OF PROGRAMMEStheir plans and budgets are reflective of their plan toachieve government outcomes. The scope and termsof reference of the PBC were crafted in a manner thatguided the provincial departments towards clear andspecific outputs that are linked to particular outcomes.The PBC was very successful in meeting its mandate asmost provincial departments were able to demostratehow they will implement their plans towards positivelyimpacting the lives of the <strong>Gauteng</strong> citizenry.Tabling of the 2010/11 Adjustments BudgetIn a financial year wherein state departments preparedtheir budgets based on the government priorities, andthere was a change towards outcomes focus, the Uniteffectively managed the entire process of makingbudget adjustments in order to re-align the availablebudgets with the government outcomes. This changewas well-managed within the legislated time of tablingan adjustment budget two weeks after the nationaladjustment budget.Tabling of the 2011/12 MTEF BudgetTaking into account the more detailed work that had tobe done in order to fully allocate financial resources tokey departmental outputs and the process of ensuringthat provincial departments’ budgets talk to theachievement of the outcomes, the Unit meticulouslymanaged the entire process. The management ofthe provincial process is crucial in ensuring that theprovincial budget is compiled, interrogated and finallytabled before the <strong>Gauteng</strong> Legislature. The Unit hadinitially planned that the MEC will table the provincialbudget at the Legislature on 04th March 2011, howeverdue to other unavoidable circumstances the date wasbrought earlier to 01st March 2011. This brought morepressure to the Unit and the already tight provincialprocess. Notwithstanding these significant factors, theUnit successfully managed the process, added moreeffort and time and the MEC did table the provincialbudget on 01st March 2011.OUTLOOK FOR THE YEAR AHEAD(2011/2012)The Public Finance Management Act (PFMA) gives theDepartment of Finance a mandate of preparing theprovincial budget. In order to achieve this mandate,different tools and process are and will be implementedtowards the tabling of the 2012 MTEF provincialbudget. One of the key strategic objectives is to developcutting edge funding and budgeting solutions. TheUnit will conclude the development of and implement(pilot approach) the Budget Database system whereGPG departments will capture their Adjustment andMTEF budgets online, thereby reducing the paperworkthat is currently being used. The implementation ofthis system will yield the following high level benefits;quality assurance in terms of budget data integrity,timely budget submissions; conformity with provincialand national budget presentation standards; as well astime reduction due to automation of the consolidation,data clearance and approval processes.In line with the implementation of the OutcomesApproach, the Unit will continue with research onbest practices on the Outcomes-Based Budgeting.In addition to this, training and assistance will beprovided to all provincial departments in terms ofperforming detailed personnel costing as other phaseinprojects within the Outcomes-Based Budgetingframework.There will be continuous review and improvementof the provincial budget process to strengthen itseffectiveness in driving the provincial planning andbudgeting process, monitoring and evaluation of publicspending or service delivery. Timelines for departmentaland provincial reporting on financial and non-financialdata will be strengthened in order to give effect to theprescribed public service legislations, i.e. the PFMAand the Division of Revenue Act (DoRA). The keyfactors that will ensure these are; firstly, to ensure thatdepartments’ internal processes are aligned with theprovincial processes; secondly, to ensure that financialand non-financial information contained in the reportsis reliable, accurate and credible to inform national andprovincial policy-making decisions. In addition to thesereporting requirements, the Department of Financewill together with the Planning Commission developsystems/ tools for reporting on the financial and5252<strong>Annual</strong> <strong>Report</strong> 2010 / 2011
SECTION 3: REPORT ON THE PERFORMANCE OF PROGRAMMESnon-financial performance in line with the provincialProgramme of Action. This will strengthen the linkagesbetween spending and service delivery and ultimatelythe achievement of the provincial outcomes over thelong-term.The Unit will continue to progressively review thenature and composition of the Finance Lekgotla, theBudget Forum, MTEC and PBC engagements. Thesefora are key in taking policy decisions, setting theservice delivery tone and management of transversalprocesses as well as discussions on how such policydecisions will be implemented within the prevalenceof fiscal limitations. There will be implementation ofcluster-based MTEC meetings to promote cohesiveand synchronized planning and policy discussions. TheMTEC will continue to be a platform where plans andbudgets are discussed in an integrated manner, usingclusters, and recommendations are made to the PBC interms of the best policy alternatives in enhancing andfast tracking the delivery of public services.2.5 Sub-programmes: Public FinancePurposeTo ensure effective utilisation of provincial resourcesthrough monitoring and evaluation of departmentalbudgets and service delivery.Strategic Objectives• To ensure efficient budget implementation;• To strengthen financial management andreporting in the province by improving accuracyand credibility of expenditure information;• To consolidate a comprehensive performancereporting system that meets the needs of allrelevant stakeholders;• To monitor, advise and support infrastructuredelivering departments with implementation oftheir Infrastructure Delivery and ImprovementProgramme (IDIP).Measurable Objectives• Timeous and accurate information available fromPublic Finance.;• Number of sectoral reports completed andpresented to departments and one consolidatedreport to legislature;• Submitted Cabinet memorandum to ExecutiveCouncil;• Infrastructure <strong>Report</strong>ing Model submitted toNational <strong>Treasury</strong>;• <strong>Report</strong> on the performance of conditional grantsin compliance to the conditional grant framework;• Training and hands on support to departments;• Quarterly reports on the infrastructure site visitssubmitted to senior management;• Budget report to MTEC;• Benchmark tool enhanced and presented atNational <strong>Treasury</strong>;• Prepare chapter for MTBPS on expenditure andsubmit adjustment budget inputs;• Infrastructure plans produced and coordinatedappropriately;• Content analysis of the estimates of capitalexpenditure conducted and published;• Modern budgeting and cost containmenttechnique effectively implemented in the province;• Staff Performance Management.<strong>Gauteng</strong> Department of Finance53
SECTION 3: REPORT ON THE PERFORMANCE OF PROGRAMMESPerformance against Output targetsOutputs/ key deliverables Performance Indicators <strong>Annual</strong> TargetActual performance against <strong>Annual</strong>targetReasons for deviationsTimeous and accurateInformation available from PublicFinanceMonthly, quarterlyUpdated informationavailable from sub-programmeMonthly, quarterly updatedInformation available fromPublic FinanceAll reports submitted timeously asrequestedNumber of sectoral reportscompleted and presentedto departments and oneconsolidated report to legislatureAll sectoral reports completedand presented to departmentsand one consolidated report tolegislatureAll sectoral reports completedand presented to departmentsand one consolidated report tolegislature4 consolidated expenditures reportswere compiled and submitted to theLegislature.Submitted Cabinet memorandumto Executive Council.All Cabinet memorandum toExecutive CouncilMonthly and Quarterly reportson expenditure submitted toExecutive CouncilMonthly and Quarterly state offinances reports submitted toExecutive Council with specificrecommendations on revenue, cashand expenditure.Infrastructure <strong>Report</strong>ing Modelsubmitted to National <strong>Treasury</strong>Infrastructure <strong>Report</strong>ing Modelsubmitted to National <strong>Treasury</strong>Quarterly Infrastructure<strong>Report</strong>ing Model submitted toNational <strong>Treasury</strong>4 Quarterly Infrastructure <strong>Report</strong>ingModel were submitted to National<strong>Treasury</strong> including the planning IRMin line with the Division of RevenueAct.<strong>Report</strong>s on the performance ofconditional grants in complianceto the conditional grantframework for 2009/10<strong>Report</strong>s on the performance ofconditional grants in complianceto the conditional grantframework<strong>Report</strong> on the performance ofconditional grants in complianceto the conditional grantframework<strong>Annual</strong> evaluation reports forschedule 4 grants were submittedto National <strong>Treasury</strong> regarding theirperformance in line with Division ofRevenue Act.5454<strong>Annual</strong> <strong>Report</strong> 2010 / 2011
SECTION 3: REPORT ON THE PERFORMANCE OF PROGRAMMESOutputs/ key deliverables Performance Indicators <strong>Annual</strong> TargetTraining and hands on support todepartments<strong>Report</strong>s on the infrastructureand conditional grants site visitssubmitted to Senior ManagementBudget report to MTECBenchmark tool enhanced andpresented at National <strong>Treasury</strong>Prepare chapter for MTBPSon expenditure and submitadjustment budget inputsInfrastructure plans producedand coordinated appropriatelyHands on support todepartmentsConduct site visits and submitfeedback reportProduce the budget report toMTECProduce budget benchmarkpresentation based on the tooldevelopedSubmit MTBPS chapter andadjustment bookAll Infrastructure plans producedand coordinated appropriatelyHands on support todepartmentsConduct site visits and submitfeedback reportAssessments of MTEC reportsfor 2011 MTEFBenchmark tool andpresentationSubmit MTBPS chapter andadjustment bookAll Infrastructure plans producedand coordinated appropriatelyActual performance against <strong>Annual</strong>targetPublic Finance provided handson support to departments onexpenditure monitoring and costingtools.Site visits for conditional grants andinfrastructure visits were conductedand visual images were included inthe Estimates of Capital Expendituretabled by the MEC of Finance.All reports for the 2011 MTEF wereproduced by the unit in line withagreed performance outcomesProduced the benchmark tool andpresentation which confirmedcredibility of the 2011 MTEF for<strong>Gauteng</strong>Chapter on expenditure waspublished in the MTBPS and inputsprovided for the 2010/11 Adjustmentbook.All infrastructure plans (user-assetmanagement) were produced andsubmitted to National <strong>Treasury</strong> asrequired by 2010/11 Division ofRevenue Act.Reasons for deviations<strong>Gauteng</strong> Department of Finance55
SECTION 3: REPORT ON THE PERFORMANCE OF PROGRAMMESOutputs/ key deliverables Performance Indicators <strong>Annual</strong> TargetContent analysis of the estimatesof capital expenditure conductedand publishedModern budgeting and costcontainment techniqueeffectively implemented in theprovinceStaff Performance ManagementEnsure that estimates of capitalexpenditure are ready for tablingduring the budget dayDevelop and implementanalytical techniquesEvidenced enhancement in theperformance of staffEnsure that estimates of capitalexpenditure are ready for tablingduring the budget dayDevelop and implementanalytical techniquesAll staff have signedPerformance agreements,aligned to the SRM strategyActual performance against <strong>Annual</strong>targetEstimates of Capital of Expenditurewere produced and presented at theLegislature during the tabling of thebudgetBudgeting and cost containmenttechnique (unit costing model forschools) was developed.All staff have signed Performanceagreements, aligned to the SRMstrategy and performance reviewsconductedReasons for deviations5656<strong>Annual</strong> <strong>Report</strong> 2010 / 2011
SECTION 3: REPORT ON THE PERFORMANCE OF PROGRAMMESKEY ACHIEVEMENTSIn the period under review, the significant achievementwas the preparation of a paper on ‘Restoring FinancialDiscipline to <strong>Gauteng</strong> <strong>Provincial</strong> Government’ for theInaugural Finance Legkotla in July 2010 that outlinedinter alia, expenditure rules that would if enforced,result in more prudent management of financialresources. Criteria formulated for assessment of MTECsubmissions from departments in collaboration with<strong>Gauteng</strong> Planning Commission. The unit determinedpersonnel requirements for the 2011 MTEF for alldepartments to inform allocation of resources. Theimplementation of Occupation-Specific Dispensation(OSD) for educators and health workers continued inthe 2010/11 financial year, and key outputs duringthis period were reports analysing the cost implicationsof OSD based on existing staff complements for<strong>Gauteng</strong> Department of Education (GDE) and <strong>Gauteng</strong>Department of Health and Social Development. Astructured and detailed costing of the 2010/11financial year was undertaken with a view to ensuringthat departments remained within their allocatedbudgets.In terms of Budget Implementation and quarterlyassessment reports, the unit executed its fiduciaryresponsibilities with the necessary diligence, andconstantly consolidated monthly and quarterlyexpenditure reports, which contain a criticalanalysis of provincial state of finances with specificrecommendations to EXCO. For the MTEF andAdjustment Budget Analysis, the Medium TermExpenditure Committee Hearings for the 2011 MTEFwere conducted and reports subsequently submittedto the MTEC. The unit also analysed and respondedto all requests for roll-over of funds from the 2009/10financial year, which were part of the AdjustmentBudget tabled in November 2010. A chapter onexpenditure was also prepared for the 2010 Medium-Term Budget Policy Statement. Public Finance ensuredthat the Budget Benchmark exercise presentation wasprepared and delivered at National <strong>Treasury</strong>. The unitwas also instrumental in monitoring the implementationof Conditional Grants, which entailed ring-fecing ofcash on behalf of departments for the first time.Monitoring and facilitation of the Implementation ofthe Infrastructure Delivery Improvement Programme(IDIP) model phase 3 continued to be a major focusfor the unit. Significant deliverables also included theanalysis of 2011/12 User Asset Management Plans(U-AMP), formerly the infrastructure plans, beforeonward submission of U-AMPs to National <strong>Treasury</strong>,as well as the Infrastructure Delivery ImprovementProgramme (IDIP) Effectiveness and Risk Management<strong>Report</strong> to National <strong>Treasury</strong>. Planning InfrastructureDelivery <strong>Report</strong>ing Model (IRM) for all infrastructuredelivery departments were assessed and submitted toNational <strong>Treasury</strong>, as were the infrastructure plans forthe 2009/10 financial year.The unit also provided training to departments to aid inthe improvement of credibility of the IRM, with specificfocus on the use of Pivot Analysis Tool and TrendAnalysis Tool (TAT). In the period under review, theunit costing model was successfully deployed in theestimation of the costs of GDE Grade R classrooms,as well as the determination of the realistic costs ofbuilding a hitherto highly-priced primary school. PublicFinance ensured that the Executive InfrastructureManagement Committee (EIMC) and the <strong>Provincial</strong>Infrastructure Management Committee (PIMC) areproperly functioning. These management structureswere established to speed up the delivery ofinfrastructure in the province and to look at fundingand procurement issues. The unit also securedfunding for the development of the Web-based AssetManagement System and development of <strong>Gauteng</strong>Infrastructure Planning Tool on behalf of the <strong>Gauteng</strong>Planning Commission.REASONS FOR MAJOR VARIANCESLate submission by departments of budgetdocumentation that in many instances wasincomplete/did not have sufficient information to<strong>Gauteng</strong> Department of Finance57
SECTION 3: REPORT ON THE PERFORMANCE OF PROGRAMMESguide decision making by the MTEC Team. Credibilityof in-Year Monitoring (IYM) tool and other financialand non-financial reports provided by departmentsdue to misallocations and slow processing of invoices.Furthermore, business plans were in some casesnot submitted timely enough due to slow internalprocesses within departments. Getting buy-in fromGPG departments continues to be difficult, particularlywith regard to pressing and sensitive issues such ascost-cutting and reprioritisation.2.6 Sub-programme: Public andPrivate PartnershipPurposeThe aim of this sub-programme is to facilitate,manage and oversee successful PPP initiatives thatwill contribute to economic growth and development,create employment opportunities and promote enablingenvironment for infrastructure improvement.Strategic Objectives• To provide finance and economic solutions• To ensure financial and non-financial reporting• To facilitate, advice and support the alignment andintegration of planning and delivery in the Province• To manage effectively the budgeting process forthe Province• To manage and oversee the implementation ofstrategic financing solutions• To institutionalise tools to inform the constraints,growth opportunities and allocation processes• To attract highly skilled and competent people thatfoster high performanceMeasurable Objectives• Timely and accurate information available fromSub-programme;• Compliance to legislative requirements for PPP;• Quarterly reports on training and hands on supportto departments and municipalities provided;• Documented recommendations for alternativefinancing solutions to budget requests;• Quarterly report reflecting guidance provided toinfrastructure initiatives finding the best technical,financial and legal option to procure a project;• Participation in quarterly municipal CFO Forums toprovide guidance on PPP opportunities;• Year -on year increase in diversification and dealflow;• <strong>Annual</strong> report on PPP revenue initiatives;• Provide information for financial commitments onPPP projects;• Documented unit processes, procedures andsystems;• Aligned subprogram planning, budgeting,performance (M&E) and reporting processes andcontrol techniques effectively implemented in unit;• Implemented Service Level Agreements with allsubprogram suppliers.• Evidence of enhancement in the performance ofstaff;• Recognition of outstanding performers throughnonfinancial rewards.5858<strong>Annual</strong> <strong>Report</strong> 2010 / 2011
SECTION 3: REPORT ON THE PERFORMANCE OF PROGRAMMESPerformance against Output targetsOutputs/ key deliverables Performance Indicators <strong>Annual</strong> TargetTimeous and accurateInformation available from Subprogramme<strong>Report</strong> on regulatory adviceprovided on individual projectsQuarterly reports on trainingand hands on support todepartments and municipalitiesprovidedDocumented recommendationsfor Alternative financingsolutions to budget requestsQuarterly report Reflectingguidance Provided toinfrastructure initiatives findingthe best technical, financial andlegal option to procure a projectMonthly, quarterly Updatedinformation available fromsub-programmeCompliance to legislativerequirements for PPPQuarterly reports on trainingand support providedDocumentedrecommendations foralternative financing solutionsto budget requestsQuarterly report reflectingguidance provided toinfrastructure initiativesfinding the best technical,financial and legal option toprocure a projectMonthly, quarterly updatedInformation available from SubprogrammeConsolidated report on regulatoryadvice provided on PPP projectsQuarterly reports on training andhands on support to departmentsand municipalities providedDocumented recommendationsfor alternative financing solutionsto budget requestsQuarterly report Reflectingguidance provided toinfrastructure initiatives findingthe best technical, financial andlegal option to procure a projectActual performance against <strong>Annual</strong>targetAll reports submitted timeously asrequestedConsolidated report on regulatoryadvice provided on PPP projectsprovided (refer to section on keyachievements below)Quarterly reports on training andhands on support to departments andmunicipalities providedDocumented recommendations foralternative financing solutions to budgetrequests providedQuarterly report reflecting guidanceprovided to infrastructure initiativesfinding the best technical, financialand legal option to procure a projectprovidedReasons fordeviations<strong>Gauteng</strong> Department of Finance59
SECTION 3: REPORT ON THE PERFORMANCE OF PROGRAMMESOutputs/ key deliverables Performance Indicators <strong>Annual</strong> TargetParticipation in quarterly CFOForum – to provide guidance onPPP opportunitiesYear on year increase of PPPs invarious sectorsProduce a report on PPPrevenue initiatives supportingresearch on alternative sourcesof revenue.Provide information for Financialcommitments on PPP projectsDocumented unit processes,procedures and systemsParticipation in quarterly CFOForum -to provide guidanceon PPP opportunitiesYear -on year increase indiversification and deal flow<strong>Annual</strong> report on PPP revenueInitiativesProvide information forfinancial commitments on PPPprojectsDocumented unit processes,procedures and systemsParticipation in quarterly CFOForum – to provide guidance onPPP opportunitiesDiversified portfolio of PPP’s(Increase deal flow of PPP’s forprojects)New municipal PPP projectsprojected initiated, registered ,appraised and regulated in termsof TR16<strong>Annual</strong> report on PPP revenueinitiativesProvide information for Financialcommitments on PPP projects tofeed into the MTEF processEnhanced unit processes andsystemsActual performance against <strong>Annual</strong>targetParticipated in Municipal Mid YearPerformance and Financial Reviews(MPMA S72) for Emfuleni LM,Mogale,City LM and Randfontein LMTarget achieved as planned. Two newBlue IQ Projects registered<strong>Annual</strong> report on PPP revenue initiativesproducedTarget achieved- CHBH commitmentsreconfirmed as reflected on the MTEFProcess Flow Map on the Unit finalisedReasons fordeviations6060<strong>Annual</strong> <strong>Report</strong> 2010 / 2011
SECTION 3: REPORT ON THE PERFORMANCE OF PROGRAMMESOutputs/ key deliverables Performance Indicators <strong>Annual</strong> TargetAligned subprogram planning,budgeting, performance (M&E)and reporting processesModern budgeting andControl techniques Effectivelyimplemented in unitStaff Performance ManagementImplemented Service LevelAgreements for all subprogramsupplierAligned sub-programmeplanning, budgeting,performance (M&E) andreporting processes Modernbudgeting and controlTechniques effectivelyimplemented in unitEvidenced enhancement inthe performance of staffMonitor implementation ofSLA’sAligned sub-programme planning,budgeting, performance (M&E)and reporting processes Modernbudgeting and Control techniquesEffectively implemented in unitAll staff have signed Performanceagreements, aligned to the SRMstrategyMonitor implementation of SLA’sActual performance against <strong>Annual</strong>targetModern budgeting and ControltechniquesEffectively implemented in unit: monthlyIYM’s monitored and signed off onmonthly basisAll staff have signed Performanceagreements, aligned to the SRMstrategy and performance reviewsconducted timeouslySLA templates were produced ondemandReasons fordeviations<strong>Gauteng</strong> Department of Finance61
SECTION 3: REPORT ON THE PERFORMANCE OF PROGRAMMESKEY ACHIEVEMENTS:The oversight and regulatory role the unit plays isderived from <strong>Treasury</strong> Regulation 16 to the PFMA,1999 as amended and Municipal PPP Regulations,2008, in accordance with MFMA, 2003 and MSA.Additional achievements worth noting are as follows:• Provided support and inputs to <strong>Gauteng</strong>Department of Health and Social Development(GDH&SD) in conceptualizing a new healthPPP delivery model. This resulted in Dr GeorgeMukhari hospital being registered as a PPPproject in addition to Chris Hani Bara PPP,whose feasibility study is being revised for a<strong>Treasury</strong> Approval process. The implementationagreement to expedite delivery on the new healthPPP model has been finalized. Signatories to theimplementation agreement include GDH&SD,National <strong>Treasury</strong> and Development Bank ofSouthern Africa (DBSA).• The Unit ensured compliance and support on thefollowing PPP Projects: Chris Hani BaragwanathHospital; George Mukhari Hospital; GDE SchoolsProject; Nelson Mandela Children’s Hospital; BlueIQ: Innovation Hub and Supplier Park; GDARD:Roodeplat Tourism Hub and Lanseria andMagalies Orientation Centres; COJ AlternativeWaste Treatment; Cradle World Heritage Site andCity of Tshwane Accomodation Headquarters.• Participated in the Energy Dialogue for GPG thatis led by the Department of Local Governmentand Housing. This is one of the initiatives to lookinto alternative energy generating and savingmechanisms.• City of Tshwane Accommodation Headquarters:provided <strong>Treasury</strong> views and Recommendations(TVR11B) to Municipalities Value Assessment<strong>Report</strong> prior to announcement of preferredbidder and negotiations towards final closure.• Participated in Municipal Mid Year Performanceand Financial Reviews (MPMA S72) for EmfuleniLM, Mogale,City LM and Randfontein LM• Participation in the appointment of TransactionAdvisor completed for George Mukhari Hospital• RFQ document has been finalised and a JointDevelopment Agreement (COJ/NT/IDC) has alsobeen entered into• RFQ document for CHB PPP has been finalisedand is ready for issuance to the market• Newly registered projects with National <strong>Treasury</strong>;include Innovation Hub and Automotive SupplierPark, all from Blue IQ. The purpose of the projectsis mainly to resolve capacity challenges, resultingin growth prospects potentially enhancinginvestment to the province in these sectors.• Provided input to Banking Tender and assistedwith drafting of the P-Card Solution• Banking contract between <strong>GDF</strong> and FNB finalised• General legal assistance and support to GFA interms of contracts, service level agreements andlegal opinions• Provided a report and inputs on the <strong>Gauteng</strong>Funding Agency Business Model and listingprocess with National <strong>Treasury</strong>REASONS FOR MAJOR VARIANCES• Indecisiveness by procuring institutions (departmentsincluding entities and municipalities). This inturn delays progress on project cycle.• Lack of support at political level, resulting infewer projects being explored as PPPs.• Reluctance by potential clients to explore PPPs,citing reasons that the PPP planning processtakes a long time to implement, resulting in fewerprojects being explored as PPPs.• Poor communication between provincial andnational departments, leading to progress delaysin project phases.• Lack of sufficient planning for projects, resultingin cost and time overruns.6262<strong>Annual</strong> <strong>Report</strong> 2010 / 2011
SECTION 3: REPORT ON THE PERFORMANCE OF PROGRAMMES• Constant change in management structures, thisultimately results in fewer projects being followedthrough.• Lack of resources, staff and required experienceand skills to run projects within departmentsexploring PPPs.Key Strategic Interventions put in place:• Support clients to run PPP processes in parallel• Select pilot projects to show case value add PPPscan bring;• Engage departments during MTEC Hearingsessions to explore PPPs as alternative servicedelivery approach;• Encourage solid waste, Water and Sanitationprojects in a municipal arena;• Encourage participation from head/national officein steering committee meetings;• Regulate inception through Feasibility Study forprojects being explored as PPPs;• Support capacity through collaboration with DBSAin the form of resources and project managementexpertise.OUTLOOK FOR THE YEAR AHEAD(2011/2012)PPP Unit will be prioritising support to service deliveryin the health sector, on two of the flagship projectsnamely: Chris Hani Baragwanath Hospital and DrGeorge Mukhari projects. The rationale is to ensurethat these two projects are expedited to meet bothNational and provincial outcomes on health servicedelivery provision.Another focus area will be the promotion of green energyprojects, particularly the Waste to Energy Project,currently being explored by the City of Johannesburg.The Unit will continue providing support and regulatoryadvice to the current PPP Projects while exploring newPPP initiatives and avenues.<strong>Gauteng</strong> Department of Finance63
SECTION 3: REPORT ON THE PERFORMANCE OF PROGRAMMES3. Programme: FINANCIAL GOVERNANCEPurposeThe programme aims to create an enabling environment that will ensure sound financialmanagement leadership in the Province, through implementation and compliance tothe MFMA in all <strong>Gauteng</strong> municipalities, supply chain management, enterprise widerisk management, and financial management systems.Strategic Objectives:• To be a credible partner in Financial Management practices and systems.• To ensure accounting best practices within the Province.• To ensure the implementation of enterprise wide risk management within theProvince.• To ensure optimised cash management and enhanced financial managementsystems for the Province.• To enhance compliance to relevant legislation and regulations.• To ensure the effective and efficient management of the Financial Governanceprogramme.• To attract highly skilled and competent people and foster high performance.3.1 Sub-programme: Norms and StandardsPurpose• The purpose of Supply Chain Management unit is to facilitate the implementationof uniform and best SCM practices in municipalities and departments.• To enforce compliance with the Public Finance Management Act (PFMA) withinthe Province.Measurable Objectives• Uniform and best Supply Chain Management practices in the province.• Credible and timeous reporting to National <strong>Treasury</strong>.• Provide technical support and capacity building initiatives.• Facilitate Supply Chain Management reforms in the province.• Quarterly Performance <strong>Report</strong>s• Reduction in non-compliance• Fully complying Pubic Entities• Value-adding Audit Committee6464<strong>Annual</strong> <strong>Report</strong> 2010 / 2011
SECTION 3: REPORT ON THE PERFORMANCE OF PROGRAMMESPerformance against targetOutputs/ key deliverables Performance Indicators <strong>Annual</strong> Target Actual Performance against target Reasons for deviationsUniform and best SupplyChain Managementpractices in the provinceCompleted SCM policy modelfor the province.An approved SCM policymodel for the province.• Completed SCM policy Model for theprovince.• Conducted the investigations on theaward of tenders at <strong>Gauteng</strong> Departmentof Education and Kungwini LocalMunicipality.Major issues of staff concernare lack of training anddifficulty with client relations.Credible and timeousreporting to National<strong>Treasury</strong>Monthly and quarterlyreports submitted toNational <strong>Treasury</strong>. Number ofprocurement awards receivedfrom departmentsAll provincial departmentsreports on contractsabove R100 000submitted to National<strong>Treasury</strong>Deviations above R500000 submitted to <strong>GDF</strong>:<strong>Treasury</strong> Division• Nine departments have reported.The Department of InfrastructureDevelopment is not reporting.• Facilitated the roll-out of the electronicreporting (Procurement ContractInformation System) to municipalities.Ten municipalities are currently usingthe system for reporting contracts aboveR100 000.• Compiled a Consolidated report ofprocurement deviations by all GPGdepartments<strong>Gauteng</strong> Department of Finance65
SECTION 3: REPORT ON THE PERFORMANCE OF PROGRAMMESOutputs/ key deliverables Performance Indicators <strong>Annual</strong> Target Actual Performance against target Reasons for deviationsProvide technical supportand capacity buildinginitiativesNumber of training sessionsand workshops conductedAs and when requiredby departments andmunicipalitiesProvided technical support and training tomunicipalities and departments as follows:• Workshops on Procurement ContractInformation (PCI) system for municipalitiesand departments.• Participated in the facilitation of MunicipalInterns forum.• Provided SCM training for interns of theDepartment of Health.• Provided SCM workshop for Councillorsof <strong>Gauteng</strong> municipalities in consultationwith SALGA.• Provided SCM workshop for the BidAdjudication Committee of Merafong LocalMunicipality.• Provided SCM training to officials ofJohannesburg City Parks.• Provided SCM training to Mogale Cityofficials.• Facilitated SCM workshop to AuditCommittee members of Westonaria andEmfuleni Local Municipalities.• Participated in the workshop for membersof <strong>Gauteng</strong> Audit Committee.• Participated in the SCM sub-stream forMetsweding / Tshwane merger.6666<strong>Annual</strong> <strong>Report</strong> 2010 / 2011
SECTION 3: REPORT ON THE PERFORMANCE OF PROGRAMMESOutputs/ key deliverables Performance Indicators <strong>Annual</strong> Target Actual Performance against target Reasons for deviationsFacilitate Supply ChainManagement Reforms in theprovinceNew SCM informationdisseminated tomunicipalities anddepartments.As and when requiredby departments andmunicipalities• Two <strong>Provincial</strong> <strong>Treasury</strong> Circulars issuedand disseminated to departments andmunicipalities.• Two National <strong>Treasury</strong> circulars weredisseminated to Municipalities.• Two National <strong>Treasury</strong> practice notesdisseminated to departments.Consolidated PFMAQuarterly Performance<strong>Report</strong>sQuarterly PFMA Performance<strong>Report</strong>sConsolidated PFMAPerformance <strong>Report</strong>Quarters 01, 02 and 03 PFMA <strong>Report</strong>sconsolidatedCompliance with theprovisions of the PFMA and<strong>Treasury</strong> RegulationsAnalyse and respond to PFMArequests by departmentswithin seven (7) working daysFull compliance with theprovisions of the PFMAAll queries were analysed and responded towithin the 07 days timeframeImplementation of theCheque Approval GuidelinesDevelop guidelines forapproval of chequesGuidelines for Issuanceof ChequesGuidelines drafted for approval.Develop and maintain aQuery RegisterDevelop and maintain a QueryRegisterUpdated Query RegisterQuery Register in place.Facilitate the creation,listing and delisting of PublicEntitiesConsultation with National<strong>Treasury</strong>Fully complying GPGPublic EntitiesConsulted with National <strong>Treasury</strong> on thecreation of the <strong>Gauteng</strong> Funding Agency.Submitted an updated database of GPGPublic/Trading Entities to the National<strong>Treasury</strong><strong>Gauteng</strong> Department of Finance67
SECTION 3: REPORT ON THE PERFORMANCE OF PROGRAMMESOutputs/ key deliverables Performance Indicators <strong>Annual</strong> Target Actual Performance against Output target Reasons for deviationsAnalyse and recommend onthe opening and closure ofGPG Trading EntitiesEnforce compliance withSection 19 of the <strong>Treasury</strong>RegulationsFully complying TradingEntityApproved the opening of a Trading Entity(Revenue Collection Agency) for theDepartment of Economic Development.Consulted with Departments ofInfrastructure Development and Roads andTransport on closure of Trading Entitieswithin their operation.Maintain a databaseon GPG Public Entities,Agencies and TradingEntitiesRegular database update toreflect new and/or delistedentitiesAn updated databasemaintainedUpdated database in placeReview of GPG Public/Trading Entities andAgenciesConsultation with parentDepartmentsProperly created andlisted Public /TradingEntity3 Departments were consulted.Efficient and EffectiveAdministrationand Logistical ArrangementsAdministration and Logisticsas per approved AuditCommittee CharterAdministration andLogistics as per approvedAudit Committee CharterAdministration and logistics (in terms ofmeetings, venues, minutes, etc) weresuccessfully conducted as per AuditCommittee Charter.Research through BestPractice and BenchmarkingexerciseAudit CommitteeRemuneration StructureApproved AuditCommittee RemunerationStructureAudit Committee Remuneration Structurewas approved by the MEC: Finance forimplementation.6868<strong>Annual</strong> <strong>Report</strong> 2010 / 2011
SECTION 3: REPORT ON THE PERFORMANCE OF PROGRAMMESOutputs/ key deliverables Performance Indicators <strong>Annual</strong> Target Actual Performance against Output target Reasons for deviationsRecruitment, Selection,Appointment of AuditCommittee MembersRecruitment andAppointment of qualified,skilled and experiencedMembers to GPG AuditCommittees to ensure valueaddingpurposes.Fully capacitated AuditCommittee Clusters.Adherence to the GPGAudit Committee Policy.Audit Committee clusters were fullycapacitated as per requirements of theAudit Committee Policy.Enhanced andComprehensive GPG AuditCommittee CharterResearch through bestpractice and Benchmarkingexercises to ensurethe comprehensiveness of theGPG CharterEnhanced andapproved GPG AuditCommittee Charter forimplementationAudit Committee Charter approved forimplementation.Approved GPG AuditCommittee PolicyResearch through bestpractice and Bench-markingexercisesApproved GPG AuditCommittee Policy forimplementationAudit Committee Policy approved forimplementation.<strong>Annual</strong> Evaluation of theAudit Committee andMembers<strong>Report</strong> on thePerformance of theAudit Committee andMembersThe Evaluation for theperiod 2009/10 shouldbe completed after theAudit Process.2009/10 Evaluation <strong>Report</strong> completed.<strong>Gauteng</strong> Department of Finance69
SECTION 3: REPORT ON THE PERFORMANCE OF PROGRAMMESREASONS FOR MAJOR VarianceSThe merger in the CoT and Metsweding might have contributed to the non-reporting.Officials in the four municipalities are focusing more on the merger. With regard toDepartment of Infrastructure Development, it appears that there are internal issuesas several attempts were made to alert the department of the non-reporting.The SCM unit completed the Supply Chain Management Policy Model for the province.The model policy will assist departments and entities to establish and adopt theirown policies. The unit also provided trainings to different Supply Chain Managementstakeholders during the 2010/2011 financial year in order to improve capacity in theimplementation of Supply Chain Management.Departments submitting incomplete PFMA <strong>Report</strong> which impacts on the overallanalysis in terms of compliance within the Province. Of a major challenge is the lackof cooperation and timeous submission of requested information or documentationby Departments. With regard to the Supply Chain Management, certain municipalities(City of Tshwane, Kungwini, Nokeng, and Metsweding) and Department (InfrastructureDevelopment) are not reporting contracts above R100 000.report on contracts above R100 000. The Department of Infrastructure Development(DID) did not report on contracts above R100 000 as well. In actual fact, the varianceis only with regard to DID as the 2010/2011 APP did not include reporting ofprocurement spending by municipalities.OUTLOOK FOR THE YEAR AHEADThe directorate will continue to enforce and monitor compliance with the Public FinanceManagement Act, <strong>Treasury</strong> Regulations and other relevant polices and frameworkswithin the Province. Furthermore, the directorate will roll-out the implementation ofSupply Chain Management policy models in departments and entities, as well asensuring improvements in the reporting of procurement spending in the municipalitiesthat are not reporting. The Quarterly Analysis of procurement spending informationwill be introduced to measure the progress made in implementing the PPPFAobjectives. The main focus in 2011/2012 will be on the roll-out and implementationof Supply Chain Management policy model in departments and entities. The SCM unitwill also focus on Improving the reporting of procurement spend in the municipalitiesthat are not reporting and introducing the quarterly analysis of procurement spendinformation to measure the progress made to implement PPPFA objectives.There are no major deviations to the annual performance plan, except the fourmunicipalities (City of Tshwane, Kungwini, Nokeng, and Metsweding) that did not7070<strong>Annual</strong> <strong>Report</strong> 2010 / 2011
SECTION 3: REPORT ON THE PERFORMANCE OF PROGRAMMES3.2 Sub-programme: Local Government Financial ServicePurposeThe aim of this sub-programme is to ensure implementation and compliance to theMFMA in all <strong>Gauteng</strong> municipalitiesStrategic Objectives• To provide finance and economic solutions• To ensure financial and non-financial reporting• To facilitate, advice and support the alignment and integration of planning anddelivery in the Province• To manage effectively the budgeting process for the Province• To manage and oversee the implementation of strategic financing solutions• To institutionalise tools to inform the constraints, growth opportunities andallocation processes• To attract highly skilled and competent people that foster high performanceMeasurable Objectives• To monitor compliance with full requirements of the MFMA;• To ensure effective and efficient budgetary and financial planning processes inlocal government which are also aligned to the processes of organs of state inthe two other spheres of government• To ensure that systems, structures and processes associated with managementdecision making and control in the municipalities are in line with the MFMA• To provide a platform and structure to address challenges relating to alignmentof programmes and channel support intended for municipalities in theimplementation<strong>Gauteng</strong> Department of Finance71
SECTION 3: REPORT ON THE PERFORMANCE OF PROGRAMMESPerformance against targetOutputs/ keydeliverablesPerformance Indicators <strong>Annual</strong> Target Actual Performance against target Reasons for deviationsAn accurate<strong>Gauteng</strong>LG FinanceDatabaseestablishedEvidence of accurate <strong>Provincial</strong>budget databaseAccurate <strong>Gauteng</strong> LGFinance DatabaseestablishedClose off report on the pilot project completed andawaiting approval by the HoD for implementation in the2011/12 financial yearLate start to the project due tofinancial constraints led to thedelays in implementing someinitial phases of the projectMonthly,quarterlyUpdatedinformationavailableTimeous and accurateInformation available fromMunicipalitiesMonthly, quarterly updatedinformation available fromthe sub-programmeMonthly and quarterly Preformance reports produced andsubmitted to executive managementTimeous,qualitativeand accuratelegislatedsubmissionsTimeous, qualitativeand Accurate legislatedSubmissions Completed (S8submission of primary bankaccounts, monthly budgetstatement, draft and finalbudget, municipal adjustmentbudget, MFMA non-financialreturns, MFMA competencyframework return, Midyearreview, Municipal consolidatedreport) from municipalities toNT (monthly, quarterly andannual)Timeous, qualitativeand accurate Legislatedsubmissions4 Quarterly consolidated municipal financial performancereports (Section 71) produced and submitted to both NTand Legislature.12 Monthly budget Statements (Section 71) received andanalysed7272<strong>Annual</strong> <strong>Report</strong> 2010 / 2011
SECTION 3: REPORT ON THE PERFORMANCE OF PROGRAMMESOutputs/ keydeliverablesPerformance Indicators <strong>Annual</strong> Target Actual Performance against target Reasons for deviationsQuarterlyreports ontraining andhands onsupport todepartmentsandmunicipalitiesprovidedQuarterly reports on trainingand support providedQuarterly reports ontraining and hands onsupport to departmentsand municipalitiesprovided1 Municipal Finance Interns Forum successfully hosted1 Training workshop on the Budget Formats and NewRegulations successfully hostedContinuous participation in the District CFO Forum as away of capacity buildingReviewstructure ofthe close offreport onmunicipalbudgetsClose off report on municipalBudgets reflecting spendagainst budget submitted toDDGAssess municipal budgetsand present findings tomunicipalities through theMunicipal Budget Visitengagements.Close off report onmunicipal budgetsreflecting thatmunicipalities spendagainst their prioritiesIndividual municipal assessments on Mid YearPerformance <strong>Report</strong>s/ Adjustment budgets finalised1 Close off report on municipal budgets producedInstitutionalizedMunicipalforums in thecontext of theIGR frameworkInstitutionalized Municipalforums in the context of the IGRframeworkAccurate minutes of MeetingsreflectingResolutions taken and targetdates for implementationEnsure effective functioningof relevant forumsby reviewing existingFinance IGR forums andidentify opportunities forenhancement. (InternsForum, <strong>Annual</strong> CFOF,Quarterly CFOF)Successfully hosted 3 <strong>Gauteng</strong> Municipal CFO Forum and3 Municipal Finance Indabas. Participated at 4 MFMAJoint meetings hosted by National <strong>Treasury</strong><strong>Gauteng</strong> Department of Finance73
SECTION 3: REPORT ON THE PERFORMANCE OF PROGRAMMESOutputs/ keydeliverablesPerformance Indicators <strong>Annual</strong> Target Actual Performance against Output target Reasons for deviationsStatus in the implementationof municipal portalFinalised pilottesting of MunicipalPortalPilot testing completed in 4 selected municipalities and aclose off report producedDue to financial constraintswithin <strong>GDF</strong> and budget cuts.Proposed full roll-out of theportal project to be consideredfor 2012/13 financial year.Draft, Mainand Adjustmentbudget tabledAdjustment budgetTabled Draft budget for nextyear tabledEnsure thetabling ofadjustments and mainbudget for localgovernmentAll municipalities in <strong>Gauteng</strong> tabled and adopted theirbudgets in line with the requirements of MFMA.Individual assessments performed on all drafts andadjustment budgets submitted for the 2010/11 financialyearQuarterly<strong>Report</strong> onconditionalgrantsperformanceQuarterly <strong>Report</strong> on conditionalgrants performanceQuarterly <strong>Report</strong> onConditional grantsperformance4 Quarterly reports on verification of Conditional grantsconcluded2 Gazette on the municipal conditional grants for 2011/12financial year published7474<strong>Annual</strong> <strong>Report</strong> 2010 / 2011
SECTION 3: REPORT ON THE PERFORMANCE OF PROGRAMMESOutputs/ keydeliverablesPerformance Indicators <strong>Annual</strong> Target Actual Performance against Output target Reasons for deviationsgrantsperformanceNo auditqualificationsfor noncompliancewith GRAPstandardsNo auditqualificationsfor non-compliancewith GRAPstandards (excluding GRAP17 standards)• 9 municipalities received unqualified audit opinions and3 municipalities received qualified opinions.• Participated in weekly Audit Steering Committeemeetings to discuss AG findings by and providedassistance in resolving the findings ;• Assisted delegated municipalities with implementationof CaseWare software system to ensure that the 2010<strong>Annual</strong> financial statements are successfully producedon the CaseWare;• A 2day CaseWare Training was conducted during theweek ending 04 June 2010 in preparation for thecompilation of the 2009/10 AFS.• AFS Technical Review performed wrt assessment ofGRAP and sent out to all delegated municipalities;• Compiled a consolidated <strong>Annual</strong> Financial StatementReview for all delegated <strong>Gauteng</strong> municipalitiesTimeoussubmissionof credibleAFS to AG (asper legislateddeadlineCompliance with relevantprescript(s)Compliance with relevantprescript(s)• Obtained year-end plans for 2009/2010 financial year;• Provided technical assistance to municipalities onaccruals, creditors, long-term liabilities and investmentproperties;• Co-ordinated a 2 day workshop in collaboration with thewith the Auditor General on predetermined objectives;<strong>Gauteng</strong> Department of Finance75
SECTION 3: REPORT ON THE PERFORMANCE OF PROGRAMMESOutputs/ keydeliverablesPerformance Indicators <strong>Annual</strong> Target Actual Performance against Output target Reasons for deviationsFunctionalInternal AuditActivities andAuditCommittees inmunicipalitiesCredible internal audit plansand implementation thereofEffective audit committeeand response to internal andexternal audit findings bymanagementEffective audit committeeand response to internaland external audit findingsby management• Monitored through attending the Audit Committeemeetings for all delegated municipalities;• Provided support to municipalities through deploymentof Interns;• Developed an IAA methodology as per the supportrequest.• Developed a work plan guide for municipalities whichwas issued as Circular 10;• Participated in municipal Performance; Riskmanagement, Anti-Fraud and Anti-corruptioncommittees;• Assessment reports on the status of IAA and AC weresent out to all delegated municipalities;• Revised audit charters for municipalities to our ownstandard charter as per support request;• Conducted one on one IAA Road shows;• Established a relationship with Institute of InternalAuditors7676<strong>Annual</strong> <strong>Report</strong> 2010 / 2011
SECTION 3: REPORT ON THE PERFORMANCE OF PROGRAMMESKEY ACHIEVEMENTSFor the year under review the Local GovernmentFinancial Services unit mindful of the challengeswithin the discipline from a broader aspect have madesignificant strides and have accomplished numerousachievements including:• facilitated payment of close to R1 billion ofoutstanding government debt to municipalitiesby the provincial departments;• Chairing the Finance and ICT Stream on theTshwane Metsweding merger. The streamfacilitated the production of the draft consolidatedbudget for the “New City of Tshwane” for the2011/12 financial year which was tabled on the31 March 2011;• Hosting of 1st <strong>Gauteng</strong> Municipal Internal AuditForum December 2010;• For the financial year under review we had animprovement in a number of municipalities thatreceived an unqualified opinion, and there wereno municipalities that received any disclaimerand/or adverse audit opinions in the 2009/2010financial year. This was achieved through asnumber of interventions i.e. the province deployedsome of its staff to assist in AFS compilation,and addressing audit queries; the province hada training session in conjunction with AuditorGeneral on predetermined objectives; we hadthe first Internal Audit Forum, where best internalaudit practices were shared; we also form partof the ASB Public Sector accounting forum, tostay abreast of the latest changes in accounting,particularly GRAP standards so that we can rollout the information to <strong>Gauteng</strong> municipalitiesand; to comply with our oversight and monitoringroles to municipalities, we have issued a numberof circulars; and• The Province also issued certificates ofcommendation to municipalities that obtainunqualified audit opinions in 2009/2010 whichwere handed out in the Municipal FinanceIndaba.REASONS FOR MAJOR VARIANCEAlthough the Local Government Financial Services unithave had major achievements these were achievedunder at times difficult circumstances beyond thecontrol of the unit which includes:• Budgetary constraints to effectively support ourmunicipalities;• High staff turnover within the department andmore specifically the unit;• Vacant positions including the delay in theimplementation of the new proposed structureultimately impacting on the unit from performingoptimally in terms of its required mandate underthe auspices of Municipal Finance ManagementAct and other peripheral legislation dealing withmunicipal fiscal matters.OUTLOOK FOR THE YEAR AHEAD(2011/2012)In dealing effectively with the current challengeswithin the unit more resources in terms of Budgetand the finalisation of the Local Government FinancialServices structure is imperative in enabling the unit todeal effectively with its legislative mandate.The Local Government Financial Services willcontinue to support municipalities within the provincewith the implementation of the MFMA and otherrelated pieces of Legislation. LGFS will continuewith the implementation of the initiatives to addressunresolved audit findings with a view to improvingfinancial management and governance structuresin municipalities. This will also be in preparation ofmunicipalities towards achieving the goal set by theMinister of clean audits by 2014.<strong>Gauteng</strong> Department of Finance77
SECTION 3: REPORT ON THE PERFORMANCE OF PROGRAMMES3.3 Sub-programme: RiskManagementPurpose• The aim of this sub-programme is to ensurethe implementation of enterprise wide riskmanagement within the Province, as well asensuring compliance to the PFMA.Strategic Objectives• To be a credible partner in Financial Managementpractices and systems.• To ensure accounting best practices within theProvince.• To ensure the implementation of enterprise widerisk management within the Province.• To ensure optimised cash management andenhanced financial management systems for theProvince.• To enhance compliance to relevant legislationand regulations.• To ensure the effective and efficient managementof the Financial Governance programme.Measurable objectives• Review and manage the implementation of theGPG risk management framework.• Develop and manage a municipal riskmanagement framework and advisemunicipalities.• Provide technical assistance to GPG departments.• Provide technical assistance to municipalities.7878<strong>Annual</strong> <strong>Report</strong> 2010 / 2011
SECTION 3: REPORT ON THE PERFORMANCE OF PROGRAMMESPerformance against targetOutputs/ key deliverablesAn approved GPG RiskManagement Frameworkaligned to the PSRMFand ISO 31000 on RiskManagementERM process review reportPerformanceIndicatorsRevised and approvedRisk ManagementFramework.10 ERM processreviews reports.<strong>Annual</strong> Target Actual Performance against target Reasons for deviationsRevised andapproved RiskManagementFramework.30ERM processreviews reports.<strong>Provincial</strong> Risk Management Framework wasreviewed and approved by the HOD:Finance.Financial Management Capability Maturity Modelresults released in Quarter 2 for all <strong>Provincial</strong>Departments. 11 Strategic Support Plans weredeveloped and submitted to Departments in Quarter3. Follow ups on the implementation of action planswere conducted for all provincial departments inQuarter 4. 11 SSP’s updated and submitted.Standard proceduremanuals84 Standard proceduremanuals.84 Standardprocedure manuals.84 Standard Procedure manuals developed.Trained Risk ManagementCommittees10 Risk ManagementCommittees trained.10 Risk ManagementCommittees trained.4 Risk Management Committees TrainedDelays in the establishment ofRisk Management Committeesresulted in Departments notproviding training dates.Risk Management Forum4 Risk ManagementForums held.4 Risk ManagementForums held.4 Risk Management Forums held. None<strong>Gauteng</strong> Department of Finance79
SECTION 3: REPORT ON THE PERFORMANCE OF PROGRAMMESOutputs/ key deliverablesCapacitated Chief RiskOfficersMunicipal Risk ManagementFrameworkERM process review report.52 Control Risk SelfAssessment Workshops11 Global Risk AssessmentWorkshopsPerformanceIndicators30 one-on-one visitsheld with each ChiefRisk Officer.36 trainings/one-ononesessions held inMunicipalities.Establishment of 1Chief Risk Officer’sforums.1 Draft riskmanagementframework for allmunicipalities.24 ERM process reviewconductedNumber of ControlRisk Self AssessmentWorkshops completedNumber of GlobalRisk AssessmentWorkshops completed<strong>Annual</strong> Target Actual Performance against Output target Reasons for deviations30 one-on-one visitsheld with each ChiefRisk Officer.36 trainings/one-ononesessions held inMunicipalities.Establishment of 1Chief Risk Officer’sforums.1 Draft riskmanagementframework for allmunicipalities.24 ERM processreview conducted52 CRSA WorkshopsCompleted11 Global RiskAssessmentWorkshopsCompleted34 one-on-one visits held.55 one-on-one sessions conducted for municipalities.1 Chief Risk Officer Forum established. Held on the23rd of March 2011.Municipal Risk Management Framework developed.Strategic Support Plans were developed in Quarter3 for all 12 municipalities. Follow ups on theimplementation of action plans were conducted formunicipalities in Quarter 4. 12 SSP’s updated andsubmitted.62 CRSA Workshops Completed24 Global Risk Assessment Workshops Completed8080<strong>Annual</strong> <strong>Report</strong> 2010 / 2011
SECTION 3: REPORT ON THE PERFORMANCE OF PROGRAMMESKEY ACHIEVEMENTSThe <strong>Gauteng</strong> <strong>Provincial</strong> Risk Management Frameworkwas reviewed taking into account the environmentin which we operate and best practices such as ISO31000 paper on Risk Management and the PublicSector Risk Management Framework. We were ableto train four (4) Risk Management Committees on itsroles and responsibilities as we believe that the tonefor Enterprise-wide Risk Management implementationneeds to be set at the top. One-on-one sessions wereconducted with all Chief Risk Officers (CRO) providingon the job assistance and advice. Risk Managementforums for departments were held on quarterly basisfocussing on issues of mutual concern to Chief RiskOfficers. Twenty four (24) Global Risk Assessmentswere conducted.The Standard Procedure Manual project wassuccessfully completed which has seen that keybusiness processes were documented, addressingthe risk of losing institutional memory and enablingdepartments to better identify risks.A Municipal Risk Management Framework wasdeveloped for municipalities to implement. Thisframework provides guidance to municipalities on howto implement Enterprise-wide Risk Management.The Risk Management Forum for municipalities thatwas held aimed to create a platform for CROs whereissues relating to the implementation of ERM candebated upon and also where ideas can be exchanged.It is important for municipalities to be aware of the risksthey are facing and as a result we assisted to conductrisk assessments at the following municipalities:• Merafong City Local Municipality• Kungwini Local Municipality• Westonaria Local Municipality• Randfontein Local MunicipalityMunicipal Finance Management Act section (72) visitswere attended during which the status of ERM at therespective municipalities was again brought under theattention of the relevant municipal manager to supportits implementation.REASONS FOR MAJOR VARIANCESOne of our key challenges remain the non-appointmentof Chief Risk Officers at municipalities as only twowere appointed in the twelve delegated municipalitiesin <strong>Gauteng</strong>. Challenges were experienced with somemunicipalities delaying to respond to the progresson implementation of action plans for the strategicsupport plans.The delay in the establishment of Risk ManagementCommittees by departments posed a challenge aswe could not train all of these Committees on itsroles and responsibilities. Management still doesnot wholeheartedly support the implementation ofEnterprise –wide Risk Management. We experiencedquite a few of cancellations for Global Risk Assessmentsand Control Risk Self Assessment workshops by GPGDepartments. Limited staff capacity was also a concernbecause of the number of vacant positions we had.OUTLOOK FOR THE YEAR AHEADWe will continue embarking on the process of trainingRisk Management Committees for those departmentswhich were not trained on the roles and responsibilitiesof such a committee.Further efforts will be made to strengthen theimplementation of Enterprise-wide Risk Management(ERM) in both departments and municipalities throughan interventionist hands on approach. We will focuson raising more Enterprise-wide Risk Managementawareness together with Chief Risk Officers, wheredepartments or municipalities do have and where theyare not yet appointed we will step in and provide thenecessary support in this regard.Oversight and assistance will be provided withthe implementation of the revised <strong>Provincial</strong> RiskManagement Framework and the aim is to improve therisk maturity for Departments.<strong>Gauteng</strong> Department of Finance81
SECTION 3: REPORT ON THE PERFORMANCE OF PROGRAMMESA key focus area for municipalities will be theimplementation of the approved Risk ManagementFramework. Through implementation of the frameworkwe aim to improve the risk maturity status ofmunicipalities in the province. The aim is to buildcapacity at municipalities through having the MunicipalRisk Management Forum on a quarterly basis whereideas and challenges in respect of ERM implementationare discussed.We will continue with the facilitation of Control Risk SelfAssessments and Global Risk Assessment Workshopsfor the eleven (11) GPG Departments.3.4 Sub-Programme: FinancialBusiness SystemsPurpose• To provide strategic leadership and technicalsupport with regards to the financial systems andaccess of the transversal systems in the provinceStrategic Objectives• To co-ordinate financial systems training in theprovince.• To ensure implementation of financial systemsmodules in the province.• Monitor the Transversal system’s performanceby ensuring that almost all procured functionalmodules are fully utilized, and monitor misallocatedtransactions.Measurable Objectives• Provide financial systems support• Co-ordinate of Financial systems training• Compliance with Standard Chart of Accountsstandards• Document practice notes8282<strong>Annual</strong> <strong>Report</strong> 2010 / 2011
SECTION 3: REPORT ON THE PERFORMANCE OF PROGRAMMESPerformance against targetOutputs/ keydeliverablesPerformance Indicators <strong>Annual</strong> Target Actual Performance against targetEnhancements ontransversal systemsNumber of system enhancementapprovedRoll out of Validation Tool onSAP for the entire GPG.Monitoring of misallocations for all Departments by informingDepartments about their misallocationsTo develop and maintainfinancial system supportto all GPG DepartmentsProvision of financial systems supportMunicipal prototype systemdeveloped for financial reportingMunicipal prototype system developed for financial reportingReview andimplementation of timelinesFNB OBE SYSTEMLoading users in the new FNBSystem;Inform all stakeholders about the migration from ABSA to FNB;Continuous support of users on transversal system;SAP ASSET MODULEImplemented the Sap Asset Modules in two departments96% of all calls logged resolved as per agreed SLA<strong>Annual</strong>ly updated andrelevant financial systemspolicy implementedDocumented Practice Notes onfinancial systems changes andprocesses1Developed and published a process to manage supplementaryruns;Developed and published a circular on the submission of thenew structure<strong>Gauteng</strong> Department of Finance83
SECTION 3: REPORT ON THE PERFORMANCE OF PROGRAMMESKEY ACHIEVEMENENTAlthough the unit have constraint of human capacity the unit managed to ensurethat the unit managed to co-ordinate training for 300 financial system users onboth BAS/PERSAL.The unit introduced a tool that will validate incorrect combinations at point of entryand this was rolled out to all GPG Departments. Amongst other deliverables the unitmanaged to migrate users from Absa cash focus system to FNB system.OUTLOOK FOR THE YEAR AHEADDuring 2011/12 financial year the Financial Business Systems unit will continue toimprove system support to Departments on all financial systems, co-ordinate training,develop and implement system policies.As part of the attempt to improve the ability to extract meaningful data for monitoringGovernment expenditure, the unit will roll out a Budget monitoring tool to all GPGDepartments. Review existing financial system modules and standardise new modelsacross departments. Continue to support Departments to minimise misallocationsand enhance the validation tool8484<strong>Annual</strong> <strong>Report</strong> 2010 / 2011
SECTION 3: REPORT ON THE PERFORMANCE OF PROGRAMMES4. Programme: GAUTENG AUDIT SERVICESPurpose<strong>Gauteng</strong> Audit services sets out to provide a full spectrum of internal audit services(assurance and consulting) focussing on strategic risks of GPG Departments andaimed at fostering continuous improvement in the internal control environment withinthe public sector.Strategic Objectives:To ensure sound corporate governance in the province and to provide robust resourcemanagement services.Measurable objectives:• To conduct a full spectrum of audits throughout the GPG in line with approvedinternal audits plans;• To convene risk assessment workshops in targeted areas;• To perform quality assurance reviews; and• To provide ad-hoc advisory services on new IT systems.4.1 Sub-programme: Risk and Compliance Audit (Cluster 1 & 2)Outputs/ key deliverablesPerformanceIndicators<strong>Annual</strong> TargetActual Performance againstOutput targetReasons for deviationsRisk and Compliance Audit -100% of audit plan achieved- service delivery auditsNumber of planned riskaudits completed36 audits 30 one-on-one visits held.2 audits have been concluded but are just awaitingmanagement comments. The last 4 audits were notdone at the specific requests of the departmentsdue to change in processes.4.2 Sub-programme: Risk and Compliance Audit (3, 4 & 5)Outputs/ key deliverablesPerformanceIndicators<strong>Annual</strong> TargetActual Performance againstOutput targetReasons for deviationsRisk and Compliance Audit -100% of audit plan achieved- financial managementauditsNumber of planned riskaudits completed54 audits 58 CompletedDelays in finalizing the audits due to client notproviding the required audit information andmanagement comments timeously.<strong>Gauteng</strong> Department of Finance85
SECTION 3: REPORT ON THE PERFORMANCE OF PROGRAMMES4.3 Sub-programme: Performance AuditOutputs/ key deliverablesPerformanceIndicators<strong>Annual</strong> TargetActual Performance againstOutput targetReasons for deviationsPerformance Audit - 100%of audit plan achievedNumber of plannedperformance auditscompleted18performanceaudits13performanceauditsThe 5 remaining audits are in progress due toresource constraints and the clients delayed inproviding information required for audit purposes.4.4 Sub-programme: Computer AuditOutputs/ key deliverables Performance Indicators <strong>Annual</strong> TargetComputer Audit - 100% ofaudit plan achievedData analysis using ACL -Completed CAATs as per theservice requestProvide advisory services -Complete involvement in theidentified projectsNumber of plannedcomputer audits completedNumber of CAATS completedwithin specified timeframeNumber of value addedadvice provided on projects(being actively involved aspart of the project team)24Computer audits16CAATS4value added adviceon new IT systemdevelopmentActual Performanceagainst Output target22audits completedReasons for deviationsUncompleted planned audits were as a result of thefollowing:• Delays with obtaining management comments oncertain audits• Some of the audits were commenced on laterthat planned due to approvals for funding thatcame through later• At client request, to keep the audit on hold• Re-work, re-testing on certain audits as they werenot properly executed first time around0 This is a demand-driven service3 completed• Based on the risk assessment, clientneeds.• This is negotiated with the clients• A reduction in IT projects across the GPG8686<strong>Annual</strong> <strong>Report</strong> 2010 / 2011
SECTION 3: REPORT ON THE PERFORMANCE OF PROGRAMMES4.5 Sub-programme: Centre of ExcellenceOutputs/ key deliverablesPerformanceIndicators<strong>Annual</strong> TargetActual Performance againstOutput targetReasons for deviationsGAS Quality AssuranceProgramme - 100%of planned qualityassessmentsNo of assessmentsperformed12internal qualityassessmentscompleted23assessments completedNumber of interns inprogrammeNumber of interns inprogramme10 0Due to budgetary constraints, training from externalproviders could not be sourced. 3 Internal traininginterventions were provided to staff.MAJOR ACHIEVEMENTSOverall the unit performance for the year under reviewstands at 95% i.e. 123 audits were completed againsta target of 129 audits in all major focus areas in linewith the approved risk-based internal audit plans. The123 areas audited covered the <strong>Gauteng</strong> <strong>Provincial</strong>Departments Head Offices and some of its entitiesi.e. Hospitals, Clinics, Regional Offices, District Officesand Schools. Almost all the remaining audits havebeen finalized with only comments and action plansoutstanding from departmental management.Amongst other key focus areas the unit audited riskmanagement and governance processes in all GPGdepartments and made recommendations to ensurethat measures are in place to mitigate identifiedrisks and ensure compliance with PFMA and <strong>Treasury</strong>regulations. The unit also audited controls andprocesses around the preparation of Interim FinancialStatements as part of the initiative to assist departmentsachieve clean audits by 2014. This process includedthe review of the extent to which all GPG departmentshave implemented critical findings raised by the AuditorGeneral. The unit also conducted value for moneyaudits in key focus areas such as Quality of HealthCare, Teacher Development, Expanded Public Worksprogramme, Nature Conservation, Medical SuppliesDepot, Evaton Renewal programme, 20 PTP, LawEnforcement Agencies, Community Police Relationsetc.The unit introduced a tool to monitor the effectivenessof disposition of internal audit results by GPGdepartmental management. The periodic updates frommanagement to evaluate the status of its efforts tocorrect / implement internal audit recommendationsrevealed that for 2008/9 financial year, 95% correctiveactions were implemented to address the issuesraised by internal audit and 88% corrective action wasachieved for 2009/10 financial year.The business unit managed to improve its vacancy rateto 10% by the end of the financial year.• Sub-Programme: Risk and Compliance AuditThe Risk and Compliance Audit unit whichhas 2 sub-units concluded 88 audits against<strong>Gauteng</strong> Department of Finance87
SECTION 3: REPORT ON THE PERFORMANCE OF PROGRAMMESthe planned target of 90 of its stated auditcoverage for the year for all the various GPGdepartments. The remaining audits areat reporting stage with only managementcomments outstanding. A number of auditswere not finalized timely due to resourceconstraints as well as client delays in providingdocumentation and management comments.• Sub-Programme: Computer auditingFor the 2010-11 financial year, 22 auditswere completed against a target of 21 for allthe various GPG departments. The 22 auditreports also included 3 reviews that wereof an advisory nature. There is a residualnumber of 4 audits over and above the settarget which comprised of ad-hoc audits thatwere not planned for which were requestedby the various client departments. The fourremaining audits are at reporting stage withjust management comments outstanding.Three of these four outstanding audit reportswere audits that were outsourced to externalservice providers due to the specialised natureof the skills required. Part of the challenge wasthat the approval to outsource these auditswas granted very late in the financial year, i.e.in the last quarter of the financial year.• Sub-Programme: Performance AuditThe sub-unit has concluded 13 audits against atarget of 17 of its stated audit coverage for theyear for all the various GPG departments. In thecurrent financial year GAS was unable to usethe body shop of consultants as planned due tobudgetary constraints. The available resourceswere efficiently planned to ensure successfulconclusion of the audit coverage plan however,major delays experienced in terms of receivinginformation for audit, non availability of officialsand late provision of management commentsmade it impossible to conclude all 17 audits ontime.REASONS FOR MAJOR VARIANCESThe greatest challenge of the unit was limited resourcesi.e. availability of sufficient human resources to conductplanned audits. However, by the end of the financial yearthe department managed to fill most of the vacant postsand is currently sitting with a 10% vacancy rate thatis planned to be filled during 2011/12 financial year.The unit also faced difficulties in finalizing all audits asplanned as per approved internal audit plan timelines.This was mainly due to clients i.e. departmental officials,not always available as and when required to ensuresmooth facilitation of the audit process, delays in theprovision of documentation required for audit purposesand delays in provision of management comments andaction plans by departmental management. Escalationprocesses are being implemented on an ongoing basisto address this challenge and measures are beingimplemented to ensure forging of closer relationshipswith management.OUTLOOK FOR THE YEAR AHEADDuring the coming year, the division will continue toprovide independent assurance services by performingrisk and compliance audits, computer and performanceaudits covering 139 critical areas in line with approvedinternal audit plans based on key strategic risks of theGPG departments. These will focus on areas identifiedas high risk by the various departments and also takinginto account key control issues that have already beenhighlighted by the Auditor General in order to ensurecontinuous improvement in terms of internal controls,governance and risk management processes.• Sub-Programme: Risk and Compliance auditThe <strong>Gauteng</strong> <strong>Provincial</strong> Government is aimingto achieve a clean audit report by 2014and <strong>Gauteng</strong> Audit Services continues in itsinitiative to provide assistance to Departmentsin this regard. Therefore the internal audit plansare focused not only on the key service delivery8888<strong>Annual</strong> <strong>Report</strong> 2010 / 2011
SECTION 3: REPORT ON THE PERFORMANCE OF PROGRAMMESpriorities as per the Departmental strategicrisk assessments and Strategic Plans, but alsoplaying a role in helping Departments addresscritical findings raised by the Auditor General(AG), by ensuring that management puts inplace adequate, efficient and effective internalcontrols within their operations and financialprocesses. We will also continue with thetracking and monitoring of implementation ofaudit recommendations, working very closelywith Departmental risk management andinternal control units as well as AccountingServices unit within <strong>Treasury</strong> in the <strong>Gauteng</strong>Department of Finance. We therefore aimto balance the need to “add value” with ourobligation to deliver an independent assurance.The target for the 2011/12 financial year is to conduct94 risk and compliance audits.• Sub-Programme: Computer auditWe have moved beyond performing generalcomputer control and application controlreviews; our major focus is on providing aplethora of IT governance related servicesinformed by IT risks faced by clientdepartments based on their operationsand strategic objectives. In this regarddevelopments within the legal fraternityrelating to the governance of IT assets willbe a focus area, specifically considering thePFMA, King III code on the governance ofIT assets and other relevant legislation. Wewill also provide a host of services that webelieve will add value to the client operations,specifically with regards to the use oftechnology to perform data analysis on masterand transactional data on key functional areasidentified, e.g. procurement and finance. Thisin part is informed by the Continuous Auditstrategy that we previously communicated.We will also continue to provide assuranceservices (pro-active involvement) on keyprojects identified within client departments.Given the constraints within the operating environment,another focus area is with regards to the managementof human capital within the unit. This involves trainingand development (up-skilling) initiatives of our internalstaff on identified areas, targeting staff productivitygains, the procurement of identified technologysolutions to leverage on available capacity, recruitmentand filling of identified vacancies and, selectiveoutsourcing of audit assignments based on areaswhere we do not have internal capacity and where it isexpensive to build internal capacity, given operationalrequirements within the wider GPG IT landscape. Thisspecifically refers to the SAP platform and wider GPGNetwork architecture and infrastructure.The target for the 2011/12 financial year is to conduct24 computer audits and provide Ad hoc advisoryservices on new IT systems, projects upon request.• Sub-Programme: Performance audit• To perform 22 quality performance audits in the2011/12 financial year.• In addition to conducting value for money auditswe will also focus on auditing performanceinformation in all departments during this currentfinancial year. This will assist departments toensure that they implement corrective measuresthroughout the year to minimise qualificationsby Auditor General as they will be expressing anopinion on performance information in the nearfuture.• Sub-Programme: Audit Centre of Excellence• Implement GAS Quality Assurance Programmefocusing on ensuring consistent compliance withthe International Standards for the ProfessionalPractice of Internal Auditing of the Institute ofInternal Auditors.• Monitor implementation of business unit specificpolicies and procedures and internal auditmethodologies in line with best practice.• Strengthen the effective and efficient use of theTeamMate audit software.<strong>Gauteng</strong> Department of Finance89
SECTION 3: REPORT ON THE PERFORMANCE OF PROGRAMMES• Manage the internal audit tracking systemto monitor implementation of internal auditrecommendations by Departmental management.• Coordinate Customer Relationship Managementinitiative within the business unit; ensure customerfeedback and create awareness of audit servicesavailable in order to strengthen relations betweeninternal audit and departments.4.6 Sub-programme: Forensic AuditPurpose:To ensure sound corporate governance in the Provinceand to provide robust resource management servicesStrategic Objectives:To provide Forensic Services that includes Prevention,Detection and Investigation of Fraud and Corruption inall GPG DepartmentsMeasurable objectives:• Conduct Forensic Investigations as mandated byclients• Conduct Fraud detection Reviews• Conduct Fraud Risk Assessments;• Update Fraud Prevention Plans;• Conduct Fraud and Corruption AwarenessWorkshopsPerformance against Output targetsOutputs/ key deliverables Performance Indicators <strong>Annual</strong> TargetForensic Investigationsconducted as mandated byclientsFraud detection ReviewsconductedFraud Risk AssessmentsconductedFraud Prevention Plansupdated;Fraud awarenesscampaigns conducted% of investigation completedas per Agreed engagementterms with the clientNumber of fraud detectionreviews conductedNumber of Fraud riskassessments conductedNumber of fraud PreventionPlans UpdatedNumber of fraud Awarenesscampaigns conducted100% as per agreedengagement termswith the client11 fraud detectionreviews conducted11 fraud riskassessmentsconducted11 fraud preventionplans updated50 fraud awarenessCampaignsconductedActual Performance againstOutput target9 (100%) reports issued asper agreed engagementterms with clients01 fraud risk assessmentconducted2 fraud prevention planupdated5 fraud awarenessworkshops conducted,Reasons for deviationsReviews could not be conducted due to staffconstraintsNon-availability of client on the agreed dateNon-availability of client on the agreed dateNon-availability of client9090<strong>Annual</strong> <strong>Report</strong> 2010 / 2011
SECTION 3: REPORT ON THE PERFORMANCE OF PROGRAMMES5. Programme: Human ResourceServicesPurposeTo provide a world class customer-focused andconsultative HR service through provision of specialisedand efficient HR Solutions to the <strong>Gauteng</strong> <strong>Provincial</strong>Government (GPG) departments.Measurable ObjectivesThe measurable objectives of the programme includethe following:• To automate leave management processesthroughout the GPG;• To process client mandates in accordance with thestipulated SLAs;• To expand access to job opportunities through theestablishment of professional job centers;• To develop and implement an integrated OD andChange management plan for GPGStrategic Objectives• To build the capability, improve the quality ofservice and client experience in Human ResourceAdministration.• To transform the human resource environmentand improve efficiency through the automation oftransactional services• To align the employee wellness strategy andprogramme with the overall business strategy ofthe province.• To renew the Labour Relations provincialarchitecture through redefined content andprocesses.• To provide expert advice on OrganisationDevelopment interventions that support theintegrated strategic programme to build theorganisation and capacity of the state.• To model and position the HRS Business Unit as astrategic partner of choice through execution of keystrategic initiatives that support the organisationaltransformation and the reorganisation of theGSSC.• To strengthen and improve Business Intelligence,Monitoring and Evaluation in Human ResourceServices.<strong>Gauteng</strong> Department of Finance91
SECTION 3: REPORT ON THE PERFORMANCE OF PROGRAMMESPerformance against output targetsOutput/ key Performancedeliverables Indicators5.1 Talent Attraction ServicesRoll out ProfessionalJob centers.Functionaland integratedE-recruitmentSystemSLA performanceon advertising,response handling,special projects.No. OfProfessionalJob centersrolled out.No of utilisationreports% integrationof MAS, E-recruitment, SAPsystems% Averageperformance onSLA.5.2 Human Resource AdministrationNo ofDepartments fully departmentsautomated and fully automatedutilising SAP/ESS and utilisingSAP/ESSBaseline1 at 78 Foxstreet0 110100%10Departments’Head officescompletedESS roll- out<strong>Annual</strong> TargetLaunch of theProfessional JobCentre at MaponyaMall utilization reportsproduced for MaponyaMall PJC50% Implementationof the automatedand integrated TASProcesses100% SLA performanceon advertising,response handling,special projects.CompleteGDE districtoffices andHealth entities.Monitor leaveutilisation by GPGActual Performance againstOutput targetMaponya Mall PJC soft launchedon the 1st of February 20112 reports for Feb and March 2011issued.50% Implementation of theE-recruitment model(25% viewingand 25% for application process)100%060 ESS utilisation reports sent toclient Departments.Reasons for deviationUtilisation reports could not be produced earlieras the Maponya Mall PJC was only soft launched inFebruary 2011.Project put on hold due to possible migration of leavefunctions to GDE and GDH entities, lack of required ITinfrastructure at both departments.9292<strong>Annual</strong> <strong>Report</strong> 2010 / 2011
SECTION 3: REPORT ON THE PERFORMANCE OF PROGRAMMESOutput/ keydeliverablesPerformanceIndicators5.3 Human Resource AdministrationTimeous processingof Human ResourceAdministrationmandates.5.4 Payroll ServicesPayment of salary –related allowancesPayment and refundof deductions.Processing of salaryrelated allowances,deductions andother relatedtransactions.% Average SLAcompliancein processingof HumanResourceAdministrationmandates% compliance tothe 2days SLABaseline90%<strong>Annual</strong> Target100 % SLA compliancein processing ofHuman ResourceAdministrationmandatesActual Performance againstOutput target97.25%98% 98% (2Days) 96%Reasons for deviationSlow system.De-activation of PERSAL functions due to the uploadof tax tables and the leave functions during Jan 2011.High volumes of leave forms received from theentities.Special projects from Health and Education e.g. LWOPreversals and OSD.PERSAL system was off line on the Feb 2011 for TaxRecalculation procedure.The unit had an employee verification Special project;assisting DID with verification of 2500 employeessalaries that had to be checked and frozen onPERSAL.Assisted Dept Transport with the payment of 275hand cheques for employee salaries March 2011,The unit received an increase in workload ofgarnishee orders and amendment of garnisheebalances, coupled with staff shortages in thegarnishee and special function unit. The unit also hadto conclude the reconciliation and capturing of handcheques for employees transferred between DID andTransport.System DowntimeHigh vacancy rateSlow networkDMC in backlog, with the result of receiving hugevolumes of documents at a time.<strong>Gauteng</strong> Department of Finance93
SECTION 3: REPORT ON THE PERFORMANCE OF PROGRAMMESOutput/ keydeliverables5.5 Employee ExitsTermination ofservice contractson PERSAL, Processleave gratuity/discounting andprorate servicebonus requests,Send completepension withdrawaldocuments to GEPF.Exit interviewsPerformanceIndicatorsAverage % onSLA compliancein EmployeeExits mandate.% of casesforwarded within7 days fromdate of receiptof terminationrequest andcompletedocuments% of Exitinterviewsconductedwithin SLA5.6 Management Information ServicesHRPERSAL reportsNumber of daysto produce BIreportsBaseline<strong>Annual</strong> Target97% 100% 94%86% 100% 93%.66% 80% 100%<strong>Report</strong>completedas per clientspecificationin 4 workingdays4 days 3 daysActual Performance againstOutput targetReasons for deviationSystems downtime throughout the year, includingSARS E-filing systemShortage of resources (people, toner, paper etcAdditional Leave Administration Project contributingtowards GPG clean auditSystems downtime throughout the year, includingSARS E-filing systemShortage of resources (people, toner, paper etc9494<strong>Annual</strong> <strong>Report</strong> 2010 / 2011
SECTION 3: REPORT ON THE PERFORMANCE OF PROGRAMMESOutput/ key Performancedeliverables IndicatorsBaseline5.7 Management Information ServicesHR<strong>Report</strong>analyticalNumber of days completedreports per to produce as per clientletter ofreports specificationengagementper LOE5.8 Organisation developmentAlignedorganizationalstructures toorganizationalstrategies% oforganizationalStructuresfinalized inCompliancewithin LOE.100% withinLOE<strong>Annual</strong> Target100%100% within LOEActual Performance againstOutput target100% <strong>Report</strong> completed as perclient specification per LOEThe reconfiguration of the followingGPG departments was undertaken100% within LOE:-Office of the Premier (OoP)including <strong>Gauteng</strong> Office forGovernment Effectiveness (GOGE).-<strong>Gauteng</strong> Department of Finance(<strong>GDF</strong>).-<strong>Gauteng</strong> Department of LocalGovernment and Housing (GDLG &H)>-<strong>Gauteng</strong> Department of Roads andTransport (GDRT).-<strong>Gauteng</strong> Department ofInfrastructure Development (GDID).-<strong>Gauteng</strong> Department of Health andSocial Development (GDH & SD).The organizational structures of the<strong>Gauteng</strong> Department of EconomicDevelopment (GDED) and <strong>Gauteng</strong>Department of Sports, Recreation,Arts and Culture were re-aligned100% within the LOE.Reasons for deviation<strong>Gauteng</strong> Department of Finance95
SECTION 3: REPORT ON THE PERFORMANCE OF PROGRAMMESOutput/ keydeliverablesPerformanceIndicators5. 9 Management Information ServicesImplementedestablishmentchanges on PERSAL% of SLAachievement ofall technicallycorrectRequestsreceivedBaseline<strong>Annual</strong> Target100% 100% within SLAActual Performance againstOutput target90% within SLA l: The followingrequests were received :Social Development = 1.Community Safety = 4.SRAC - 9.<strong>GDF</strong> = 7.GDARD =5.OoP = 19.GDED =22.Local Government & Housing = 4.GDRT = 1TOTAL = 72The average SLA/LOE achievementis 210%.Reasons for deviation9696<strong>Annual</strong> <strong>Report</strong> 2010 / 2011
SECTION 3: REPORT ON THE PERFORMANCE OF PROGRAMMESOutput/ keydeliverablesPerformanceIndicators5. 10 Management Information ServicesDeveloped &implementedOD & ChangeManagementinterventions%implementationofIntegrated ODandChangemanagementPlan within LOE.Baseline<strong>Annual</strong> Target100% 100% within LOEActual Performance againstOutput target100% within LOE: One Project(SRAC) was completed within theLOE.One Project (Charles HurwithCentre) was completed 100%within LOE.DED: Dinokeng - one project wascompleted 100% within LOE.Reconfiguration Change Agentstraining 100%Focus Groups for Staff Members100%Climate survey analyses andrecommendations 100%Senior Management Team (SMT)presentation was conducted 20%.FINANCE: <strong>Gauteng</strong> Fund - oneproject was completed 100%within LOE.Automation of Termination(HR21and 24 HCM)LOE 100%Change Strategy 100%Workshops 100%<strong>Report</strong> 100%Post implementation supportE-RecruitmentChange Management Strategy100%.Reasons for deviation<strong>Gauteng</strong> Department of Finance97
SECTION 3: REPORT ON THE PERFORMANCE OF PROGRAMMESOutput/ key PerformanceBaselinedeliverables Indicators5. 11 Management Information ServicesJob Evaluation% SLAachievementon JE100%% of policies100% withinDeveloped policies developed withinSLASLA5. 12 Labour RelationsTrained clientdepartments on LRLR AdviceInvestigation OfficerreportsPresiding officersreports% trainingcompletedon receivedrequestsAverage SLAcomplianceAverage % SLAcomplianceAverage % SLAcompliance100% of allrequests100% of allrequest<strong>Annual</strong> Target100% SLA achievementon JEActual Performance againstOutput target100% SLA achievement on JE.Thefollowing request were receivedfrom GPG departments:GDARD = 5SRAC = 4.GDRT = 1.<strong>GDF</strong> = 2.OoP = 5.DED = 1.GLG & H = 5.GDE = 1GCRA = 2.DID = 2.100% within SLA No requests have been received.100% of all requests No requests received100% of all request 100% compliance60% 100% 53% average60% 100% 2% averageReasons for deviationAvailability of witnesses and lack of support by clientdepartments.High Presiding Officer Vacancy rate severely impact oncase load of remaining PO’s and their ability to dealwith reports within the legislated time frames.Internal challenges with regard to quality assuranceprocesses.9898<strong>Annual</strong> <strong>Report</strong> 2010 / 2011
SECTION 3: REPORT ON THE PERFORMANCE OF PROGRAMMESOutput/ keydeliverablesPerformanceIndicators5. 13 Employee Health and WellnessIntegrating allcomponentsof EHWP i.e.OHS; WellnessManagement, Healthand Productivity andHIV/AIDS and TBCompliance reportsNumber ofstrategic reportsgenerated onthe integrationprocess to GPGDepartments.No of SLAcompliancereportsBaseline4 strategicreportsgeneratedon theintegrationprocessto GPGDepartments.<strong>Annual</strong> Target4 24 4 3Actual Performance againstOutput targetReasons for deviationHigh vacancy rate and Budget to conduct feasibilitystudy and readiness assessments per GPGDepartment.Delays in the finalisation of the EHWP Core Tenderaffected report production.Period July – October 2010 – Service Provider did notprovide relevant and requested information.KEY ACHIEVEMENTS• The Employee Exits service unit successfullypiloted the automation of the termination processat the <strong>Gauteng</strong> Department of Finance (<strong>GDF</strong>).This will ensure expedition of termination, thusreducing debt as a result of salary over payments.• In response to the high CV volumes the unit inTalent Attraction services successfully completedthe first phase of automating the recruitmentprocesses. The E-recruitment model allows jobseekers to view and apply for GPG job opportunitiesfrom the Maponya Mall and 78 Fox StreetProfessional Job Centres and from any part of theworld if they have internet access. This is an effortto improve the response handling turnaroundtimes in an area that has previously led to clientcomplaints. During this financial year the Hire toRetire unit has supported job creation by providingan additional access to GPG jobs through theautomated recruitment site at Maponya Mall JobCentre.• In line with the Shared Services growth trajectoryHire to Retire (H2R) has expanded its consultingservices to include leave and terminationsmanagement through consultative workshopsand individual departmental consultation. This isas a value adds service that has come about asa result of automation of leave and preparation toautomate termination process.• Payroll service unit has successfully automateditem statements and payrolls. Furthermore, wehave piloted the automation of pay slips and IRP5certificates at the <strong>GDF</strong>. These are now available onthe portal for employees to access and downloadas and when necessary.• In an effort to reduce the high volumes of manualcapturing of payment of allowances we have nowautomated the process and this has reduced theprocessing time from 3 days to 1 day from date ofreceipt of mandate from GPG departments.<strong>Gauteng</strong> Department of Finance99
SECTION 3: REPORT ON THE PERFORMANCE OF PROGRAMMESWe have rolled out this automated process to 17entities within GPG.• H2R in partnership with the Office of ThePremier played a central and strategic role inthe reconfiguration of the <strong>Gauteng</strong> <strong>Provincial</strong>Government; by implementing the transformationagenda. To this end the structures of the Office ofthe Premier and <strong>Gauteng</strong> Office for GovernmentEfficiency have been submitted and consultedwith the Department of Public Service andAdministration DPSA). The following departments’organisation structures are in draft format andready to be submitted and consulted with DPSA;Health and Social Development, EconomicDevelopment, Local Government and Housing,Infrastructure, Roads and Transport and Finance.• The Human Resource Information Serviceenvironment has been one of the stable environmentswith minimal client complaints recorded and anaverage of a 100% SLA performance.• The Employee Health and Wellness environmenthas also grown with the function changingits model to integrate disease management,Occupation Safety Health and work-life balance.REASONS FOR MAJOR VARIANCES• The unavailability of key stakeholders in clientdepartments resulted in OD unit changemanagement implementation phase being partiallycompleted with only two workshops outstanding.• Non performance in sending complete pensionwithdrawal documents to GEPF is as a resultof PERSAL down time, Public transport (BRT)strike and transactions that awaiting approval onsuspense file.• A high volume of Human Resource Administrationmandates that are above the norm led to deviationin SLA.• High vacancy rateOUTLOOK FOR THE YEAR AHEAD(2011/2012)Roll out automated termination services to GPGdepartments already on ESS.• Complete the phase 2 of the e-recruitment system.• Conclude the reconfiguration of GPG departmentsthrough submission and consultation oforganisational structures of the outstandingdepartments• The Employee Health and Wellness environmentwill endeavour to increase utilisation of the EHWPservices to 20% over the MTEF.100100<strong>Annual</strong> <strong>Report</strong> 2010 / 2011
SECTION 3: REPORT ON THE PERFORMANCE OF PROGRAMMES6. Programme: Procure to PayServicesPurposeThe role of the Business Unit is to provide procurementand related services to <strong>Gauteng</strong> <strong>Provincial</strong> Government(GPG) Departments. This is done in a customerfocusedand socio-economically responsible mannerby using technology as a key enabler in automating,standardising and streamlining processes.The Unit strives to drive and redirect provincial spendingpatterns as a means of promoting B-BBEE within theprovincial economy and achieving empowermenttargets. These empowerment initiatives are also gearedtowards creating decent jobs and building a growinginclusive economy.Measurable ObjectivesThe programme aims to achieve the followingmeasurable objectives:• To assist the GPG Departments to procure goodsand services in an effective and efficient mannerensuring that these goods and services arepurchased at the right price, at the right time andare of the desired quality;• To effect cost savings in specific commodities;• To facilitate an increase in the percentage value ofcontracts awarded to BEE / SMME companies;• To increase the number of enabled vendors tobidding opportunities, especially companies ownedby women, youth and people with disabilities;• To generate various industry and commodityspend reports for the Province.Strategic ObjectivesIn line with the above the Procure to Pay Business Unitsets out to meet the following key objectives:• To provide procurement and related services toGPG Departments, developing and implementingsourcing strategies that will assist them topurchase goods and services effectively fromsuppliers, balancing financial efficiency with socioeconomicoutcomes.• Provide a comprehensive contracts managementservice, ensuring effective and efficient utilisationof all contracts awarded.• To ensure that all GPG suppliers are paid timeouslyand accurately.• To optimise and support the utilisation ofprocurement processes and systems, updatingand maintaining the materials and servicescatalogue and providing tender administrationservices.• To monitor supplier business agreements overthe lifecycle of the contracts awarded, therebyensuring that all stakeholders meet their respectiveobligations to deliver the business and operationalobjectives expected from the contracts.• To provide support to the buying functionin ensuring quality service delivery and themaintenance of a central GPG vendor databasewith pre-qualified vendors; and• To provide development for BEE / SMME vendorsin support of GPG’s B-BBEE strategy by focusingon balancing commercial and transformationalimperatives.<strong>Gauteng</strong> Department of Finance101
SECTION 3: REPORT ON THE PERFORMANCE OF PROGRAMMESPerformance against output targetsOutput/ key deliverables6.1 Sub-programme: Strategic SourcingTo develop and implement improvedsourcing strategiesPerformance IndicatorsCompliance with SLA in respect of the RFP process(tendering).<strong>Annual</strong>Target90 daysCompliance with SLA (number of days) in respect ofthe RFQ process (quotations): Medical:-Consumables 7 5Equipment 11 9Professional Services 7 4ICT & Professional Services 7 3FMCG:Perishables 7 5Chemicals 7 3Stationery 7 2Clothing 13 2Books 13 2Assets, Energy & Facilities 13 9Percentage Contract utilisation. 90% 87%Ratio between contracts spend versus Request forQuotation (RFQ). spend80 : 20 83 : 17Actual Performanceagainst Output targetMedical Commodity 69ICT 72Professional Services 77FMCG 85Assets, Energy & Facilities82Reasons for deviation102102<strong>Annual</strong> <strong>Report</strong> 2010 / 2011
SECTION 3: REPORT ON THE PERFORMANCE OF PROGRAMMESOutput/ key deliverablesPerformance Indicators<strong>Annual</strong>Target6.2 Sub-programme: Procurement SupportOptimise and support the utilisation ofProcurement processes and systems for Number of sites visited and supported. 930 645GPG users.Number of Procurement Officials trained on the system. 550 848Compliance in respect of requests created on timefor Material and Service Masters.97% 100%6.3 Sub-programme: Vendor Management & DevelopmentEnsure that BEE/SMME enterprisesare afforded procurement businessopportunities and that the GPGCentralised Vendor Database is managedand maintained effectivelyAttainment of GPG Preferential Procurement spendtargets.Actual Performanceagainst Output targetHDI 80% HDI 59,6%Women 30% Women 4,3%PwD 5% PwD 0,0%Youth 10% Youth 1,3%Maintaining a Centralised Vendor Database. 70% 70%6.4 Sub-programme: Accounts PayableAccurate payment of suppliers within SLA % of suppliers paid within SLA 98%Reasons for deviationThe <strong>GDF</strong> Procure to Pay Business Unit is of the opinionthat the GPG Preferential Procurement spend targetsare not based on any sound research and thereforemay not be practical and achievable. Analysis of theYTD spend for <strong>GDF</strong> reveals the following:-1. Total spend was R437,5 million and the <strong>GDF</strong>utilized 270 companies. Of these companies the<strong>GDF</strong> spent 89,4% of it’s total spend with the Top 20Companies. Preferential Procurement spend achievedwithin the Top 20 companies is relatively low astabulated below:-HDI 59,5% / Women 3.2% / PwD 0.0% / Youth 0.0%2. Further analysis of the total YTD spend reveals thatthe largest portion is in the ICT / Professional Servicescommodity group, which is 97%. Whilst PreferentialProcurement spend in this group is below target at:-HDI 60,2% / Women 4,2% / Youth 1,3% / PwD 0,0%3. Finally, budget restrictions meant that expenditurehad to be curtailed. R437.5 million is only 42% of the<strong>Annual</strong> Revised Budget of R1,046.5 million for the<strong>GDF</strong> (Goods & Services).<strong>Gauteng</strong> Department of Finance103
SECTION 3: REPORT ON THE PERFORMANCE OF PROGRAMMESKEY ACHIEVEMENTSKey results achieved during the 2010 / 2011 financialyear include:• For the second successive year now the Unitwas awarded the prestigious ISO9001:2008certification by the SABS. This is indicative of thehigh standards of excellence and thoroughness ofthe procurement processes.• 2% of all <strong>Provincial</strong> spend on agricultural producehas been sourced directly from emerging farmers,thus assisting in creating decent work and buildinga growing, inclusive economy and sustainablelivelihoods.• 74, 1% of maintenance contracts for medicalequipment have been awarded to BEE supplierswho are Original Equipment Manufacturer(OEM) accredited agents. In addition 8% savingsamounting to R11, 2 million was realised on theprocurement of Medical Equipment.• Contracts Management Solution: The Structurehas been approved. Processes have been prepared,training finalised and the team is operational. 93%of awarded contracts are loaded (298 of 320). 77%of loaded contracts are automated (228 of 298).• Innovative and effective processes have beenimplemented to deal with process and regulatoryinhibitors to the payment of small businesses.~ Preparations for the piloting of electronicsubmission of supplier invoices have beenfinalised, resulting in reduced costs and theelimination of payment delays.~ An automated reconciliation system hasbeen piloted with 5 suppliers with the aim ofimproving their debtor’s management. Thesystem will be rolled out to an additional 10suppliers by March 2011.~ Preparations for the piloting of the PurchaseCard project during February have beenconcluded. The project objective is to enhancebusiness opportunities and improve cashflows especially for SMME’s.• The Accounts Payable Sub-directorate successfullycompleted the roll-out of E-invoicing at theremaining two Departments, i.e. GDID and GDRT.• Localisation of Vendors has been addressed inthe Pre-qualification process for 2010/11 andthis will be carried forward into 2011/12. A list ofpre-qualified Vendors indicating the geographiclocality of each Vendor has been made available toall GPG entities. Thus enabling entities to identifyVendors within their immediate vicinity, therebyultimately impacting service delivery positively andboosting local economies. A total of 3,246 vendorshave been registered successfully, 6,630 vendoramendments have been made thus servicingGPG more efficiently by providing updated vendorinformation.• The function of contract call-offs in the FMCG andMedical consumables commodities have beendecentralised to GPG entities as well as to theMedical Supplies Depot in Auckland Park, thusensuring speedy service delivery on certain goodsand services.• Automation of Pretoria Oral and Dental facilitywhich was not in scope in the 2010/11 financialyear was completed. This assisted the entity totransact directly on the system thereby speedingup purchasing needs. Automation of Emergency104104<strong>Annual</strong> <strong>Report</strong> 2010 / 2011
SECTION 3: REPORT ON THE PERFORMANCE OF PROGRAMMESmedical Services and Carletonville Hospital onSRM completed successfully. Provided <strong>Provincial</strong>procurement officials Remaining Line Structure(RLS) training and end-user training, thus ensuringoptimal use of the Procurement SAP / SRM systemto facilitate the effective and efficient buying ofgoods and services.• In ongoing endeavours to ensure optimal usageof all procurement systems, the Unit conductedextensive on-site training and coaching of usersof system functionality at GPG entities. In total645 site visits were conducted during which time1,240 users were assisted. In addition a total of848 procurement officials in GPG were providedwith business process training and SAP R3/SRMtraining.• Efforts to provide support to vendors falling withinthe targeted groups continued with the followingresults achieved:INTERNAL VENDOR AWARENESS SESSIONSEXTERNAL VENDOR AWARENESS SESSIONS# Number of sessions conducted 45 16# Total number of attendees 793 386# Number of Black attendees 793 386# Number of Women attendees 320 239# Number of Youth attendees 336 109# Number of attendees who are PwDs 39 6<strong>Gauteng</strong> Department of Finance105
SECTION 3: REPORT ON THE PERFORMANCE OF PROGRAMMESIn addition 13 successful Road shows were heldduring the year with a total of 12,900 individualsattending.• The Market Research team assisted in developinga <strong>Provincial</strong> Anti-Corruption Strategy to be tabledthis year at Legislature.• This Unit also benchmarked all STATSSA marketrelated prices into the Shared Service Centre’scatalogue of material prices. This will facilitateeasy comparison of supplier prices.• The Medical Commodity team embarked onroad shows to market contracts that have beenfinalised.• The cost saving initiative on “Labour SavingDevices” and office paper was rolled out to all GPGentities.REASONS FOR MAJOR VARIANCESIn terms of the under-achievement against the<strong>Provincial</strong> Targets for Preferential Procurement spend;it is worthy to note that the <strong>GDF</strong> performance wasadversely affected by the non-availability of targetedVendors in the high spending commodities, namely ICT,Professional Services and Transportation Services.OUTLOOK FOR THE YEAR AHEAD(2011/2012)The Procure-to-Pay Business Unit will focus on thefollowing key initiatives during the 2011/2012 financialyear:• Ensure that all tenders are awarded within theprescribed 90 days SLA target period for 95% ofthe time.• As regards the process of buying on quotation,adhere to the prescribed average 8 days SLA for95% of the time.• Manage and maintain an electronic database ofGPG contracts which must be 100% compliant.• Ensure strict adherence to the 30 days SLA forpayment of suppliers, 98% of the time.• A minimum of 600 procurement officials to beprovided systems training within the Province.• Requests for the creation of material and servicemasters will be done within SLA 97% of the time.• SSC spend analysis aligned to Commodity researchwill be channelled toward achievement of the GPGPreferential Procurement Targets:-~ 80% of procurement to be spent on B-BBEEenterprises.~ 30% on Qualifying Small Enterprises withequitable gender participation.~ 20% on Emerging Micro Enterprises withequitable gender participation~ 70% of the total on SA manufacturedproducts.~ 30% spent on Female owned companies.~ 10% spent on Youth owned companies.~ 5% spent on PwD’s owned companies.• Develop a system that will simplify the process oftracking market related prices and benchmarkingthese to tender prices.• To deal efficiently and effectively with financialrisk and price escalations 100% within prescribeddays SLA.106106<strong>Annual</strong> <strong>Report</strong> 2010 / 2011
SECTION 3: REPORT ON THE PERFORMANCE OF PROGRAMMES7. Programme: PROVINCIALACCOUNTING SERVICESPurpose• To provide strategic leadership, guidance andsupport to all GPG departments in terms offinancial management.• To ensure that there is transparent and effectivefinancial management and reporting in theprovincial departments and entities.Strategic Objectives:• To provide proactive strategic and operationalinstitutional support to stakeholders, thusenabling them to deliver quality services.• To ensure the development and implementation ofintegrated and efficient systems and processes inFinance.• To provide cashbook and banking services to GPGdepartments.• To optimise cash flow management in GPG.• Optimum recovery and disclosure of monies owedto the GPG Departments.• To provide proactive strategic and operationalsupport in terms of tax legislations and otherstatutory deductions.• To optimise cash management and implementcash management systems for the Province.• Preparation of audited financial statementsfor the <strong>Provincial</strong> Revenue Fund and revenuemanagement including conditional grants.• To ensure effective and efficient management ofassets in GPG.• To provide guidance and support on accountingmatters to GPG Departments and entities, thusenabling quality financial reporting.Measurable objectives:• To ensure sufficient funds in order to fund theoperations of the <strong>Provincial</strong> Government.• Account for all monies received by GPG.• Collection of Employee, ex-employee and Supplierdebts, as per TR and PFMA• To ensure compliancy to legislative requirementand effective management of statutory deductionrelated ledger accounts.• To ensure sound revenue management for theprovince• To ensure accountability and transparency throughquality reporting.KEY ACHIEVEMENTS• <strong>Provincial</strong> Accounting Services (PAS) is a newprogramme within the <strong>Treasury</strong> Division. It wasestablished after reorganization in the provincethat was driven by the need to extract efficienciesthrough alignment of services and reconfigurationof processes. As a new programme, having tocontend with the challenges that are inherent inany mergers, PAS has performed exceptionally inthe short space of time. These achievements arehighlighted below:E-Journal<strong>GDF</strong> completed the deployment of the E-journal projectto all departments and institutions in February 2011. Thefunction of capturing journals was consequently migratedback to the departments thus according them autonomyin managing the ledger accounts. Amongst other benefitswere improving the operating efficiencies and reductionin processing cost of journals.Electronic Receipting (E-receipting)<strong>GDF</strong> has completed the roll out of the E-Receiptingproject to all Health and Social Development entitiesin July 2010. This has resulted in improvement ofoperating efficiencies amongst others is the reductionby 90% of manual receipts and deposits beingcaptured.<strong>Gauteng</strong> Department of Finance107
SECTION 3: REPORT ON THE PERFORMANCE OF PROGRAMMESCompliance to Statutory tax requirementIn the year under review the unit has successfullycomplied with the tax legislation in submitting theEMP 501 on the required due date to SARS. This hasensured that GPG employees receive the IRP5s on timeand in turn comply with the tax legislation regardingsubmission of tax returns.<strong>Provincial</strong> Revenue Fund and Consolidated <strong>Annual</strong>Financial StatementsThe <strong>Provincial</strong> Revenue Fund attained a clean auditopinion, which is an improvement on the previousfinancial year audit opinion. The unit has also finalisedthe consolidated financial statements and duly tabledthem in the legislature.Unauthorised ExpenditureThe unauthorised expenditure of R1.4 billion wasapproved by the legislature and has since been clearedin the books of the affected departments.Financial Management Capability Maturity ModelThe unit has successfully assisted departments tofinalise the survey of Financial Maturity CapabilityModel and has used the results to formulate an actionplan to assist the departments in addressing identifiedinefficiencies.Appointment of provincial bankerThe unit has successfully appointed a new provincialbanking services provider (FNB) and has since migratedfrom the previous service provider.Cash Flow ManagementThe unit had to use an overdraft facility in the first quarterof the financial year as a result of cash requirementpressures from departments. However during the latterhalf of the financial year, <strong>GDF</strong> managed to markedlyimprove the situation and operated without theoverdraft and closed the year with a positive balance.Other InitiativesIn our endeavour to monitor the departments’compliance to PFMA, <strong>Treasury</strong> regulations and DORAwe implemented the following:• Enhanced the system to produce a report to assistin monitoring the departments’ accruals.• Configured the system to schedule the payment ofinvoices in accordance to the terms of paymentsor in terms of priority of the invoice.• Issued guidelines to departments regardingthe use of manual orders except in emergencysituations.• Ring - fenced all schedule 5 conditional grants andinfrastructure funds to ensure that the funds arebeing utilised for the purpose intended.We encountered challenges during the year underreview and these include:• Budget constraints which impacted adversely onthe implementation of the following two projects:~ Automation of the debts take on process.~ Cash management system.• Increase in departmental debts for collection bythe unit due to delays in termination of employeeson the system. Departments’ delay in paying thesuppliers has resulted in suppliers refusing ordelaying in settling their debts• The departments’ continued demand for cash thatexceed their cash allocation remains an ongoingand serious challenge for the unit. <strong>GDF</strong> hasimplemented a process that ensures that monthlycash allocation to departments are congruent tocash availability in the province.108108<strong>Annual</strong> <strong>Report</strong> 2010 / 2011
SECTION 3: REPORT ON THE PERFORMANCE OF PROGRAMMESPerformance against output targetsOutputs/ key deliverables Performance Indicators <strong>Annual</strong> Target Actual performance against targetReasons fordeviationsMinimise the use of credit facilityAmount of overdraft facility utilsed1.6 billion R1 billion.Overdraft maintained within the target.Maximise revenue collection Amount of credit interest received. 30 million 33.3 millionTimeous and accurate transfer offundsBank exceptions cleared accuratelyand timeouslySuccessful closure of the financialperiodsEmployee debts deducting onPERSAL% Transfer of funds transferred and time taken.% of exceptions cleared before month-endclosure.Rate of successful closures% Of employee debts deducting within 60 daysfrom date of take-on.99% of fundstransferred within1 Day100% ofexceptionscleared100% of closures100%Supplier debts Collected % Collection of Supplier debts> 90 days. 15% 27%Supplier debts Collected % Collection of Supplier debts< 90 days. 75% 25%Ex-Employee debts Collected % Collection of ex-employee debts >90 days. 5% 8%Ex-Employee debts Collected % Collection of ex-employee debts
SECTION 3: REPORT ON THE PERFORMANCE OF PROGRAMMESOutputs/ key deliverables Performance Indicators <strong>Annual</strong> Target Actual performance against targetReasons fordeviationsAccurate EMP201 submittedtimeouslyIncome Tax accounts clearedaccurately monthly.Control of <strong>Provincial</strong> Revenue Fund(PRF)Provision of technical advice andsupport in Asset Management andFinancial <strong>Report</strong>ing.Accurate and timeous completion of monthlyreconciliation’s.Positive audit opinion on PRF.Resolve all queries raised by departments within3 days.EMP201submitted toSARS by the 7thof each monthClean auditopinion100% submission of EMP201 within as perSARS deadlines.Clean audit opinion100% 100% of queries resolved within 3 daysOUTLOOK FOR THE YEAR AHEAD(2011/2012)In our endeavour to instil and engender a stringentculture of financial control and management, <strong>GDF</strong>intends to monitor closely the measures that havebeen implemented in the financial year 2010/2011.Some of these measures include• Ring-fencing the conditional grants andinfrastructure funds,• Ensuring that the age analysis of the accruals isless than 30 days in a given month.• Departments operate within the agreed cashforecasts and/or allocations• Reduce substantially the unauthorised expenditure• Decrease inflow of ex-employee debts• Reduce reliance on overdraft for funding purposes• Ensure that the employees in the system arevalidatedWe will focus on immovable assets to ensure thatall user departments comply with immovable assetminimum requirements. The unit will work closelywith the Department of Infrastructure Developmentto ensure compliance with the new act on immovableassets (GIAMA). In addition, the unit will ensurethe implementation of the Inventory ManagementFramework, and plans are in place to do massivetraining in all departments i.e. the necessary changemanagement initiatives are strictly enforced.The unit will participate in the GPG Operation CleanAudit to ensure that all GPG departments achieve cleanaudits by 2014 as per Department of CooperativeGovernance’s mandate. The unit will assist thedepartments in developing action plans to address auditissues and will monitor the implementation thereof.110110<strong>Annual</strong> <strong>Report</strong> 2010 / 2011
SECTION 3: REPORT ON THE PERFORMANCE OF PROGRAMMES8. Programme: TechnologySupport ServicesPurposeTechnology Support Services (TSS) is the Informationand Communications Technology (ICT) shared servicesprovider for GPG, responsible for all transversal or crossdepartmental ICT infrastructure. This infrastructureincludes applications, networks, hardware, softwareand any other ICT related assets. TSS is furtherresponsible to manage these assets on a daily basis toensure an adequate ICT enabled working environmentfor all departments.The programme comprises 9 sub-programmes• Information Communication Technology ProjectOffice (ICTPO)• Enterprise Resource Programme (ERP)• Service Management• Information Security• Planning and Architecture• Application Management• Operations Management• E-Gov• Change Management8.1 Sub-programme: InformationCommunication TechnologyProject Office (ICTPO)Strategic Objective:To effectively manage a portfolio of ICT programmesand projects improving the delivery of operational andstrategic initiatives.Measurable Objectives• To ensure ICT project budgets are managed withinthe tolerance indicators• To ensure ICT project timelines and managedwithin the tolerance indicatorsPerformance against Output targetsOutputs/ KeydeliverablesPerformance Indicators<strong>Annual</strong>TargetActual performanceagainst <strong>Annual</strong> TargetReasons for deviationManage ICT projectbudgets% of projects managed withinthe defined budget tolerance.90% 100%Manage ICT projecttimelines% of projects managed withinthe defined time tolerancelevel.90% 60%Time delays within projects were as a result of the following factors.The prerequisites for a number of projects to start are now beingdone by the project team causing tasks to be extended. Many ofthe tasks within projects that were earmarked to be completedby automotive processes now require manual interventions. Themanual interventions required additional time to complete which putspressure on deadlines.<strong>Gauteng</strong> Department of Finance111
SECTION 3: REPORT ON THE PERFORMANCE OF PROGRAMMES8.2 Sub-programme: ERPStrategic Objectives:Extend the deployment of the ERP functionality that is essential to efficientimprovement of the GPG processes.Measurable objectives:• To deliver the requested system enhancements and improvement on time tobusiness.• To increase the number of deployed ERP functionality that is crucial to theefficiency of the Department of Finance’s process automation.• To expand ERP functionality into the GPG departments.Performance against Output targetsOutputs/ key deliverablesPerformance Indicators<strong>Annual</strong>TargetActualPerformanceAgainst <strong>Annual</strong>TargetReasons for deviationThe deployment of Human CapitalManagement (HCM) within GPG Departments.Number of deployment of Human CapitalManagement (HCM) module within GPGDepartments.2 0Reprioritisation of projects has beenfinalised and this project will not beimplemented in this financial year.The deployment of Budgeting and Forecastingwithin GPG DepartmentsNumber of deployment of Budgetingand Forecasting module within GPGDepartments.9 0Reprioritisation of projects has beenfinalised and this project will not beimplemented in this financial year.The deployment of CRM within GPGDepartments.The deployment of CRM module within GPGDepartments.9 0Reprioritisation of projects has beenfinalised and this project will not beimplemented in this financial year.112112<strong>Annual</strong> <strong>Report</strong> 2010 / 2011
SECTION 3: REPORT ON THE PERFORMANCE OF PROGRAMMESOutputs/ key deliverablesPerformance Indicators<strong>Annual</strong>TargetActualPerformanceAgainst <strong>Annual</strong>TargetReasons for deviationThe deployment of Asset Management withinGPG DepartmentsThe deployment of Asset Managementmodule within GPG Departments.8 4Project ongoing with otherdepartments.The deployment of Performance Managementsystem within GPG departments.The deployment of PerformanceManagement system module within GPGDepartments.6 0Reprioritisation of projects has beenfinalised and this project will not beimplemented in this financial year.The deployment of Governance Risk andcompliance in GPGThe deployment of Governance Riskand compliance module within GPGDepartments.10 0Reprioritisation of projects has beenfinalised and this project will not beimplemented in this financial year.The deployment of Contracts and InventoryManagement System module within GPGDepartments.The deployment of Contracts and InventoryManagement System module within GPGDepartments.2 0 Awaiting project awarding<strong>Gauteng</strong> Department of Finance113
SECTION 3: REPORT ON THE PERFORMANCE OF PROGRAMMES8.3 Sub-programme: Service ManagementStrategic Objectives:• To provide proactive strategic and operational institutional support to stakeholders, thus enabling them to deliver quality services.• To coordinate the activities of the TSS business unit to achieve continuous service improvement through the monitoring, measuring and reporting on ICT Service Levelsincluding the management of external IT Vendors that form part of the Service Delivery chain.Measurable objectives: <strong>Report</strong>s communicated to ClientsPerformance against Output targetsOutputs/ key deliverables Performance Indicators <strong>Annual</strong> Target Actual Perfor-mance Against <strong>Annual</strong> Target<strong>Report</strong>s communicated to ClientsNumber of <strong>Report</strong>s communicated toClients.11 departments12 client11 departments12 client114114<strong>Annual</strong> <strong>Report</strong> 2010 / 2011
SECTION 3: REPORT ON THE PERFORMANCE OF PROGRAMMES8.4 Sub-programme: Information SecurityStrategic Objectives:To ensure effective and efficient management of the <strong>GDF</strong> and its programmesMeasurable objectives:• Reduction of number of ICT number of incidents.• ICT User-Awareness and Training.• Develop and implement a DRP site.• Number of ICT policies developed and reviewed.• Number of ICT risk assessments conducted.• Number of threats resolved.Performance against Output targetsOutputs/ key deliverables Performance Indicators <strong>Annual</strong> TargetReduction of the number of ICTsecurity incidents.Reduction of the number ofIncidents.400 323Actual Performance againstOutput targetReasons for DeviationICT User-Awareness and Training Number of ICT- Users trained. 1500 1586Develop and implement a DRP site.DRP site identificationDevelopment of DRPStrategy for <strong>GDF</strong>Not achievedDevelopment of strategydelayed by reconfigurationprocess.Number of ICT policies developed andreviewedPolicy endorsement by CIOCouncil.911 ICT policies reviewed anddevelopedNumber of ICT riskassessment conducted.Number of risk assessmentsconducted.4 4 risk assessments conductedRollout of Security OperationCentre (SOC).33% 33%<strong>Gauteng</strong> Department of Finance115
SECTION 3: REPORT ON THE PERFORMANCE OF PROGRAMMES8.5 Sub-programme: Planning and ArchitectureStrategic Objectives:• To provide the GPG with ICT architecture planning and advisory services for the optimisation of technology utilisation.• To ensure cost efficiencies and consolidating resources for economies of scale.Measurable objectives:• Develop baseline architecture reports• Develop gap analysis reports• Develop architecture roadmapsPerformance against Output targetsOutputs/ key deliverablesDevelop baseline architecturereportsPerformance IndicatorsNumber of base line<strong>Report</strong>s developed.<strong>Annual</strong>TargetActual Performanceagainst Outputtarget6 No progressDevelop gap analysis reports Number of gap analysis reports developed. 6 No progressDevelop architecture roadmaps Number of roadmaps developed. 6 No progressReason for deviationProject funds not available due to projects reprioritisation.Project funds not available due to projects reprioritisation.Project funds not available due to projects reprioritisation.116116<strong>Annual</strong> <strong>Report</strong> 2010 / 2011
SECTION 3: REPORT ON THE PERFORMANCE OF PROGRAMMES8.6 Sub-programme: Application ManagementStrategic Objectives:To ensure cost efficiencies and consolidating resources for economies of scaleMeasurable objectives:• System Availability• Number of Calls logged by Service DeskPerformance against Output targetsOutputs/ key deliverables Performance Indicators <strong>Annual</strong> targetSystem AvailabilityCalls logged by the service deskNumber of hours the application isavailable.Percentage of application incident supportresolved within SLA.22 hours perday (92%)Actual Performance againstOutput target19 hrs95% 59%Reasons for DeviationHardware failure.Data centre Instability.Calls not properly managed due tochange in Management.8.7 Sub-programme: Operations ManagementStrategic Objectives:To provide an available ICT infrastructure that meets GPG business needs.To be a centre of excellence in the public sector in strategic and innovative information solutionsMeasurable objectives:• Providing WAN connectivity to 245 sites• Provide access and infrastructure to transversal systems hosted by SITA• Provide messaging services to all GPG departments• Provide internet access to all GPG departments<strong>Gauteng</strong> Department of Finance117
SECTION 3: REPORT ON THE PERFORMANCE OF PROGRAMMESPerformance against Output targetsOutputs/ keydeliverablesICT infrastructureAvailabilityPerformanceIndicatorsHours of WANavailableHours of LANavailableHours of serveravailableHours ofData CentreinfrastructureavailableReduce thefootprint in the DataCentreHours of internetavailability<strong>Annual</strong> Target Actual performance target Reasons for deviations715 hrs permonthX 12 months= 8 580 hrs715 hrs permonthX 12 months= 8 580 hrs715 hrs permonthX 12 months= 8 580 hrs8 394 hrs achieved8 514 hrs achieved8 448 hrs achieved24 hrs 24 hours per day360 servers 360 servers715 hrs permonthX 12 months= 8 580 hrs8 514 hrs achievedTelkom unable to attend to logged calls within SLA’s due to Telkom IndustrialStrike.<strong>GDF</strong> Data Centre experienced an unplanned electrical power shutdown dueto a faulty electrical trip switch.<strong>GDF</strong> Data Centre experienced an unplanned electrical power shutdown dueto a faulty electrical trip switch.<strong>GDF</strong> Data Centre experienced an unplanned electrical power shutdown dueto a faulty electrical trip switch.Existing server’s specifications cannot accommodate virtualisation.The existing server platform is 32bit and preferred virtualisation platform is64bit servers.Existing servers cannot accommodate large volumes of RAM (Memory)required for effective virtualisation.<strong>GDF</strong> Data Centre experienced an unplanned electrical power shutdown dueto a faulty electrical trip switch.118118<strong>Annual</strong> <strong>Report</strong> 2010 / 2011
SECTION 3: REPORT ON THE PERFORMANCE OF PROGRAMMESOutputs/ keydeliverablesPerformanceIndicators<strong>Annual</strong> Target Actual performance target Reasons for deviationsHours of messagingavailability715 hrs permonthX 12 months= 8 580 hrs7 932 hrs achieved135 hrs Delay in delivery of e-mails and queuing of e-mails which resulted inthe “Denial of Service” attack through the W32.SillyIM worm virus (Zero dayattack).Corruption of exchange data bases on stores 4 & 6 only.Exchange mail stores 4 and 6 were partially down 13/1/2011 for 17hrsand 4/2/2011 16hrs due to database corruption, caused through loss ofconnectivity to the drive letters.Number ofadditional WANlinks200 sitesQ1 34 sitesQ2 25 sitesQ3 20 sitesQ4 8 sitesTelkom freeze in July due to FIFA Soccer World Cup.Telkom infrastructure sites not ready.Concentrated on upgrading existing Telkom VPNS sites.Only received 100 orders from GPG departments for the original 200 WANlinks. Completed 59 sites of the original 100 sites.Delay in Telkom providing work orders.Lack of Telkom infrastructure at identified sites.<strong>Gauteng</strong> Department of Finance119
SECTION 3: REPORT ON THE PERFORMANCE OF PROGRAMMES8.8 Sub-programme: e – GovernmentMeasurable ObjectivesThe programme’s measurable objectives are:• To deploy various ICT tools within the GPG,including Human Capital Management (HCM)module, budget statement and adjustmentmodule, Supplier Relationship Managementsystem, and Asset Management module;• To provide Access Points to schools and other siteswithin the GPG in order to bridge the digital divideand promote social inclusion;• To develop an Integrated Business Plan for G-Linkso as to provide no-cost or affordable access tobroadband;• To provide a secure ICT platform to facilitatetransactions;• To redevelop the portal infrastructure, the lookand feel and content.Key Strategic ObjectivesAccordingly, the business unit’s objectives include:• Extend the deployment of the ERP functionalitythat is essential to efficient improvement of theGPG processes.• e-Government will enable the <strong>Gauteng</strong> <strong>Provincial</strong>Government to be open for business from anyplace and at any time, with one point of entry forall its citizens.• Provide a secure ICT environment for the Province.• To provide an available ICT infrastructure thatmeets GPG business needs.• To provide the GPG with ICT architecture planningand advisory services for the optimisation oftechnology utilisation.• To provide transversal application support andavailability across GPG Departments driven byspecific business needs.• To monitor and report on IT Services provided tothe GPG Departments.7.10 Sub-Programme: e-GovernmentThe sub-unit’s business objectives include:• Strategic coordination of the GPG e-GovernmentBlueprint.• Execute e-Government initiatives.• Deliver GPG Information Society and Developmentplan.The business unit’s e-Government services have beensuccessfully expanded, in line with the Gartner MaturityModel which is employed as an evaluation frameworkbecause it fits the context, and represents the evolutionof e-Government’s capability. The expansions include,but are not limited to, <strong>Gauteng</strong> Online Schools Project,reviewing the integrated database aimed at improvingefficiency in the delivery of services to children betweenthe ages of 0 and 14 years, Invoicing and ReceiptingEngine. In addition, the sub-unit has provided for theDesign and Validation Centre.120120<strong>Annual</strong> <strong>Report</strong> 2010 / 2011
SECTION 3: REPORT ON THE PERFORMANCE OF PROGRAMMESPerformance against output objectivesOutputs/Key Deliverables Performance Indicators <strong>Annual</strong> TargetsImplement Public Service Interface (PSI)Increase access to e-Government services(through e-Government access points, Digitallounges, Thusong Service Centres, libraries,clinics, social offices).Increase access to e-Government services(through <strong>Gauteng</strong> Online Schools Project).Facilitate G-Link Integrated Business Plan(IBP) approval.Provide no-cost or affordable access tobroadband.Provide services/ applications of high utilityto G2C, G2B, G2G and G2E segments.Conduct DAV centre training.PSI integration into GPG EAand portal65 Operational sitesdeployed.Integrate Portal with GPG EAback-end systems using the PSIActual Performance againstOutput targetPSI integration into GPG EA andportal not achieved65 Operational sites 0 sites deployed300 iLabs to beconstructed.300 iLabs to be constructed. 0 iLabs have been constructed.229 schools to berefreshed.229 schools to be refreshed. 100 schools have been refreshed.529 alarms to be installed. 529 alarms to be installed. 75 alarms installed.3 mobile iLabs delivered. 3 mobile iLabs delivered. 0 mobile iLabs delivered.Maintenance and support of1513 school labs.Approved IBPby <strong>Provincial</strong> EXCO.Percentage of households.Number of services/Applications.Number of trained technicalresources.Maintenance and support of1513 school labs.Approved IBPby <strong>Provincial</strong> EXCO.25% of <strong>Gauteng</strong>Households.30 services/Applications.1574 schools have beenmaintained and supported.IBP approved by provincial EXCO.Not achieved.0 services/Applications.3 Trained technical resources. Technical resources not trained.Establish Special Purpose Vehicle (SPV). Establishment of the SPV. Operational SPV. SPV not established.Reasons fordeviationBudgetaryconstraintsBudgetaryconstraints<strong>Gauteng</strong> Department of Finance121
SECTION 3: REPORT ON THE PERFORMANCE OF PROGRAMMES8.9 Sub-programme: Change ManagementStrategic Objectives:• Ensure stability and minimise disruptions within the ICT environment.Measurable objectives:• Manage Changes with minimum Impact to the live production environment.Performance against Output targetsOutputs/ key deliverablesPerformance Indicators<strong>Annual</strong> TargetActual Performance against OutputtargetReason for deviationChange Control.Limited impact to end users.95%successfulchangesimplemented.90% successful changesImplemented.No feedback from Changerequester.Lack of ResourcesNo proper planning from Changerequester.Number of unauthorisedchanges.0 0122122<strong>Annual</strong> <strong>Report</strong> 2010 / 2011
SECTION 3: REPORT ON THE PERFORMANCE OF PROGRAMMESKEY ACHIEVEMENTSKey results achieved during the 2010-2011 yearincluded:Information Communication Technology ProjectOffice (ICTPO)• The “Going Green” project has achieved goodresults over the financial period. A reduction of64% in paper usage has been achieved whencomparing similar periods in different financialcycles. A cost saving of R 228,000 on paper costshas been realised through the “Going Green”initiative. The department has also reduced thenumber of printers by 85. This will further dropoperational costs and contribute towards reducingcarbon emissions.Enterprise Resource Programme (ERP)• Activate the IRP5 functionality on ESS Portal – thisfunctionality is accessible and automated on ESSfor each employee to access and view their IRP5sonline.• Automated e-mail to <strong>GDF</strong> personnel on birthdays –this is automatic generation of a birthday messageto all personnel on their specific birthdays.• Delivered the SAP Finance Payments Validationfunctionality on SAP – This functionality is usedby procure to pay and finance teams to validateall allocations according to the national treasurystandards.• Automated Employee Exits functionality in ESSportal – Employees within <strong>GDF</strong> now have accessto render their terminations online.• Activate the External facing portal for ESSaccessibility over internet - Activation of ESSaccessibility from external sites, also from theinternet.• Activate the SSC Division in <strong>GDF</strong> on SAP AssetManagement – The SSC Division asset registerand data is loaded and maintained on the SAPR/3 system. Active transactions and reports areaccessible from SAP.• TAS went live with CRM as a call logging tool – Allqueries related to TAS activities can now be loggedand tracked on CRM SAP System.• Delivered the e-Journal functionality for SAPFinance – This is automation of journals from SAPsystem to BAS System to upload all journals andcorrections.• Department of Sports Arts and Culture andDepartment of Local Government and Housing(housing Branch) went live with Asset Managementon 25 March 2011 - The asset register andasset data is loaded and maintained on theSAP R/3 system for the two departments. Activetransactions and reports are accessible from SAP.• Premier Hotline went live in 24 March 2011 in CRMSystem - Municipalities and GPG departmentsare using The CRM System to track and finalise<strong>Gauteng</strong> queries.Service Management• All SLAs between <strong>GDF</strong> and the Line Departmentswere signed.Information Security• Security operation centre has gone live and weare able to extract technical and managementreports. We managed to exceed the userawarenesstarget despite the logistical challengeswe encountered at various GPG departments. Wehave helped various departments in conductingrisk assessments.Application Management• Deployment of <strong>Gauteng</strong> Online Website ande-Rrecruitment Application.E-Government• GLink - The approval of the Integrated BusinessPlan (IBP), by the <strong>Provincial</strong> EXCO. This milestonewill ascertain the implementation of the GLink<strong>Gauteng</strong> Department of Finance123
SECTION 3: REPORT ON THE PERFORMANCE OF PROGRAMMESprogramme, which will provide a no-cost oraffordable access to broadband to the citizens of<strong>Gauteng</strong>.• Design And Validation (DAV) Centre - Thedeployment of the DAV Centre has been completed.The DAV Centre is a micro-cosmos of the G-Linkprogram and includes among other thing thefollowing building blocks: different communicationelements and different parts of the value chain(Core, Aggregation and Access) that incorporateall technologies; management tools i.e. softwareprograms used to monitor, manage and controlthe network; End users devices i.e. all device typesthat the network users will use to communicateover the network including legacy telephonehandsets, mobile phones, voice over IP phones,video phones, desktop computers, laptops, PDAetc; Network services i.e. all the services that thenetwork will provision including voice, data, videoand multimedia services; Interfaces toward existingnetworks i.e. hardware and software programs thatwill be used to interconnect with existing networkslike Telkom, Neotel, MTN, Vodacom, Cell C etc;Interfaces toward existing services (ISP, GPG, etc);as well as the; training and demonstration zonei.e. facility to train various network users includingengineers, technicians, operators, managers.• Monitoring and Evaluation (M&E) Framework - Atwo volume report was completed and approvedby the MEC. The report incorporates an overview ofinformation society and e-government emergence(Volume 1), as well as a monitoring and evaluationframework (Volume 2) which can be utilised andexpanded on over time. The data contained in thereport and the policy issues raised are of publicvalue, in that the information may be relevant tolarge and small businesses, to the general public, toresearchers and NGOs. It is therefore presented asa contribution to ongoing observation of <strong>Gauteng</strong>’ssocio-economic development.REASONS FOR MAJOR VARIANCESInformation Communication Technology Project Office(ICTPO)• Time delays within projects were as a result of thefollowing factors. The prerequisites for a number ofprojects to start are now being done by the projectteam causing tasks to be extended. Many of thetasks within projects that were earmarked to becompleted by automotive processes now requiremanual interventions. The manual interventionsrequired additional time to complete which putspressure on deadlines.Enterprise Resource Programme (ERP)• Human Capital Management - Project was delayeddue to the decentralisation of leave functions tothe Departments of Education and Department ofHealth and Social Development• Budget statement - Project was delayed due tobudget constraints.• Performance Management - Reprioritisation ofprojects has been finalised and this project will notbe implemented in this financial year.• CRM module - Reprioritisation of projects has beenfinalised and this project will not be implementedin this financial year.• Asset management - Most of the departments areusing the system. Migration of other departmentsis ongoing.• Governance and Risk Control - Reprioritisation ofprojects has been finalised and this project will notbe implemented in this financial year.Service Management• TSS Service Management is still facing reportingchallenges. The department wants reports toreflect user experience (Service Performance).Currently we only report on Service Availability.Information Security• Staff attrition through resignation and transfers.Application Management• Budget constraints.124124<strong>Annual</strong> <strong>Report</strong> 2010 / 2011
SECTION 3: REPORT ON THE PERFORMANCE OF PROGRAMMES• Lack of Proper tools of trade to perform dutiesadequately (Cell-phones, Data-Cards etc).• Non–Renewal of Software Licences has led tomajor technical challenges.• Hardware out of warranty and require upgrades.• Incorrect allocation of incidents by the servicedesk leading to the unit receiving calls that arealready out of SLA.Operations Management• Appointment of staff into vacant positions.• Core Network and Data Centre hardware beingend of life and out of warranty.• SAN storage infrastructure has storage limitationsand is out of warranty, placing mission criticalapplications and systems at risk.• Refresh Backup Infrastructure in order to completebackups within scheduled backup window.E-Government• Implement Public Service Interface (PSI) – Therewere significant constraints on the departmentalbudget, therefore the BU could not acquire the PSIresources.• Increase access to e-Government services(through e-Government access points, Digitallounges, Thusong Service Centres, libraries,clinics, social offices) - The Thusong ServiceCentres in <strong>Gauteng</strong> will be used as G-Link pilotsites. The G-Link tendering process has beendelayed and is envisaged to commence and befinalised during the first quarter of 2011/2012.• Increase access to e-Government services(through <strong>Gauteng</strong> Online Schools Project) -There were significant constraints on thedepartmental budget and hence the rollout couldnot ensue.• Provide no-cost or affordable access to broadband~ The G-Link tendering process has beendelayed and is envisaged to commenceand be finalised during the first quarter of2011/2012.• Provide services/ applications of high utility toG2C, G2B, G2G and G2E segments – Due tofinancial constraints, there were changes onthe GPG Portal platform to align to internalcapabilities.• Conduct DAV centre training – The <strong>GDF</strong> newstructure which includes the DAV technicalresources has been approved by the MEC and isawaiting final approval by the DPSA.• Establish Special Purpose Vehicle (SPV) - TheG-Link tendering process has been delayed and isenvisaged to commence and be finalised duringthe first quarter of 2011/2012.OUTLOOK FOR THE YEAR AHEAD(2011/2012)Information Communication Technology ProjectOffice (ICTPO)The primary focus of the year ahead will be to reducetime delays experienced in project execution. A numberof initiatives will be introduced to achieve this. Theseinclude;• The skills transfer phases of projects to becomedeliverables.• More tasks within projects to be completed byinternal resources.• The project governance structures are to bereviewed to ensure quick and speedy resolutionsto challenges.• The escalation process will be enhanced to ensurethat issues are dealt with timely.Enterprise Resource Programme (ERP)• The Assets Accounting functionality will be rolledout to at least 2 other GPG departments.• The deployment of CRM, Performance System andGovernance Compliance modules will commenceonce the budget is made available.<strong>Gauteng</strong> Department of Finance125
SECTION 3: REPORT ON THE PERFORMANCE OF PROGRAMMESApplication Management• Development of new systems and websites.E-Government• Ensuring the ease of service delivery andproviding a choice of interaction methods onbehalf of the people of <strong>Gauteng</strong> remains apriority. It is foreseen that significant progress willbe made in such areas as process automationand transactional citizen-centric applications.Areas of focus will include the implementationof automation products within the departmentsof the <strong>Gauteng</strong> <strong>Provincial</strong> Government.The following projects will continue into the newfinancial year notwithstanding the financial challengesexperienced by <strong>GDF</strong> TSS:• Bana-Pele - The programme aims to ensure thatorphaned and vulnerable children between theages 0-14 receive a comprehensive packageof services from the <strong>Gauteng</strong> provincialdepartments through a mechanism known asa single window. Central to the single windowpackage there is an identification, trackingand referral system which aims at assistingthe service providers to identify the needs ofchildren, provide a single point of contact withreferrals between the service providers, trackservices provided to children can eliminateduplication of processes.• <strong>Gauteng</strong> Online (schools) - The key objectivesof the programme are to create a sustainableschool based e-learning environment wherelearners maximize their educational experienceas follows: to provide every learner in publicschools with an e-mail address and free internetaccess; and to implement a technology enabledlearning environment.• Enterprise Wide Licensing (EWL) – EWL seeksto manage access to applications; expandinternally connected systems; convergephysical and logical security; and integrationinto National Identity Systems• Online Strategy - The project entails the useof SCIENTRIX approach is based on theMatrix, a simple idea with great impact, whichprovides: (1) order and clarity, (2) coordinationand alignment, (3) logic and sustainability; and(4) creativity and innovation.• Monitoring and Evaluation - The project isexpected to develop a measurement frameworkthat will be used to continuously monitor andevaluate the implementation of the GPGE-Government Programme• Official Launch of the Design and ValidationCentre• G-Link – the implementation of the programmewill enable the GPG to provide affordableaccess to broadband to 95% of the populationof <strong>Gauteng</strong>.• Portal- Portal Content Development - The GPGWebsite is a communication tool and amechanism for improved service delivery.The website is built around five main targetaudiences: The public (Government toCitizen), GPG staff (Government to Employee– Intranet), Government (Government toGovernment), Business (Government toBusiness), and Tourism (Government toTourists)- Portal Access Points - The primary objectiveof the project is to create access points forthe public in Government Departments, byproviding them with the relevant equipmentto make access possible to all governmentservices and information at the click of abutton.126126<strong>Annual</strong> <strong>Report</strong> 2010 / 2011
SECTION 3: REPORT ON THE PERFORMANCE OF PROGRAMMES9. Programme: <strong>Gauteng</strong> FundPurposeIs to institutionalise alternative funding modelfor <strong>Gauteng</strong> <strong>Provincial</strong> Government including thedevelopment of strategies to attract of private sectorfunding into infrastructure project of government.Strategic Objectives• To be a centre of excellence in the public sector instrategic infrastructure financing solutions.• To ensure sound corporate governance in the GFAand to provide effective and efficient resourcemanagement services.• To secure alternative finance sources, includingthe creation of new revenue streams, therebyensuring cost efficiencies and consolidatingresources for economies of scale.• To be a preferred employer, attracting and retaininghighly skilled and performing individuals.Performance against Output targetsOutputs Performance Indicators Reasons for deviationEstablished GFA organisationalframework and implementation.GFA capacity rate in all keyfunctional areas.75% capacity.50% capacity in allfunctional areas of GFA.The process of establishment of GFA wasnot completed. As a result the process offilling vacant posts of the new structurewas not implemented.Comprehensive Project Financeand Research Agenda.Effective and reliable ProjectFinance and Research Agenda.Comprehensive ProjectFinance and ResearchAgenda.Output not achieved.The process of establishment of GFAwas not completed and that impacted onthe delivery of this output. As a result,the research function of GFA was notestablished.Documented business processes,procedures and systems.Number of businessprocesses, procedures andsystems developed, approved,reviewed and improved.Documented businessprocesses, proceduresand systems approved.All business processes,procedures and systemsrelating to HR, Finance,Procurement, Legal, ITC,Corporate Services andProject finance weredeveloped.The business processes, procedureand systems were not approved. Thisdepended on the completion of theestablishment of GFA and appointment ofthe Board that will approve all policies andbusiness processes of GFA.<strong>Gauteng</strong> Department of Finance127
SECTION 3: REPORT ON THE PERFORMANCE OF PROGRAMMESOutputs Performance Indicators Reasons for deviationAll SLA’s signed, monitored andimplemented.Number of SLAs implementedand monitored.5 SLAs signed andmonitored All signedSLAs implemented andmonitored.5 SLAs were signed,implemented andmonitored.All qualitative and accuratereports submitted timeouslymonthly, quarterly and annually.Number of qualitative,accurate and timeouslysubmitted accountabilityreports.All monthly, quarterly andannual reports timeouslysubmitted.Monthly and quarterlyreports are submittedtimeously, namely,quarterly reports, projectstatus reports and IYM.Comprehensive Risk managementand internal audit strategydeveloped.Reliable and dependable RiskManagement and InternalAudit Strategy and Plan.Comprehensive RiskManagement and InternalAudit Strategy and Plan.Top 13 Risks wereidentified and Action Plandeveloped.Operational FraudRisks for 2010/11 wasdeveloped.Risk Management and InternalAudit Strategy and Plan was not donebecause GFA took part in the <strong>GDF</strong> RiskManagement Committee and participatedin all processes of <strong>GDF</strong> Risk Assessment.Therefore, <strong>GDF</strong> Internal Risk ManagementMonitoring Plan 2010/11 includes GFA’srisk matters.Comprehensive Strategic Planningand Performance InformationFramework.Credible and reliable StrategicPlanning and PerformanceInformation Framework.Comprehensive StrategicPlanning andPerformanceInformation Frameworkdeveloped and approved.Strategic Planning andPerformanceInformation Frameworkwas developed andapproved.128128<strong>Annual</strong> <strong>Report</strong> 2010 / 2011
SECTION 3: REPORT ON THE PERFORMANCE OF PROGRAMMESOutputs Performance Indicators Reasons for deviationComprehensive Service DeliveryModel.Approved and implementableService Delivery Model.Comprehensive ServiceDelivery Model Developedand implemented.Service Delivery Modeldeveloped.Comprehensive Communicationand Marketing Strategy.Approved and implementableMarketing andCommunications Strategy.Comprehensive Marketingand CommunicationStrategy.The CommunicationsPolicy was developedfirst then followed bythe Marketing andCommunications Strategy.At least 5 infrastructure projectssourced from stakeholders.Number of project sourcedfrom primary stakeholders.At least 5 projectsourced from primarystakeholders.8 projects sourced fromprimary stakeholders.At least 5 projects funded perannum.Number of projects funded perannum.At least 5 infrastructureprojects funded.3 projects developed to abankable stage.Various factors per project impacted onprojects development phase.Comprehensive Monitoring andEvaluation Framework.Credible and reliable M&EFramework and Plan.Comprehensive M&EFramework developed.Planned output notachieved.The establishment of GFA was notcompleted and that impacted on thedelivery of this output. As a result, the M &E function of GFA was not established.3 year Training and DevelopmentStrategy developed andimplemented.Approved Training andDevelopment Strategy.Training and DevelopmentStrategy.Training andDevelopment Strategydeveloped.Comprehensive RecruitmentIncentive and Retention Strategy.Effective and sustainableRecruitment, Incentive andRetention Strategy.ComprehensiveRecruitment,Incentive and RetentionStrategy.Recruitment, Incentiveand RetentionStrategy developed.Comprehensive PerformanceManagement Strategy.Approved and implementedPerformance ManagementStrategy.Performancemanagement StrategyReviewed.PerformanceManagement Strategydeveloped.<strong>Gauteng</strong> Department of Finance129
SECTION 3: REPORT ON THE PERFORMANCE OF PROGRAMMESKEY ACHIEVEMENTSThe following are the Major Achievements of GFAduring the 2010/11 financial year:Securing alternative fundingIn 2010/11 GFA sourced out projects from sectordepartments to raise alternative funding. A pipeline of8 infrastructure projects was created and was approvedby EXCO with the mandate to GFA to raise alternativefunding. The projects are:• Upgrading and refurbishment of 6 hospitals in theprovince.ProjectUpgrading and refurbishment of 6 hospitals in the provinceThe Hospital Information System (HIS).Kopanong Precinct Project.Construction and refurbishment of 132 schools in the province.Construction, rehabilitation and maintenance of identified roads in theprovince.Lufhereng Mixed Housing Development Project.Sedibeng Regional Sewer Project.<strong>Gauteng</strong> Land Fund.• The Hospital Information System (HIS).• Construction and refurbishment of 132 schools inthe province.• Lufhereng Mixed Housing Development Projec.t• Kopanong Precinct Project.• Construction, rehabilitation and maintenance ofidentified roads in the province.• Sedibeng Regional Sewer Project.• <strong>Gauteng</strong> Land Fund.The GFA developed a project support function fordevelopment and preparation of the above listedprojects. The operational guidelines and procedureswere developed within investment policies of GFA.These included techniques and criteria for feasibilityassessments, credit review, project appraisal andfinancial modelling/ structuring and interaction withfunding sources. All projects were taken through theproject development and preparation phase, workingwith respective sector departments who are the projectowners. GFA Project Finance Steering Committee wasestablished to monitor the preparation of these projectson a monthly basis. By the end of the financial year thedevelopment and preparation of projects was at differentstages and below is the summary status of each project:Project Progress StatusProject development phase completed.Funding structure proposals completed.Awaiting transaction closure and implementation. To be completed in 2011/12.Project development phase completed.Funding structure proposals completed.Awaiting transaction closure and implementation. To be completed in 2011/12.Project development phase completed.Funding structure proposals completed.Awaiting transaction closure and implementation. To be completed in 2011/12.Project develop phase in progressFunding structure, transaction closure and implementation to be completed in 2011/12.Project develop phase in progress.Funding structure, transaction closure and implementation to be completed in 2011/12.Project suspended.Project develop phase in progress.Funding structure, transaction closure and implementation to be completed in 2011/12.Project develop phase in progress.Implementation to be completed in 2011/12.130130<strong>Annual</strong> <strong>Report</strong> 2010 / 2011
SECTION 3: REPORT ON THE PERFORMANCE OF PROGRAMMESImplementation of the Business CaseOne of the major categories of work that must beperformed to achieve our strategy as outlined in thebusiness case, is setting up the investment facilitiesof GFA, namely, the Project Preparation Facility,Discretionary Facility and Leveraged Facility. The majorachievement in this regard was the development andcompletion of policies related to these services. Thepolicies provided the mandate, investment guidelinesand operational procedures for each facility.Establishment of Strategic PartnershipsThe GFA successfully established a partnership withthe Development Bank of Southern Africa. A MandateAgreement was concluded with DBSA in which theDBSA is mandated as the Lead Arranger, Financier andUnderwriter. GFA is working with DBSA on the followingprojects, and a level of success has been achieved sofar as indicated in the Table on 4.1; Upgrading andrefurbishment of hospitals, HIS, construction of schoolsand construction of roads.Restructuring and Organisational DevelopmentIn carrying out the EXCO mandate of 2009 that the<strong>Gauteng</strong> Fund Project Office and <strong>Gauteng</strong> PartnershipFund should merge to establish the GFA, a restructuringprocess was carried out to develop one organisationthat would implement the strategies outlined in theapproved business case. The following was achieved in2010/11 financial year:• A restructuring process was undertaken and anew organisational structure was developed andapproved.• Matching and placing framework was developedto place the current staff into the new structure.• Organisational policies that outline processes,systems and procedures for HR, Finance, ICT andCorporate Services were developed.• Communications policy and Communications andMarketing Strategy were developed.• HR policies for training and development,recruitment and retention and performancemanagement were developed.Risk ManagementGFA took part in the risk management processesof the Department of Finance and was part of thedepartment’s Risk Management Committee. GFAidentified the risks associated with the organisationfor 2010/11 and developed mitigation plans. Top 13Risks were identified which led to the creation of anAction Plan and Operational Fraud Risks for 2010/11.These included the Department’s Risk ManagementMonitoring Plan of 2010/11.Compliance with Regulatory <strong>Report</strong>ing RequirementsGFA developed the Strategic Planning and PerformanceInformation Management Framework that outlines theorganisation’s strategic planning process and howperformance planning, monitoring, measurementand reporting is conducted. The framework alsoassisted with performance evidence gathering andmanagement.OUTLOOK FOR THE YEAR AHEAD(2011/2012)The GFA will focus on the achievement of the followingkey objectives in 2011/12:To be a centre of excellence in the public sector instrategic infrastructure financing solutionsTo achieve this objective GFA will build the capacity inall its key areas of operations. This includes creating aresearch capability that will provide best practices andinnovative solutions and knowledge management inproject finance. The key outputs would be:• Development of the research agenda.• Establishment of research and knowledgemanagement function.To ensure sound corporate governance in the GFA andto provide effective and efficient resource managementservices GFA plans to put in place all the necessaryrequirements to ensure that good governance ispracticed and its resources are managed in line with<strong>Gauteng</strong> Department of Finance131
SECTION 3: REPORT ON THE PERFORMANCE OF PROGRAMMESthe prescripts of PFMA. This will ensure that there isprudent and effective use of public resources and GFAoperates in an open and transparent manner. The keyoutputs would be:• Develop an action plan to improve financialmanagement to ensure that GFA achieves anunqualified audit report.• Implement sound budget and expendituremanagement including providing qualitative andaccurate reporting systems.• Develop the Risk Management and InternalAudit Strategy and Plan including the BusinessContinuity Plan for GFA.• Review and implement the Strategic Planningand Performance Information ManagementFramework.To secure alternative finance sources, including thecreation of new revenue streams, thereby ensuringcost efficiencies and consolidating resources foreconomies of scaleGFA will put in place the processes and procedures todevelop infrastructure projects into bankable projectsthat would attract private investment and providealternative sources of funding. To achieve this thefollowing key puts will be delivered:• Finalise project preparation and developmentof the 2010/11 project pipeline and concludefinancial transactions.• Source out new projects from primary clients (GPGdepartments, municipalities and public entities)and conduct project preparation and developmenton new projects.• Mobilise alternative funding sources througheffective marketing and communications.To be a preferred employer, attracting and retaininghighly skilled and performing individuals.GFA aims to attract the best possible technical skill inproject finance, project management, research andknowledge management, etc so that it could become thecentre of excellence in infrastructure finance solutions.This includes development of current personnel andmanaging staff performance in an effective way thatwould ensure improvement in output. The key outputsto achieve this objective are:• Implementation of recruitment and retentionstrategy.• Implementation of training and development strategy.• Implementation of effective performancemanagement policies and systems.• Create a conducive working environment.132132<strong>Annual</strong> <strong>Report</strong> 2010 / 2011
SECTION 4:ANNUAL FINANCIAL STATEMENTSFor the year ended 31 March 2011
SECTION 4: ANNUAL <strong>Report</strong> of FINANCIAL the Auditor-GeneralSTATEMENTSREPORT OF THE AUDITOR-GENERAL TO THE GAUTENGPROVINCIAL LEGISLATUREON VOTE NO. 11: GAUTENGDEPARTMENT OF FINANCEREPORT ON THE FINANCIALSTATEMENTSIntroduction1. I have audited the accompanying financialstatements of the <strong>Gauteng</strong> Department of Finance,which comprise the appropriation statement, thestatement of financial position as at 31 March2011, the statement of financial performance andcash flow statement for the year then ended anda summary of significant accounting policies andother explanatory information, as set out on pages145 to 204.Accounting officer’s responsibility forthe financial statements2. The accounting officer is responsible for thepreparation of these financial statements inaccordance with the Departmental Financial<strong>Report</strong>ing Framework prescribed by National<strong>Treasury</strong> and the requirements of the Public FinanceManagement Act, 1999 (Act No.1 of 1999) (PFMA),and for such internal control as managementdetermines necessary to enable the preparationof financial statements that are free from materialmisstatement, whether due to fraud or error.Auditor-General’s responsibility3. As required by section 188 of the Constitution ofthe Republic of South Africa, 1996 and section 4of the Public Audit Act, 2004 (Act No. 25 of 2004)(PAA), my responsibility is to express an opinion onthese financial statements based on my audit.4. I conducted my audit in accordance withInternational Standards on Auditing and GeneralNotice 1111 of 2010 issued in GovernmentGazette 33872 of 15 December 2010. Thosestandards require that I comply with ethicalrequirements and plan and perform the auditto obtain reasonable assurance about whetherthe financial statements are free from materialmisstatement.5. An audit involves performing procedures to obtainaudit evidence about the amounts and disclosuresin the financial statements. The proceduresselected depend on the auditor’s judgement,including the assessment of the risks of materialmisstatement of the financial statements,whether due to fraud or error. In making those riskassessments, the auditor considers internal controlrelevant to the entity’s preparation of the financialstatements in order to design audit proceduresthat are appropriate in the circumstances, but notfor the purpose of expressing an opinion on theeffectiveness of the entity’s internal control. Anaudit also includes evaluating the appropriatenessof accounting policies used and the reasonablenessof accounting estimates made by management, aswell as evaluating the overall presentation of thefinancial statements.6. I believe that the audit evidence I have obtained issufficient and appropriate to provide a basis for myaudit opinion.Opinion7. In my opinion, the financial statements presentfairly, in all material respects, the financial positionof the <strong>Gauteng</strong> Department of Finance as at 31March 2011, and its financial performance andcash flows for the year then ended in accordancewith the Departmental Financial <strong>Report</strong>ingFramework prescribed by National <strong>Treasury</strong>.Emphasis of matters8. I draw attention to the matters below. My opinionis not modified in respect of these matters:Material losses9. As disclosed in note 5 to the financialstatements, material write-offs mainly relating to<strong>Gauteng</strong> Department of Finance135
SECTION 4: ANNUAL <strong>Report</strong> of FINANCIAL the Auditor-GeneralSTATEMENTSinterdepartmental claims of R31 943 000, werewritten off by the department during the year.Restatement of corresponding figures10. As disclosed in note 24 to the financial statements,the corresponding figures for 31 March 2010, havebeen restated as a result of an error discoveredduring 2011 in the financial statements of the<strong>Gauteng</strong> Department of Finance at, and for theyear ended 31 March 2010. Misstatements in thecorresponding figures (2009-10) were identifiedduring the audit of the financial statements ofthe current year relating to irregular expenditurewhich amounted to R76 467 371. Managementcorrected the misstatement by restating thecorresponding figure for irregular expenditure.Accruals11. Accruals reflected in note 20 which exceeded thepayment term of 30 days as required by <strong>Treasury</strong>Regulation 8.2.3 amounted to R80 644 000. Thisamount, in turn, exceeded the voted funds to besurrendered of R30 586 000 as per the statementof financial performance by R50 058 000. Theamount of R50 058 000 would therefore haveconstituted unauthorised expenditure had theamounts due been paid in time.Additional matter12. I draw attention to the matter below. My opinion isnot modified in respect of this matter:Financial reporting framework13. The financial reporting framework prescribedby the National <strong>Treasury</strong> and applied by the<strong>Gauteng</strong> Department of Finance is a complianceframework. Thus my opinion would have reflectedthat the financial statements had been properlyprepared instead of fairly presented as required bysection 20(2)(a) of the PAA, which requires me toexpress an opinion on the fair presentation of thefinancial statements of the <strong>Gauteng</strong> Departmentof Finance.REPORT ON OTHER LEGAL ANDREGULATORY REQUIREMENTS14. In accordance with the PAA and in terms of GeneralNotice 1111 of 2010, issued in GovernmentGazette 33872 of 15 December 2010, I includebelow my findings on the annual performancereport as set out on pages 19 to 114 and materialnon-compliance with laws and regulationsapplicable to the department.Predetermined objectives15. There are no material findings on the annualperformance report.Compliance with laws andregulations<strong>Annual</strong> financial statements16. The financial statements submitted for auditdid not comply with section 40(1) of the PFMA.Material misstatements were identified during theaudit, and were corrected by management.Expenditure management17. As disclosed in note 25 of the financial statements,the department incurred fruitless and wastefulexpenditure contrary to the requirements ofsection 38(1)(c)(ii) of the PFMA and <strong>Treasury</strong>Regulation 9.1.1 amounting to R121 434 261 dueto interest and contract settlement costs.18. As disclosed in note 8 of the financial statements,the department incurred unauthorised expenditurecontrary to section 39(2)(a) of the PFMA amountingto R3 124 000 as a result of overspending oncurrent payments (goods and services) for theTechnical Support Services programme.136136<strong>Annual</strong> <strong>Report</strong> 2010 / 2011
SECTION 4: ANNUAL <strong>Report</strong> of FINANCIAL the Auditor-GeneralSTATEMENTS19. All payments due to creditors were not settledwithin 30 days from receipt of an invoice, as perthe requirements of section 38(1)(f) of the PFMAand <strong>Treasury</strong> Regulation 8.2.3.20. As disclosed in note 24 of the financial statements,the department incurred irregular expenditurecontrary to the requirements of section 38(1)(c)(ii)of the PFMA amounting to R2 104 307, as propersupply chain management processes were notfollowed.Procurement and contract management21. <strong>Treasury</strong> Regulations 16A9.1 provides that theaccounting officer must reject any bid from asupplier who fails to provide written proof from theSouth African Revenue Service that the suppliereither has no outstanding tax obligations or hasmade arrangements to meet outstanding taxobligations. For certain suppliers, the departmentdid not have tax clearance certificates.INTERNAL CONTROL22. In accordance with the PAA and in terms of GeneralNotice 1111 of 2010, issued in Government Gazette33872 of 15 December 2010, I considered internalcontrol relevant to my audit, but not for the purposeof expressing an opinion on the effectiveness ofinternal control. The matters reported below arelimited to the significant deficiencies that resultedin the findings on compliance with laws andregulations included in this report.Leadership23. Management did not exercise adequate oversightresponsibility regarding financial reporting andcompliance with laws and regulations and relatedinternal controls which resulted in instances of noncompliancewith PFMA and <strong>Treasury</strong> Regulations.Financial and performancemanagement24. Management did not prepare accurate andcomplete financial statements that are supportedand evidenced by reliable information. Thefinancial statements were subject to materialamendments resulting from the audit.OTHER REPORTSInvestigations25. An investigation into alleged duplicate paymentshas been undertaken by the department and isongoing.26. The department is also in the process ofundertaking disciplinary actions and carrying outthe recommendations of the outcomes from theforensic business unit investigations.Performance audits27. A performance audit was conducted during theyear under review on the department’s use ofconsultants. The management report was issuedin March 2011 to the <strong>Gauteng</strong> Department ofFinance.28. A performance audit is being conducted onthe Readiness of Government to report on itsperformance. The focus of the audit is on howgovernment institutions are guided and assisted toreport on their performance, as well as the systemsand processes that they have put in place. Thefindings will be reported on in a separate report.Johannesburg30 July 2011<strong>Gauteng</strong> Department of Finance137
SECTION 4: AUDIT ANNUAL COMMITTEE FINANCIAL REPORT STATEMENTSWe are pleased to present our report for the financialyear ended 31 March 2011Audit Committee and Attendance:Non-Executive Members:The Audit Committee consists of the external memberslisted hereunder and is required to meet a minimumof at least three times per annum as per provisionsof the Public Finance Management Act (PFMA). Interms of the approved Terms of Reference (GPG AuditCommittee Charter), five meetings were held during thecurrent year, i.e.3 meetings for Quarterly Performance<strong>Report</strong>ing (financial and non-financial) and twomeetings to review and discuss the <strong>Annual</strong> FinancialStatements and the Auditor General <strong>Report</strong>.Name of MemberNumber of MeetingsAttendedPiet Fourie (Chairperson) 05Leonard Radzuma (Member) 05Avie Naidoo (Member) 05Executive Members:In terms of the GPG Audit Committee Charter, theOfficials listed hereunder are obliged to attend themeetings of the Audit Committee:Compulsor y Attendees Number of MeetingsAttendedStewart Lumka(Head of Department) 05Clifford Appel(Chief Financial Officer) 05Zipphorah Mamabolo(Chief Risk Officer) 03The Audit Committee noted that the Head of Departmentdid attend all meetings. Therefore, the Audit Committeeis satisfied that the Department adhered to theprovisions of the GPG Audit Committee Charter.Audit Committee ResponsibilityThe Audit Committee reports that it has complied withits responsibilities arising from section 38 (1) (a) ofthe PFMA and <strong>Treasury</strong> Regulation 3.1.13. The AuditCommittee also reports that it has adopted appropriateformal terms of reference as its Audit CommitteeCharter, has regulated its affairs in compliance withthis Charter and has discharged all its responsibilitiesas contained therein.The effectiveness of internal controlIn line with the PFMA, Internal Audit provides the AuditCommittee and Management with assurance that theinternal controls are appropriate and effective. This isachieved by the evaluation of the risk managementprocess, as well as the identification of correctiveactions and suggested enhancements to the controlsand processes. From the various reports of the InternalAuditors, the Audit <strong>Report</strong> on the <strong>Annual</strong> FinancialStatements and the Management <strong>Report</strong> of theAuditor-General, it was noted that no matters werereported indicating any material deficiencies in thesystem of internal control or any deviations there from.Accordingly, we can report that the system of internalcontrol for the period under review was efficient andeffective.The quality of in year management and quarterlyreports.The Audit Committee is satisfied with the content andquality of monthly and quarterly reports prepared andissued by the Accounting Officer of the Departmentduring the year under review.138138<strong>Annual</strong> <strong>Report</strong> 2010 / 2011
SECTION 4: ANNUAL AUDIT COMMITTEE FINANCIAL REPORT STATEMENTSEvaluation of Financial StatementsThe Audit Committee has:• reviewed and discussed the unaudited <strong>Annual</strong>Financial Statements to be included in the<strong>Annual</strong> <strong>Report</strong>, with the Auditor-General and theAccounting Officer;• reviewed the Auditor-General’s managementreport and management’s response thereto;• reviewed the departments compliance with legaland regulatory provisions; and• reviewed significant adjustments resulting fromthe audit.The Audit Committee concurs and accepts theAuditor-General’s conclusions on the <strong>Annual</strong> FinancialStatements, and is of the opinion that the audited<strong>Annual</strong> Financial Statements be accepted and readtogether with the report of the Auditor-General.Internal AuditThe Audit Committee is satisfied that the internalaudit function is operating effectively and that it hasaddressed the risks pertinent to the department inits audit. One-on-one discussions with the Chief AuditExecutive did not reveal any mattes of concern.Forensic InvestigationsThe Audit Committee is satisfied that the forensicinvestigations are properly reported with age-analysis ofall reported issues indicated. One-on-one discussionswith the Head of Forensic Unit did not reveal anymatters of concern.One-on-One with the Accounting OfficerThe Audit Committee has met with the AccountingOfficer of the Department to ensure that there are nounresolved issues.Auditor-General South AfricaThe Audit Committee has met with the representativesof the Auditor-General to ensure that there are nounresolved issues. One-on-one discussions withrepresentatives of the Auditor-General did not revealany matters of concernOther Important MattersThe Audit Committee noted that the Departmentappointed an appropriate forensic service provider toinvestigate within the various Departments, the impactof possible duplicate payments in prior reportingperiods as reported by <strong>Gauteng</strong> Audit Services.The Audit Committee also noted from reports of theAccounting Officer, the various initiatives to managethe cash flow challenges resulting from unauthorisedexpenditure and accruals carried forward from priorreporting periods and from the fact that the budget forthe 2011/12 reporting period was only approve by theLegislature in July 2011.AppreciationThe Audit Committee expresses its appreciation towardsthe Accounting Officer and all other role players for theconstructive way in which meetings were arranged andconducted.…………………………………………Piet FourieChairperson of the Audit Committee<strong>Gauteng</strong> Department of Finance139
SECTION 4: ANNUAL REPORT OF FINANCIAL THE ACCOUNTING STATEMENTS OFFICER<strong>Report</strong> by the Accounting Officerto the Executive Authority andParliament/<strong>Provincial</strong> Legislatureof the Republic of South Africa.1. General review of the state offinancial affairsThe vision of the <strong>Gauteng</strong> Department of Finance(<strong>GDF</strong>) is “to be an activist, developmental andinterventionist department; providing strategic andoperational support to the Province.” As such, the <strong>GDF</strong>sought to lead by example in the midst of cash flowchallenges that were experienced by the province. Itsrobust reviews of expenditures and commitments haveborne fruit while minimising the downside effects onservice delivery. Evidently, these efforts culminated inthe stabilisation of relationships with key stakeholdersand suppliers. To this end, the departmentprioritised the timely settlement of SMME accounts,while implementing mutually beneficial paymentarrangements with established suppliers. During the2010/11 financial year, the department improvedits financial position from a negative of R115m to apositive R15m compared to the end of 2009/10.Moreover, and during the same period, the <strong>Treasury</strong>Division reported a downward revision of revenuesfrom R128m to R54m due to the depletion of provincialreserves. However, the 2010/11 financial position wasturned around to a positive R42m. This was attributedto stable revenue collection.Part of the Premier’s 2009 pronouncement was toreview the mandate of the Shared Service Centre. Asa result, the department revisited all outstanding interdepartmentalaccounts receivable to better manageits outstanding debts. We also wrote off about R30mof inter-departmental receivable. This was our gestureof providing financial assistance to seriously affectedprovincial departments, which has significantlyimproved the quality of our debtor’s book.<strong>Provincial</strong>ly, the <strong>GDF</strong> successfully secured thelegislature’s condonation of R1.4bn in unauthorisedexpenditure. This approval enabled our reduction ofour unauthorised expenditures.1.1 Major Projects UndertakenThe contact centre was in-sourced during the yearunder review. This function was identified as a coreservice delivery factor and sufficiently important tobe managed within the department. However, it cameat an early termination cost of R145m, part of whichwas settled during the financial year, at which time thetransition was successfully completed.1.2 Spending trendsThe Department spent 98% of its appropriated budgetfor the year under review. A comparative analysisthereof is contained in table 1 below which indicatesa general decrease in both budget and spending levelsfor the fiscal years 2009/10 and 2010/11 respectively.The decrease in appropriations adversely impacteddepartmental cash-flows, and thus compromisedsupplier payments.Table 1: Comparative analysis of annual budgets andexpendituresFinalAppropriationSpending forthe year2010/11R’000Under-spending R30, 586(2%)2009/10R’000% ChangeR1,515,008 R1,520,701 (0.37)R1,484,422 R1,505,711 (1.4)R14, 990(1%)The overall under spending of R30, 6m was mainlydriven by the delayed utilisation of capital budgetsamounting to R28m. This delay in the replacementof capital assets was due to the prioritisation cashavailable for the settlement of accrued expenses. Wehave since applied to roll some of these resources over,in order to fund the replacement of capital equipmentin the new financial year.140140<strong>Annual</strong> <strong>Report</strong> 2010 / 2011
SECTION 4: ANNUAL REPORT FINANCIAL OF THE ACCOUNTING STATEMENTS OFFICER1.3 <strong>Report</strong>ing matters affecting previous yeardisclosuresThe department updated its disclosures relating to2009/10 due to irregular expenditure which was notreported. This irregular expenditure was due to noncompliance with proper Supply Chain Managementprocesses amounting to R76m. The requireddisclosures have now been effected in the financialstatements.2. Services rendered by thedepartmentThe MEC of Finance is the Executive Head of the<strong>Provincial</strong> <strong>Treasury</strong>. He is primarily responsible forthe execution of the functions and powers that areprescribed in Chapter 3 of the PFMA. Similarly, the<strong>Gauteng</strong> Department of Finance provides oversightand limited back office support to provincialdepartments. Therefore, the <strong>Treasury</strong> Division providesvarious financial management functions to bothprovincial departments and delegated municipalitiesas stipulated in the Public Finance ManagementAct (PFMA) and the Municipal Finance ManagementAct (MFMA). On the other hand, the Shared ServicesDivision is a critical delivery component for the <strong>Gauteng</strong>Province, which ensures that service delivery occurs ina smart and sustainable manner. The <strong>GDF</strong> also housesthe <strong>Gauteng</strong> Audit Services, which then provide internalaudit services throughout provincial departments asrequired by <strong>Treasury</strong> Regulations.3. Capacity constraintsThe department has experienced capacity constraintswhich were occasioned by cash-flow and fundingchallenges. These challenges were largely attributed tothe Shared Services Division (SSD) paying for serviceson behalf of provincial departments. In turn, thesedepartments were supposed to reimburse the SSD, whichrarely happened. In the past, these cash- flow challengeshad resulted in under spending of current budgets, andeffectively increased levels of accruals. For instance,the opening accruals position for the 2010/11 financialyear was R257m. This effectively reduced the goods andservices budget for the year by the same amount.On the funding side, the department had a reducedbudget of R5.7m (0.37%), while utility costs forelectricity and telephony increased significantly. In orderto manage this situation, the department continuouslyreprioritised its expenses in an effort to mitigate thesechallenges. However, we are closely approaching apoint where further reprioritisation will not be possible.4. Utilisation of donor fundsThe Department did not receive any donor fundingduring the 2010/11 financial year.5. Trading entities and publicentitiesThe <strong>Gauteng</strong> Funding Agency (GFA) is mandated tosource alternative funding for strategic infrastructureprojects. The <strong>Provincial</strong> <strong>Treasury</strong> thus appropriatedR50m to the GFA for its operational expenses. TheGFA is still undergoing its establishment as a PFMAschedule 3C entity. In the meantime, it continues tooperate as the <strong>Gauteng</strong> Fund Project Office (GFPO). Assuch, the GFPO is subject to the selfsame governance,oversight, and legislative framework that is applicableto the <strong>GDF</strong>.6. Organisations to whom transferpayments have been madeTransfer payments made were mainly to the <strong>Gauteng</strong>Funding Project Office, and towards financial assistanceto delegated municipalities for financial managementpurposes.<strong>Gauteng</strong> Department of Finance141
SECTION 4: ANNUAL REPORT OF FINANCIAL THE ACCOUNTING STATEMENTS OFFICER7. Corporate governancearrangements7.1 The department has a functional and effective RiskManagement Committee which is chaired by theHOD. All executive managers are members thereofincluding the Chief Risk Officer. The departmentalrisk profile is monitored on a quarterly basis, andis reported to the Risk Management Committeeregularly. Additionally, a risk profile and analysis ofeach Chief Directorate was completed during the2009/10 financial year. Regular monitoring andimplementation of action plans is conducted tostrengthen internal controls.7.2 The department’s Fraud Prevention Plan wasrevised for the 2010/11 financial year. Therefore,departmental officials underwent fraud awarenesstraining throughout the year in order to educate,manage, identify and report incidents of fraud andcorruption.7.3 An Internal Audit Plan was developed with theassistance of the <strong>Gauteng</strong> Audit Services to ensurecompliance with the Internal Audit Charter. Theirplans were approved by the Audit Committee whichexercises oversight on the implementation thereof.7.4 The Department complied with section 38 (1)(a) (ii) of the PFMA as performance and internalcontrols were reported to and reviewed by theAudit Committee quarterly.8. Discontinued departmentactivitiesThere were no discontinued departmental activitiesduring the year under review.9. New departmental activitiesWith effect from February 2011, the departmentmanages the Premier’s Hotline (through the contactcentre).This service ensured a formal process andsystem through which <strong>Gauteng</strong> citizens could interactwith the provincial government, receive information,lodge complaints, and resolve issues relating to nondeliveryof public services.10. Asset managementA departmental asset management plan wasdeveloped and aligned to our <strong>Annual</strong> PerformancePlan for sound asset management practice. Storesof inventory were centralised, resulting in improvedInventory management. Since then, our assets wereclassified and categorized correctly according to theminimum requirements of asset registers as issuedby National <strong>Treasury</strong> on the Asset ManagementFramework. Validation of the completeness of the assetregister was performed through an annual verification.Section 45(e) of PFMA was also implemented, whereofficials signed inventory lists for assets in their areasof responsibility.11. InventoriesThe value of inventories on hand at 31 March 2011amounted to R2, 2m, which were valued on the first-infirst-out basis of valuation. The inventories comprisedmainly of:• Stationery and printing consumables• Domestic consumables12. Performance Information12.1 The impact of the reconfiguration processThe reconfiguration process required that thedepartment redefine its role in line with its provincialmandate, its strategic role as contained in the PFMA,and the provincial outcomes. As a result, some of oursub-programmes’ actual performance appeared atvariance with the indicators that were initially approved.12.2 The department achieved the followingmilestones during the 2010/11 financial year:• The organisational structure was approved by theMEC and HOD, which information was used tosuccessfully consult with recognised trade unionsin the DCMPT on the entire reconfiguration process• We had spent 98% of our adjusted budgetappropriation (R1, 515bn) at financial year-end.• As part of the MEC for Health’s turnaroundstrategy, we prepared a research report with142142<strong>Annual</strong> <strong>Report</strong> 2010 / 2011
SECTION 4: ANNUAL REPORT OF FINANCIAL THE ACCOUNTING STATEMENTS OFFICERclear recommendations on improving revenuemanagement processes within the Healthsector. Furthermore, funding was availed for theimplementation of an electronic data interfaceto assist the Department of Health in submittingelectronic bills to Medical Schemes. To date, thisproject has been implemented in 14 provincialhospitals. As a consequence, patient recordsmanagement and revenue collection has improvedsignificantly.• A revenue projections model to motor vehiclelicensing fees was successfully piloted with theparticipation of National <strong>Treasury</strong>.• EXCO approved the Integrated Business Plan (IBP)for the <strong>Gauteng</strong> Broadband Solution G-Link fromthe <strong>Provincial</strong> EXCO.• Completed the deployment of our Data ValidationCentre (DAV). The DAV Centre is a microcosm of theG-Link program. It includes different communicationelements, different parts of the value chain includingthe core, aggregation and access that incorporateall technologies and management tools.• The department revisited all long outstanding interdepartmentaldebts, and through a process ofengagement with affected departments managedto resolve 90% of them. This should see thedepartment reporting a very high percentage ofconfirmed inter-departmental debts, and improveddebtor collections in the new financial year.• Minimised litigation and negative publicity byprioritising the payment of SMMEs, and engagingservice providers to consider fixed monthly paymentplans. This approach enabled us to regularisepayments, and effectively operate within our limitedbudget resources.• We were instrumental in monitoring theimplementation of Conditional Grants. This processentailed ring-fencing certain cash resources onbehalf of targeted departments, securing fundingfor the development of the Web-based AssetManagement System, and the development ofthe <strong>Gauteng</strong> Infrastructure Planning Tool for the<strong>Gauteng</strong> Planning Commission.• Appointed FNB as the new provincial banker. Theyhave since completed the takeover process, and arecurrently providing full spectrum banking servicesto the GPG.• Successfully piloted the automation of employmentterminations in the <strong>GDF</strong> to expedite employeeterminations and thus reduce employee debts dueto salary over payments.• Supported job creation by providing additionalaccess to GPG jobs through the automatedrecruitment site which is located at the Maponyashopping mall in Soweto.• Successfully completed the first phase ofautomating recruitment processes. This effort hasimproved response handling turnaround times inan area that has previously been fraught with clientcomplaints.• 2% of all agricultural products consumed in theprovince were sourced directly from emergingfarmers. This initiative contributed to the creationof decent work, in building a growing - inclusiveeconomy, and sustainable livelihoods.• 74, 1% of maintenance contracts for medicalequipment were awarded to BEE suppliers who areOriginal Equipment Manufacturer (OEM) accreditedagents. In addition, 8% savings amounting to R11,2m were realized on the procurement of MedicalEquipment.• Preparations for piloting the Purchase Card projecthave been concluded. This project will enhancebusiness opportunities and improve cash-flows forSMME’s.• Completed the roll-out of E-invoicing at theremaining two departments, i.e. GDID and GDRT.• As part of cleaning the GPG vendor database, 3246 vendors were registered successfully, and 6630 vendor amendments made, thus servicingGPG more efficiently by providing updated vendorinformation.• 123 internal audits were completed against a targetof 129 in all major focus areas. This was consistentwith approved risk-based internal audit plans.143143<strong>Annual</strong> <strong>Report</strong> 2010 / 2011<strong>Gauteng</strong> Department of Finance143
SECTION 4: REPORT ANNUAL OF FINANCIAL THE ACCOUNTING STATEMENTS OFFICER• Completed the deployment of the E-journal projectto all departments and institutions, and theroll out of E-Receipting to all Health and SocialDevelopment entities.• Secured the approval of R1, 4bn in unauthorisedexpenditure by the provincial legislature. Thisapproval resulted in the removal of these liabilitiesfrom the books of affected departments.12.3 Outstanding matters under investigation• Our Forensic Business Unit undertook numerousinvestigations during the period under review.Their findings and recommendations are currentlybeing implemented by the respective managers.• We commissioned an investigation into doublepayments that we suspected to have occurredin another GPG department. On discovery ofthis infraction, we were concerned that moreof our systems could have been compromised,especially Persal and BAS. We therefore deemed itappropriate to initiate this investigation - becauseof transversal systems in which we all operate.The initial results of this investigation suggest thatthere are significant amounts that may have beenduplicated, and we are in the process of validatingthis information. As the investigation is currentlyunderway, we shall only be in a position to reporton its findings on conclusion of the exercise.12.4 Presentation of comparative information fornon-financial targetsThe Department has not presented comparativeachievements relating to the 2009/10 financial year inits report on performance information. This was due tonumerous changes in our strategic focus, which arosefrom the pronouncement of our merger.13. Events occurring after thereporting dateThe <strong>Provincial</strong> Legislature informed us that the budgetapproval process for the fiscal year 2011/12 may only becompleted during August 2011. In these circumstances,Section 29 of the Public Finance Management Actprescribes certain suspensive conditions which compelthe provincial government to only commit and cap itsbudget spending using its last approved budget andits month on month comparison, pending final budgetapproval by the legislature. In line with our mandatein the Province, other provincial departments wereinformed of this limitation. While this may have affectedthe operational scope of the province in terms of newprojects, the department implemented measuresto limit any negative impact. This was undertaken inconsultation with both provincial departments andthe <strong>Provincial</strong> Legislature. Nonetheless, the provincialbudget was approved during July 2011.14. SCOPA resolutionsAll resolutions received from the Standing Committeeon Public Accounts (SCOPA) were implemented to thesatisfaction of the committee.15. ApprovalThe <strong>Annual</strong> Financial Statements set out on pages 145to 204 have been approved by the Accounting Officer.………………………………S. LumkaAccounting Officer forThe <strong>Gauteng</strong> Department of FinanceDATE: 28 July 2011144144<strong>Annual</strong> <strong>Report</strong> 2010 / 2011<strong>Gauteng</strong> Department of Finance144
SECTION 4: ANNUAL FINANCIAL STATEMENTSAPPROPRIATION STATEMENT for the year ended 31 March 2011APPROPRIATION STATEMENTAdjustedAppropriationShiftingof FundsAppropriation per programme2010/11 2009/10VirementFinalAppropriationActualExpenditureVarianceExpenditureas % offinalappropriationFinalAppropriationActualExpenditureR’000 R’000 R’000 R’000 R’000 R’000 % R’000 R’0001. ADMINISTRATION 297,055 - (23,764) 273,291 247,674 25,617 386,718 388,389Current payment 296,649 (11,395) (23,764) 261,490 235,901 25,589 90 329,116 328,710Transfers and subsidies 330 35 - 365 338 27 93 33 33Payment for capital assets 76 43 - 119 118 1 99 57,569 59,646Payment for financial assets - 11,317 - 11,317 11,317 - 100 - -2. SUSTAINABLE RESOURCEMANAGEMENT35,232 - (2,819) 32,413 28,539 3,874 33,184 30,720Current payment 35,232 - (2,819) 32,413 28,539 3,874 88 33,184 30,7203. FINANCIAL GOVERNANCE 43,081 - (3,447) 39,634 35,583 4,051 21,949 21,715Current payment 41,566 - (3,447) 38,119 34,068 4,051 89 21,949 21,715Transfers and subsidies 1,515 - - 1,515 1,515 - 100 - -4. PROVINCIAL ACCOUNTINGSERVICES49,767 - (980) 48,787 48,787 67,736 67,679Current payment 49,766 - (979) 48,787 48,787 - 100 67,606 67,549Transfers and subsidies 1 - (1) - - - 1 1Payment for capital assets - - - - - - - 129 1295. GAUTENG AUDIT SERVICES 45,649 - (2,490) 43,159 42,992 167 - 43,467 43,251Current payment 45,647 - (2,490) 43,157 42,990 167 100 43,161 42,946Transfers and subsidies 2 - - 2 2 - 100 1 1Payment for capital assets - - - - - - - 305 304<strong>Gauteng</strong> Department of Finance145
SECTION 4: ANNUAL FINANCIAL STATEMENTSAPPROPRIATION STATEMENTAdjustedAppropriationShiftingof FundsAppropriation per programme2010/11 2009/10VirementFinalAppropriationActualExpenditureVarianceExpenditureas % offinalappropriationFinalAppropriationActualExpenditureR’000 R’000 R’000 R’000 R’000 R’000 % R’000 R’0006. HIRE TO RETIRE SERVICES 103,699 - (7,143) 96,556 96,556 - - 94,267 94,277Current payment 103,632 (428) (7,143) 96,061 96,061 - 100 94,043 94,053Transfers and subsidies 67 191 - 258 258 - 100 116 116Payment for capital assets - - - - - - - 108 108Payment for financial assets - 237 - 237 237 - 100 - -7. PROCURE TO PAY SERVICES 85,844 - (4,252) 81,592 81,591 1 - 87,503 87,185Current payment 85,723 (7) (4,252) 81,464 81,463 1 100 87,392 87,081Transfers and subsidies 121 7 - 128 128 - 100 72 72Payment for capital assets - - - - - - 39 328. TECHNICAL SUPPORTSERVICES804,681 - 44,895 849,576 852,700 (3,124) - 745,877 732,495Current payment 775,205 (146) 24,478 799,537 831,299 (31,762) 104 739,655 731,679Transfers and subsidies - 146 - 146 146 - 100 7 7Payment for capital assets 29,476 - - 29,476 838 28,638 3 6,215 809Payment for financial assets - - 20,417 20,417 20,417 - 100 - -9. GAUTENG FUND AGENCY 50,000 - - 50,000 50,000 - - 40,000 40,000Transfers and subsidies 50,000 - - 50,000 50,000 - 100 40,000 40,000TOTAL 1,515,008 - - 1,515,008 1,484,422 30,586 98 1,520,701 1,505,711146146<strong>Annual</strong> <strong>Report</strong> 2010 / 2011
SECTION 4: ANNUAL FINANCIAL STATEMENTSFinalAppropriation2010/11 2009/10ActualExpenditureFinalAppropriationActualExpenditureTOTAL (brought forward) 1,515,008 1,484,422 1,520,701 1,505,711Reconciliation with statement of financial performanceADDDepartmental receipts 42,603 56,903Actual amounts per statement of financial performance (total revenue) 1,557,611 1,577,604Actual amounts per statement of financial performance (total expenditure) 1,484,422 1,505,711<strong>Gauteng</strong> Department of Finance147
SECTION 4: ANNUAL FINANCIAL STATEMENTSCurrent paymentsAdjustedAppropriationShiftingof FundsAppropriation per economic classification2010/11 2009/10VirementFinalAppropriationActualExpenditureVarianceExpenditureas % of finalappropriationFinalAppropriationActualexpenditureR’000 R’000 R’000 R’000 R’000 R’000 % R’000 R’000Compensation of employees 546,728 (26,741) (17,749) 502,238 497,950 4,288 99 471,284 468,448Goods and services 886,692 14,765 (2,667) 898,790 901,158 (2,368) 100 944,810 935,994Interest & rent on land - - - - - - - 11 11Transfers and subsidiesDepartmental agencies andaccounts51,500 - - 51,500 51,500 - 100 40,000 40,000Households 536 379 (1) 914 887 27 97 231 230Payments for capital assetsMachinery and equipment 29,477 43 - 29,520 881 28,639 3 64,365 61,028Software and other intangibleassets75 - - 75 75 - 100 - -Payments for financial assets - 11,554 20,417 31,971 31,971 - 100 - -Total 1,515,008 - - 1,515,008 1,484,422 30,586 98 1,520,701 1,505,711148148<strong>Annual</strong> <strong>Report</strong> 2010 / 2011
SECTION 4: ANNUAL FINANCIAL STATEMENTSAdministrationPer Economic classificationCurrent paymentsAdjustedAppropriationShiftingof FundsStatutory Appropriation per economic classification2010/11 2009/10VirementFinalAppropriationActualExpenditureVarianceExpenditureas % of finalappropriationFinalAppropriationActualexpenditureR’000 R’000 R’000 R’000 R’000 R’000 % R’000 R’000Compensation of employees 142,043 (524) (5,033) 136,486 136,314 172 100 115,659 117,740Goods and services 154,606 (10,871) (18,731) 125,004 99,587 25,417 80 213,446 210,959Interest and rent on land - - - - - - - 11 11Transfers and subsidiesHouseholds 330 35 - 365 338 27 93 33 33Payments for capital assetsMachinery and equipment 1 43 - 44 43 1 98 57,569 59,646Software and other intangibleassets75 - - 75 75 - 100 - -Payments for financial assets - 11,317 - 11,317 11,317 - 100 - -Total 297,055 - (23,764) 273,291 247,674 25,617 91 386,718 388,389<strong>Gauteng</strong> Department of Finance149
SECTION 4: ANNUAL FINANCIAL STATEMENTSDetail per sub-programme1.1 OFFICE OF THE MECAdjustedAppropriationShifting ofFunds2010/11 2009/10VirementFinalAppropriationActualExpenditureVarianceExpenditureas % of finalappropriationFinalAppropriationActualexpenditureR’000 R’000 R’000 R’000 R’000 R’000 % R’000 R’000Current payment 5,667 462 - 6,129 5,969 160 97 3,403 3,766Payment for capital assets - 44 - 44 43 1 98 - -1.2 OFFICE OF THE HODCurrent payment 13,633 25,308 - 38,941 30,341 8,600 78 68,136 47,756Transfers and subsidies 20 - - 20 20 - 100 - -Payment for capital assets - - - - - - - 100 771.3 DIVISIONAL HEAD:TSCurrent payment 2,518 276 - 2,794 2,679 115 96 - -1.4 DIVISIONAL HEAD:SSCurrent payment 7,041 (3,245) (1,275) 2,521 2,594 (73) 103 - -1.5 STRTG MANAGEMENT &ENTRS INTRGTNCurrent payment 96,576 (21,513) (18,731) 56,332 42,616 13,716 76 106,308 105,590Transfers and subsidies 28 - - 28 - 28 - - -Payment for capital assets 1 (1) - - - - - 39 39150150<strong>Annual</strong> <strong>Report</strong> 2010 / 2011
SECTION 4: ANNUAL FINANCIAL STATEMENTSDetail per sub-programmeAdjustedAppropriationShifting ofFunds2010/11 2009/10VirementFinalAppropriationActualExpenditureVarianceExpenditureas % of finalappropriationFinalAppropriationActualexpenditureR’000 R’000 R’000 R’000 R’000 R’000 % R’000 R’0001.6 FORENSIC SERVICESCurrent payment 12,598 (271) (442) 11,885 9,966 1,919 84 11,419 11,419Transfers and subsidies 263 - - 263 263 - 100 11 111.7 CORPORATE SERVICESCurrent payment 107,829 (16,568) (2,728) 88,533 88,192 341 100 76,707 97,139Transfers and subsidies 19 5 - 24 25 (1) 104 8 8Payment for capital assets - - - - - - - 116 167Payment for financial assets - 11,317 - 11,317 11,317 - 100 - -1.8 INTERNAL FINANCECurrent payment 35,948 3,915 (588) 39,275 38,618 657 98 46,410 46,307Transfers and subsidies - - - - - - - 7 7Payment for capital assets - - - - - - - 56,774 58,8231.9 DOCUMENTS & RECORDSMANAGEMENTCurrent payment 14,839 241 - 15,080 14,926 154 99 16,733 16,733Transfers and subsidies - 30 - 30 30 - 100 7 7Payment for capital assets 75 - - 75 75 - 100 540 540Total 297,055 - (23,764) 273,291 247,674 25,617 91 386,718 388,389<strong>Gauteng</strong> Department of Finance151
SECTION 4: ANNUAL FINANCIAL STATEMENTSSUSTAINABLE RESOURCEMANAGEMENTPer Economic classificationCurrent paymentsAdjustedAppropriationShifting ofFunds2010/11 2009/10VirementFinalAppropriationActualExpenditureVarianceExpenditureas % of finalappropriationFinalAppropriationActualexpenditureR’000 R’000 R’000 R’000 R’000 R’000 % R’000 R’000Compensation of employees 31,289 - (2,819) 28,470 26,756 1,714 94 28,854 27,080Goods and services 3,943 - - 3,943 1,783 2,160 45 4,330 3,640Total 35,232 - (2,819) 32,413 28,539 3,874 88 33,184 30,720152152<strong>Annual</strong> <strong>Report</strong> 2010 / 2011
SECTION 4: ANNUAL FINANCIAL STATEMENTSDetail per sub-programme2.1 PROGRAMME SUPPORTAdjustedAppropriationShiftingof Funds2010/11 2009/10VirementFinalAppropriationActualExpenditureVarianceExpenditureas % of finalappropriationFinalAppropriationActualexpenditureR’000 R’000 R’000 R’000 R’000 R’000 % R’000 R’000Current payment 1,732 - - 1,732 1,574 158 91 1,712 1,7122.2 BUDGET MANAGEMENTCurrent payment 8,742 - (986) 7,756 6,806 950 88 9,654 8,7392.3 FISCAL POLIYCurrent payment 8,475 - (1,490) 6,985 5,081 1,904 73 7,766 6,7172.4 PUBLIC FINANCECurrent payment 11,361 - (343) 11,018 10,799 219 98 10,091 9,6402.5 PUBLIC PRIVATEPARTNERSHIPCurrent payment 4,922 - - 4,922 4,279 643 87 3,961 3,912Total 35,232 - (2,819) 32,413 28,539 3,874 88 33,184 30,720<strong>Gauteng</strong> Department of Finance153
SECTION 4: ANNUAL FINANCIAL STATEMENTSFINANCIAL GOVERNANCEPer Economic classificationCurrent paymentsAdjustedAppropriationShiftingof Funds2010/11 2009/10VirementFinalAppropriationActualExpenditureVarianceExpenditureas % of finalappropriationFinalAppropriationActualexpenditureR’000 R’000 R’000 R’000 R’000 R’000 % R’000 R’000Compensation of employees 32,770 - (3,447) 29,323 28,352 971 97 17,711 17,711Goods and services 8,796 - - 8,796 5,716 3,080 65 4,238 4,004Transfers and subsidies to:Departmental agencies andaccounts1,500 - - 1,500 1,500 - 100 - -Households 15 - - 15 15 - 100 - -Total 43,081 - (3,447) 39,634 35,583 4,051 90 21,949 21,715154154<strong>Annual</strong> <strong>Report</strong> 2010 / 2011
SECTION 4: ANNUAL FINANCIAL STATEMENTSDetail per sub-programme3.1 PROGRAMME SUPPORT (FG)AdjustedAppropriationShiftingof Funds2010/11 2009/10VirementFinalAppropriationActualExpenditureVarianceExpenditureas % of finalappropriationFinalAppropriationActualexpenditureR’000 R’000 R’000 R’000 R’000 R’000 % R’000 R’000Current payment 1,702 - (1,000) 702 517 185 74 811 8113.2 NORMS AND STANDARDSCurrent payment 3,893 - (1,200) 2,693 2,642 51 98 - -3.3 LOCAL GOV FINANCIALSERVICESCurrent payment 17,237 - (1,100) 16,137 15,385 752 95 10,659 10,425Transfers and subsidies 1,500 - - 1,500 1,500 - 100 - -3.4 RISK MANAGEMENTCurrent payment 12,146 2,035 - 14,181 11,479 2,702 81 10,479 10,479Transfers & subsidies 15 - - 15 15 - 100 - -3.5 FINANCIAL BUSINESSSYSTEMCurrent payment 6,588 (2,035) (147) 4,406 4,045 361 92 - -Total 43,081 - (3,447) 39,634 35,583 4,051 90 21,949 21,715<strong>Gauteng</strong> Department of Finance155
SECTION 4: ANNUAL FINANCIAL STATEMENTSPROVINCIAL ACOUNTINGSERVICESPer Economic classificationCurrent paymentsAdjustedAppropriationShiftingof Funds2010/11 2009/10VirementFinalAppropriationActualExpenditureVarianceExpenditureas % of finalappropriationFinalAppropriationActualexpenditureR’000 R’000 R’000 R’000 R’000 R’000 % R’000 R’000Compensation of employees 47,231 - (475) 46,756 46,756 - 100 46,229 45,976Goods and services 2,535 - (504) 2,031 2,031 - 100 21,377 21,573Transfers and subsidies to:Households 1 - (1) - - - - 1 1Payment for capital assetsMachinery & equipment - - - - - - - 129 129Total 49,767 - (980) 48,787 48,787 - 100 67,736 67,679156156<strong>Annual</strong> <strong>Report</strong> 2010 / 2011
SECTION 4: ANNUAL FINANCIAL STATEMENTSDetail per sub-programme4.1 PAS PROGRAMME SUPPORTAdjustedAppropriationShiftingof Funds2010/11 2009/10VirementFinalAppropriationActualExpenditureVarianceExpenditureas % of finalappropriationFinalAppropriationActualexpenditureR’000 R’000 R’000 R’000 R’000 R’000 % R’000 R’000Current payment 1,443 (5) - 1,438 1,438 - 100 5,586 5,585Payment for capital assets - - - - - - - 15 154.2 FINANCIAL ASSETS &LIABILITIESCurrent payment 14,981 (445) (929) 13,607 13,607 - 100 31,344 31,287Payment for capital assets - - - - - - - 13 134.3 ACCOUNTING SERVICESCurrent payment 14,517 870 - 15,387 15,388 (1) 100 20,863 20,863Payment for capital assets - - - - - - - 101 1014.4 ACCOUNTS RECEIVABLECurrent payment 8,796 1,593 - 10,389 10,389 - 100 9,813 9,814Transfers and subsidies 1 - (1) - - - - 1 14.5 STATUTORY DEDUCTIONMANAGEMENTCurrent payment 10,029 (2,013) (50) 7,966 7,965 1 100 - -Total 49,767 - (980) 48,787 48,787 - 100 67,736 67,679<strong>Gauteng</strong> Department of Finance157
SECTION 4: ANNUAL FINANCIAL STATEMENTSGAUTENG AUDIT SERVICESPer Economic classificationCurrent paymentsAdjustedAppropriationShiftingof Funds2010/11 2009/10VirementFinalAppropriationActualExpenditureVarianceExpenditureas % of finalappropriationFinalAppropriationActualexpenditureR’000 R’000 R’000 R’000 R’000 R’000 % R’000 R’000Compensation of employees 41,497 165 (1,577) 40,085 39,920 165 100 35,646 35,431Goods and services 4,150 (165) (913) 3,072 3,070 2 100 7,515 7,515Transfers and subsidies to:Households 2 - - 2 2 - 100 1 1Payment for capital assetsMachinery and equipment - - - - - - - 305 304Total 45,649 - (2,490) 43,159 42,992 167 100 43,467 43,251158158<strong>Annual</strong> <strong>Report</strong> 2010 / 2011
SECTION 4: ANNUAL FINANCIAL STATEMENTSDetail per sub-programmeAdjustedAppropriationShiftingof Funds2010/11 2009/10VirementFinalAppropriationActualExpenditureVarianceExpenditureas % of finalappropriationFinalAppropriationActualexpenditureR’000 R’000 R’000 R’000 R’000 R’000 % R’000 R’0005.1 PAS PROGRAMMESUPPORTCurrent payment 3,193 658 (883) 2,968 2,969 (1) 100 6,484 6,269Payment for capital assets - - - - - - - 215 2155.2 RISK & COMPLNC:CLUSTR 1.2.3Current payment 10,276 4,860 - 15,136 15,135 1 100 13,842 13,842Transfers and subsidies 2 - - 2 2 - 100 1 15.3 RISK & COMPLNC:CLUSTR 4.5Current payment 15,590 (4,835) (674) 10,081 10,081 - 100 10,134 10,134Transfers and subsidies - - - - - - 100 - -Payments for capital assets - - - - - - - 90 895.4 PERFOMANCE AUDITCurrent payment 9,601 (1,933) (542) 7,126 7,125 1 100 7,844 7,8445.5 COMPUTER AUDITCurrent payment 4,572 285 (391) 4,466 4,300 166 96 4,857 4,8575.6 AUDIT CENTRE OFEXCELLENCECurrent payment 2,415 965 - 3,380 3,380 - 100 - -Total 45,649 - (2,490) 43,159 42,992 167 100 43,467 43,251<strong>Gauteng</strong> Department of Finance159
SECTION 4: ANNUAL FINANCIAL STATEMENTSHIRE TO RETIRE SERVICESPer Economic classificationCurrent paymentsAdjustedAppropriationShiftingof Funds2010/11 2009/10VirementFinalAppropriationActualExpenditureVarianceExpenditureas % of finalappropriationFinalAppropriationActualexpenditureR’000 R’000 R’000 R’000 R’000 R’000 % R’000 R’000Compensation of employees 77,361 (191) (493) 76,677 76,678 (1) 100 83,133 82,908Goods and services 26,271 (237) (6,650) 19,384 19,383 1 100 10,910 11,145Transfers and subsidies to:Households 67 191 - 258 258 - 100 116 116Payments for capital assetsMachinery & Equipment - - - - - - - 108 108Payments for financial assets - 237 - 237 237 - 100 - -Total 103,699 - (7,143) 96,556 96,556 - 100 94,267 94,277160160<strong>Annual</strong> <strong>Report</strong> 2010 / 2011
SECTION 4: ANNUAL FINANCIAL STATEMENTSDetail per sub-programme6.1 HTR PROGRAMMESUPPORTAdjustedAppropriationShiftingof Funds2010/11 2009/10VirementFinalAppropriationActualExpenditureVarianceExpenditureas % of finalappropriationFinalAppropriationActualexpenditureR’000 R’000 R’000 R’000 R’000 R’000 % R’000 R’000Current payment 1,683 433 - 2,116 2,116 - 100 3,492 3,492Payment for capital assets - - - - - - - 47 47Payment for financial assets - 237 - 237 237 - 100 - -6.2 HR TRANSACTIONALSERVICESCurrent payment 47,419 2,058 - 49,477 49,478 (1) 100 53,571 53,812Transfers and subsidies 55 154 - 209 209 - 100 116 116Payment for capital assets - - - - - - - 61 616.3 HR ADVISORY SERVICESCurrent payment 54,530 (2,919) (7,143) 44,468 44,467 1 100 36,980 36,749Transfers and subsidies 12 37 - 49 49 - 100 - -Total 103,699 - (7,143) 96,556 96,556 - 100 94,267 94,277<strong>Gauteng</strong> Department of Finance161
SECTION 4: ANNUAL FINANCIAL STATEMENTSPROCURE TO PAY SERVICESPer Economic classificationCurrent paymentsAdjustedAppropriationShiftingof Funds2010/11 2009/10VirementFinalAppropriationActualExpenditureVarianceExpenditureas % of finalappropriationFinalAppropriationActualexpenditureR’000 R’000 R’000 R’000 R’000 R’000 % R’000 R’000Compensation of employees 85,117 (605) (3,905) 80,607 80,607 - 100 79,301 79,006Goods and services 606 598 (347) 857 856 1 100 8,091 8,075Transfers and subsidies to:Households 121 7 - 128 128 - 100 72 72Payments for capital assetsMachinery & Equipment - - - - - - - 39 32Total 85,844 - (4,252) 81,592 81,591 1 100 87,503 87,185162162<strong>Annual</strong> <strong>Report</strong> 2010 / 2011
SECTION 4: ANNUAL FINANCIAL STATEMENTSDetail per sub-programme7.1 PTP PROGRAMMESUPPORTAdjustedAppropriationShifting ofFunds2010/11 2009/10VirementFinalAppropriationActualExpenditureVarianceExpenditureas % of finalappropriationFinalAppropriationActualexpenditureR’000 R’000 R’000 R’000 R’000 R’000 % R’000 R’000Current payment 3,490 (357) (434) 2,699 2,699 - 100 6,645 6,580Payments for capital assets - - - - - - - 7 -7.2 PRCMNT SRN & SPTSRVC CLST 1Current payment 49,656 (105) (3,647) 45,904 45,903 1 100 46,509 46,493Transfers & subsidies 29 7 - 36 36 - 100 53 53Payments for capital assets - - - - - - - 19 197.3 PRCMNT SRN & SPTSRVC CLST 1Current payment 32,577 455 (171) 32,861 32,861 - 100 34,238 34,008Transfers and subsidies 92 - - 92 92 - 100 19 19Payment for capital assets - - - - - - - 13 13Total 85,844 - (4,252) 81,592 81,591 1 100 87,503 87,185<strong>Gauteng</strong> Department of Finance163
SECTION 4: ANNUAL FINANCIAL STATEMENTSTECHNOLOGICAL SUPPORTSERVICESPer Economic classificationCurrent paymentsAdjustedAppropriationShiftingof Funds2010/11 2009/10VirementFinalAppropriationActualExpenditureVarianceExpenditureas % of finalappropriationFinalAppropriationActualexpenditureR’000 R’000 R’000 R’000 R’000 R’000 % R’000 R’000Compensation of employees 89,420 (25,586) - 63,834 62,567 1,267 98 64,751 62,596Goods and services 685,785 25,440 24,478 735,703 768,732 (33,029) 105 674,903 669,083Transfers and subsidies to:Households - 146 - 146 146 - 100 8 7Payment for capital assetsMachinery and equipment 29,476 - - 29,476 838 28,638 3 6,215 809Payments for financial assets - - 20,417 20,417 20,417 - 100 - -Total 804,681 - 44,895 849,576 852,700 (3,124) 100 745,877 732,495164164<strong>Annual</strong> <strong>Report</strong> 2010 / 2011
SECTION 4: ANNUAL FINANCIAL STATEMENTSDetail per sub-programme8.1 TSS PROGRAMMESUPPORTAdjustedAppropriationShiftingof Funds2010/11 2009/10VirementFinalAppropriationActualExpenditureVarianceExpenditureas % of finalappropriationFinalAppropriationActualexpenditureR’000 R’000 R’000 R’000 R’000 R’000 % R’000 R’000Current payment 2,624 1,135 - 3,759 3,764 (5) 100 6,037 6,035Payment for capital assets - - - - - - - 6 -8.2 PROGRAMMES ANDAPPLICATIONCurrent payment 151,196 (24,431) - 126,765 126,664 101 100 61,832 61,832Transfers and subsidies - 10 - 10 10 - 100 - -Payment for capital assets 2,317 - - 2,317 - 2,317 - - -8.3 PLANNING ANDOPERATIONSCurrent payment 173,316 (17,854) - 155,462 155,558 (96) 100 209,193 215,333Transfers and subsidies - 1 - 1 1 - 100 - 1Payment for capital assets 12,159 - - 12,159 - 12,159 - 809 8098.4 E-GOVERNMENTCurrent payment 448,069 41,004 24,478 513,551 545,313 (31,762) 106 462,593 448,479Transfers and subsidies - 135 - 135 135 - 100 7 6Payment for capital assets 15,000 - - 15,000 838 14,162 6 5,400 -Payment for financial assets - - 20,417 20,417 20,417 - 100 -Total 804,681 - 44,895 849,576 852,700 (3,124) 100 745,877 732,495<strong>Gauteng</strong> Department of Finance165
SECTION 4: ANNUAL FINANCIAL STATEMENTSGAUTENG FUND AGENCYPer Economic classificationTransfers and subsidies to:Departmental agencies andaccountsAdjustedAppropriationShiftingof Funds2010/11 2009/10VirementFinalAppropriationActualExpenditureVarianceExpenditureas % of finalappropriationFinalAppropriationActualexpenditureR’000 R’000 R’000 R’000 R’000 R’000 % R’000 R’00050,000 - - 50,000 50,000 - 100 40,000 40,000Total 50,000 - - 50,000 50,000 - 100 40,000 40,000Detail per sub-programme9.1 GAUTENG FUNDPROJECT OFFICEAdjustedAppropriationShiftingof Funds2010/11 2009/10VirementFinalAppropriationActualExpenditureVarianceExpenditureas % of finalappropriationFinalAppropriationActualexpenditureR’000 R’000 R’000 R’000 R’000 R’000 % R’000 R’000Transfers and subsidies 50,000 - - 50,000 50,000 - 100 40,000 40,000Total 50,000 - - 50,000 50,000 - 100 40,000 40,000166166<strong>Annual</strong> <strong>Report</strong> 2010 / 2011
SECTION 4: ANNUAL FINANCIAL STATEMENTSNOTES TO THE APPROPRIATION STATEMENT for theyear ended 31 March 20111. Detail of transfers and subsidies as per AppropriationAct (after Virement):Detail of these transactions can be viewed in the note on Transfers and subsidies,disclosure notes and Annexure 1 (A-H) to the <strong>Annual</strong> Financial Statements.2. Detail of specifically and exclusively appropriatedamounts voted (after Virement):Detail of these transactions can be viewed in note 1 (<strong>Annual</strong> Appropriation) to the<strong>Annual</strong> Financial Statements.3. Detail on payments for financial assetsDetail of these transactions per programme can be viewed in the note on Paymentsfor financial assets to the <strong>Annual</strong> Financial Statements.4. Explanations of material variances from Amounts Voted(after Virement):4.1 Per ProgrammeVariance asFinal ActualAppropriation Expenditure Variance a % of FinalAppropriationR’000 R’000 R’000 %Administration 273,291 247,674 25,617 9Sustainable ResourceManagement32,413 28,539 3,874 12Financial Governance 39,634 35,583 4,051 10Technological SupportServices849,576 852,700 (3,124) 04.2 Per EconomicclassificationCurrent paymentsCompensation ofemployeesVariance asFinal ActualAppropriation Expenditure Variance a % of FinalAppropriationR’000 R’000 R’000 %502,238 497,950 4,288 1Goods and services 898,790 901,158 (2,368) 0Transfers and subsidiesDepartmental agencies51,500 51,500 - 0and accountsHouseholds 914 887 27 0Payments for capitalassetsMachinery andequipmentSoftware and otherintangible assetsPayments for financialassets29,520 881 28,639 9775 75 - 031,971 31,971 - 0<strong>Gauteng</strong> Department of Finance167
SECTION 4: ANNUAL FINANCIAL STATEMENTSAdministrationThe total amount of R25, 6 million under-spent in theAdministration programme relates to:• R24,1 million is the outstanding amount of the totalbudget amounting to R71,1 million allocated toconsulting services under Administration; followingupon a departmental decision to cut back on theuse of consultants and to utilise own resources,resulting in the under-spend on this item.• An amount of R1, 5 million had been allocatedto Forensic Audit for the IT2 Analyst Notebooksolution which, due to budget priorities was notcarried out.Sustainable Resource ManagementThe Sustainable Resource Management programmeunder-spent on the compensation of employees tothe amount of R1, 7 million: a total of 77 posts werebudgeted for; however, 13 posts were vacant at yearend,comprising Chief Director, Director, DeputyDirector and Assistant Director posts. Under-spendingon goods and services amounts to R2, 2 million ofwhich R1, 7 million had been allocated to the gamblingtax project that had not been completed at yearend;R395 thousand had been allocated to the printingof 2011/12 budget books but the invoice had notbeen received at year-end; and the R106 thousandhad been allocated to consultants: legal costs underPublic Private Partnership, which had not beenutilised.Financial GovernanceFinancial Governance programme under-spent oncompensation of employees to the amount of R971thousand: a total of 84 posts were budgeted for:however, 13 posts were vacant at year-end, comprisingof DDG, Director, Assistant Director, Senior and JuniorAudit posts. Under-spent on goods and servicesamounts to R3 million: of which, R2 million is theoutstanding amount of the total budget amounting toR6, 9 million that had been allocated for the StandardProcedure Manuals; R1, 1 million had been allocated forthe Financial Governance for the training of municipalofficials, and the concomitant expenditure arising fromthe support the programme provides to municipalities,such as travel and subsistence and booking of venuesand facilities.Technological Support ServicesUnauthorised expenditure of R3, 1 million arose as aresult of overspending for GPG contact centre undercurrent payments (goods and services).Payment for capital assetsA request for the rollover of the amount under-spentunder payments for capital assets amounting toR28, 6 million has been submitted to <strong>Treasury</strong> forconsideration. The procurement process to secureservers and computers had begun but could not becompleted in time by year-end, hence the request forthe rollover of funds.168168<strong>Annual</strong> <strong>Report</strong> 2010 / 2011
SECTION 4: ANNUAL FINANCIAL STATEMENTSSTATEMENT OF FINANCIAL PERFORMANCE for the year ended 31 March 2011Note 2010/11 2009/10R’000 R’000REVENUE<strong>Annual</strong> appropriation 1 1,515,008 1,520,701Departmental revenue 2 42,603 56,903TOTAL REVENUE 1,557,611 1,577,604EXPENDITURECurrent expenditureCompensation of employees 3 497,950 468,448Goods and services 4 901,158 935,994Total current expenditure 1,399,108 1,404,442Transfers and subsidies 6 52,387 40,230Expenditure for capital assetsTangible capital assets 7 881 60,880Software and other intangible assets 7 75 148Total expenditure for capital assets 956 61,028Payments for financial assets 5 31,971 11TOTAL EXPENDITURE 1,484,422 1,505,711SURPLUS FOR THE YEAR 73,189 71,893Reconciliation of Net Surplus for the yearVoted funds 30,586 14,990Departmental revenue 2 42,603 56,903SURPLUS FOR THE YEAR 73,189 71,893<strong>Gauteng</strong> Department of Finance169
SECTION 4: ANNUAL FINANCIAL STATEMENTSSTATEMENT OF FINANCIAL POSITION as at 31 March 2011ASSETSNote 2010/11 2009/10R’000 R’000Current assets 95,734 162,811Unauthorised expenditure 8 5,534 31,628Cash and cash equivalents 9 15,832 4,103Prepayments and advances 10 279 476Receivables 11 74,089 126,604TOTAL ASSETS 95,734 162,811LIABILITIESCurrent liabilities 95,734 162,811Voted funds to be surrendered to the Revenue Fund 12 33,710 17,341Departmental revenue and NRF Receipts to be surrendered to the Revenue Fund 13 9,9921,133Bank overdraft 14 - 119,371Payables 15 52,032 24,966TOTAL LIABILITIES 95,734 162,811NET ASSETS - -170170<strong>Annual</strong> <strong>Report</strong> 2010 / 2011
SECTION 4: ANNUAL FINANCIAL STATEMENTSCASH FLOW STATEMENT for the year ended 31 March 2011Note 2010/11 2009/10R’000 R’000CASH FLOWS FROM OPERATING ACTIVITIESReceipts 1,557,549 1,577,604<strong>Annual</strong> appropriated funds received 1.1 1,515,008 1,520,701Departmental revenue received 2 42,541 56,903Net decrease in working capital 108,996 14,298Surrendered to Revenue Fund (51,085) (170,118)Current payments (1,399,108) (1,402,091)Payments for financial assets (31,971) (11)Transfers and subsidies paid (52,387) (40,230)Net cash flow available from operating activities 16 131,994 (20,548)CASH FLOWS FROM INVESTING ACTIVITIESPayments for capital assets 7 (956) (61,028)Proceeds from sale of capital assets 2.3 62 -Net cash flows from investing activities (894) (61,028)Net increase/(decrease) in cash and cash equivalents 131,100 (81,576)Cash and cash equivalents at beginning of period (115,268) (33,692)Cash and cash equivalents at end of period 17 15,832 (115,268)<strong>Gauteng</strong> Department of Finance171
SECTION 4: ANNUAL FINANCIAL STATEMENTSACCOUNTING POLICIESfor the year ended 31 March 2011The Financial Statements have been prepared inaccordance with the following policies, which have beenapplied consistently in all material aspects, unlessotherwise indicated. However, where appropriate andmeaningful, additional information has been disclosedto enhance the usefulness of the Financial Statementsand to comply with the statutory requirements ofthe Public Finance Management Act, Act 1 of 1999(as amended by Act 29 of 1999), and the <strong>Treasury</strong>Regulations issued in terms of the Act and the Divisionof Revenue Act, Act 1 of 2010.1. Presentation of the FinancialStatements1.1 Basis of preparationThe Financial Statements have been prepared on amodified cash basis of accounting, except where statedotherwise. The modified cash basis constitutes thecash basis of accounting supplemented with additionaldisclosure items. Under the cash basis of accountingtransactions and other events are recognised whencash is received or paid.1.2 Presentation currencyAll amounts have been presented in the currency ofthe South African Rand (R) which is also the functionalcurrency of the department.1.3 RoundingUnless otherwise stated all financial figures have beenrounded to the nearest one thousand Rand (R’000).1.4 Comparative figuresPrior period comparative information has beenpresented in the current year’s financial statements.Where necessary figures included in the prior periodfinancial statements have been reclassified to ensurethat the format in which the information is presented isconsistent with the format of the current year’s financialstatements.1.5 Comparative figures - Appropriation StatementA comparison between actual amounts and finalappropriation per major classification of expenditure isincluded in the Appropriation Statement.2. Revenue2.1 Appropriated fundsAppropriated funds comprises of departmentalallocations as well as direct charges against revenuefund (i.e. statutory appropriation).Appropriated funds are recognised in the financialrecords on the date the appropriation becomes effective.Adjustments made in terms of the adjustments budgetprocess are recognised in the financial records on thedate the adjustments become effective.Unexpended appropriated funds are surrendered tothe <strong>Provincial</strong> Revenue Fund. Any amounts owing to the<strong>Provincial</strong> Revenue Fund at the end of the financial yearare recognised as payable in the statement of financialposition.Any amount due from the <strong>Provincial</strong> Revenue Fundat the end of the financial year is recognised as areceivable in the statement of financial position.2.2 Departmental revenueAll departmental revenue is recognised in thestatement of financial performance when received and172172<strong>Annual</strong> <strong>Report</strong> 2010 / 2011
SECTION 4: ANNUAL FINANCIAL STATEMENTSis subsequently paid into the <strong>Provincial</strong> Revenue Fund,unless stated otherwise.Any amount owing to the <strong>Provincial</strong> Revenue Fund isrecognised as a payable in the statement of financialposition.No accrual is made for amounts receivable from thelast receipt date to the end of the reporting period.These amounts are however disclosed in the disclosurenote to the annual financial statements.2.3 Direct Exchequer receiptsAll direct exchequer receipts are recognised in thestatement of financial performance when the cash isreceived and is subsequently paid into the <strong>Provincial</strong>Revenue Fund, unless stated otherwise.Any amount owing to the <strong>Provincial</strong> Revenue Funds atthe end of the financial year is recognised as a payablein the statement of financial position.2.4 Direct Exchequer paymentsAll direct exchequer payments are recognised inthe statement of financial performance when finalauthorisation for payment is effected on the system (byno later than 31 March of each year).3. Expenditure3.1 Compensation of employees3.1.1 Salaries and wagesSalaries and wages are expensed in the statement offinancial performance when the final authorisation forpayment is effected on the system (by no later than 31March of each year).Other employee benefits that give rise to a presentlegal or constructive obligation are disclosed in thedisclosure notes to the financial statements at itsface value and are not recognised in the statement offinancial performance or position.Employee costs are capitalised to the cost of a capitalproject when an employee spends more than 50% ofhis/her time on the project. These payments form partof expenditure for capital assets in the statement offinancial performance.3.1.2 Social contributionsEmployer contributions to post employment benefitplans in respect of current employees are expensed inthe statement of financial performance when the finalauthorisation for payment is effected on the system (byno later than 31 March of each year).No provision is made for retirement benefits in thefinancial statements of the department. Any potentialliabilities are disclosed in the financial statements ofthe National Revenue Fund and not in the financialstatements of the employer department.Employer contributions made by the department forcertain of its ex-employees (such as medical benefits)are classified as transfers to households in thestatement of financial performance.3.2 Goods and servicesPayments made during the year for goods and/orservices are recognised as an expense in the statementof financial performance when the final authorisationfor payment is effected on the system (by no later than31 March of each year).The expense is classified as capital if the goods and/or services were acquired for a capital project or ifthe total purchase price exceeds the capitalisationthreshold (currently R5, 000). All other expendituresare classified as current.Rental paid for the use of buildings or other fixedstructures is classified as goods and services and notas rent on land.<strong>Gauteng</strong> Department of Finance173
SECTION 4: ANNUAL FINANCIAL STATEMENTS3.3 Interest and rent on landInterest and rental payments are recognised as anexpense in the statement of financial performancewhen the final authorisation for payment is effected onthe system (by no later than 31 March of each year).This item excludes rental for the use of buildings orother fixed structures. If it is not possible to distinguishbetween payment for the use of land and the fixedstructures on it, the whole amount should be recordedunder goods and services.3.4 Payments for financial assetsDebts are written off when identified as irrecoverable.Debts written-off are limited to the amount of savingsand/or underspending of appropriated funds. The writeoff occurs at year-end or when funds are available.No provision is made for irrecoverable amounts butan estimate is included in the disclosure notes to thefinancial statements amounts.All other losses are recognised when authorisation hasbeen granted for the recognition thereof.3.5 Transfers and subsidiesTransfers and subsidies are recognised as an expensewhen the final authorisation for payment is effected onthe system (by no later than 31 March of each year).3.6 Unauthorised expenditureWhen confirmed unauthorised expenditure isrecognised as an asset in the statement of financialposition until such time as the expenditure is eitherapproved by the relevant authority, recovered from theresponsible person or written off as irrecoverable in thestatement of financial performance.Unauthorised expenditure approved with funding isderecognised from the statement of financial positionwhen the unauthorised expenditure is approved andthe related funds are received.Where the amount is approved without funding it isrecognised as expenditure in the statement of financialperformance on the date of approval.3.7 Fruitless and wasteful expenditureFruitless and wasteful expenditure is recognised asexpenditure in the statement of financial performanceaccording to the nature of the payment and not as aseparate line item on the face of the statement. If theexpenditure is recoverable it is treated as an assetuntil it is recovered from the responsible person orwritten off as irrecoverable in the statement of financialperformance.3.8 Irregular expenditureIrregular expenditure is recognised as expenditurein the statement of financial performance. If theexpenditure is not condoned by the relevant authority itis treated as an asset until it is recovered or written offas irrecoverable.4. Assets4.1 Cash and cash equivalentsCash and cash equivalents are carried in the statementof financial position at cost.Bank overdrafts are shown separately on the face ofthe statement of financial position.For the purposes of the cash flow statement, cash andcash equivalents comprise cash on hand, depositsheld, other short-term highly liquid investments andbank overdrafts.4.2 Other financial assetsOther financial assets are carried in the statement offinancial position at cost.4.3 Prepayments and advancesAmounts prepaid or advanced are recognised in the174174<strong>Annual</strong> <strong>Report</strong> 2010 / 2011
SECTION 4: ANNUAL FINANCIAL STATEMENTSstatement of financial position when the payments aremade and are derecognised as and when the goods/services are received or the funds are utilised.Prepayments and advances outstanding at the endof the year are carried in the statement of financialposition at cost.4.4 ReceivablesReceivables included in the statement of financialposition arise from cash payments made that arerecoverable from another party (including departmentalemployees) and are derecognised upon recovery orwrite-off.Receivables outstanding at year-end are carried in thestatement of financial position at cost plus any accruedinterest. Amounts that are potentials irrecoverable areincluded in the disclosure notes.4.5 InventoryInventories that qualify for recognition must be initiallyreflected at cost. Where inventories are acquired at nocost, or for nominal consideration, their cost shall betheir fair value at the date of acquisition.All inventory items at year-end are reflected using theweighted average cost or FIFO cost formula.4.6 Capital assets4.6.1 Movable assetsInitial recognitionA capital asset is recorded in the asset register onreceipt of the item at cost. Cost of an asset is definedas the total cost of acquisition. Where the cost cannotbe determined accurately, the movable capital assetis stated at fair value. Where fair value cannot bedetermined, the capital asset is included in the assetregister at R1.All assets acquired prior to 1 April 2002 are included inthe register R1.Subsequent recognitionSubsequent expenditure of a capital nature isrecorded in the statement of financial performance as“expenditure for capital assets” and is capitalised inthe asset register of the department on completion ofthe project.Repairs and maintenance is expensed as current“goods and services” in the statement of financialperformance.4.6.2 Immovable assetsInitial recognitionA capital asset is recorded on receipt of the item atcost. Cost of an asset is defined as the total cost ofacquisition. Where the cost cannot be determinedaccurately, the immovable capital asset is stated atR1 unless the fair value for the asset has been reliablyestimated.Subsequent recognitionWork-in-progress of a capital nature is recorded in thestatement of financial performance as “expenditurefor capital assets”. On completion, the total costof the project is included in the asset register of thedepartment that is accountable for the asset.Repairs and maintenance is expensed as current“goods and services” in the statement of financialperformance.5. Liabilities5.1 PayablesRecognised payables mainly comprise of amountsowing to other governmental entities. These payablesare carried at cost in the statement of financial position.5.2 Contingent liabilitiesContingent liabilities are included in the disclosurenotes to the financial statements when it is possiblethat economic benefits will flow from the department,or when an outflow of economic benefits or servicepotential is probable but cannot be measured reliably.<strong>Gauteng</strong> Department of Finance175
SECTION 4: ANNUAL FINANCIAL STATEMENTS5.3 Contingent assetsContingent assets are included in the disclosure notesto the financial statements when it is probable that aninflow of economic benefits will flow to the entity.5.4 CommitmentsCommitments are not recognised in the statement offinancial position as a liability or as expenditure in thestatement of financial performance but are included inthe disclosure notes.5.5 AccrualsAccruals are not recognised in the statement offinancial position as a liability or as expenditure in thestatement of financial performance but are included inthe disclosure notes.5.6 Employee benefitsShort-term employee benefits that give rise to apresent legal or constructive obligation are disclosedin the disclosure notes to the financial statements.These amounts are not recognised in the statementof financial performance or the statement of financialposition.5.7 Lease commitmentsFinance leaseFinance leases are not recognised as assets andliabilities in the statement of financial position.Finance lease payments are recognised as an expensein the statement of financial performance and areapportioned between the capital and interest portions.The finance lease liability is disclosed in the disclosurenotes to the financial statements.Operating leaseOperating lease payments are recognised as anexpense in the statement of financial performance.The operating lease commitments are disclosed in thediscloser notes to the financial statement.5.8 Impairment and other provisionsThe department tests for impairment where thereis an indication that a receivable, loan or investmentmay be impaired. An assessment of whether there isan indication of possible impairment is done at eachreporting date. An estimate is made for doubtful loansand receivables based on a review of all outstandingamounts at year-end. Impairments on investmentsare calculated as being the difference between thecarrying amount and the present value of the expectedfuture cash flows / service potential flowing from theinstrument.Provisions are disclosed when there is a present legalor constructive obligation to forfeit economic benefitsas a result of events in the past and it is probable thatan outflow of resources embodying economic benefitswill be required to settle the obligation and a reliableestimate of the obligation can be made.6. Receivables for departmentalrevenueReceivables for departmental revenue are disclosed inthe disclosure notes to the annual financial statements.7. Key management personnelCompensation paid to key management personnelincluding their family members where relevant, isincluded in the disclosure notes.176176<strong>Annual</strong> <strong>Report</strong> 2010 / 2011
SECTION 4: ANNUAL FINANCIAL STATEMENTSNOTES TO THE ANNUAL FINANCIAL STATEMENTS for the year ended 31 March 20111. <strong>Annual</strong> Appropriation1.1 <strong>Annual</strong> AppropriationIncluded are funds appropriated in terms of the Appropriation Act (and the Adjustments Appropriation Act) for National Departments (Voted funds) and <strong>Provincial</strong> Departments:2010/11 2009/10Final AppropriationActual FundsFunds not requested/ AppropriationReceivednot receivedreceivedProgramme R’000 R’000 R’000 R’000Administration 273,291 273,291 - 386,718Sustainable Resource Management 32,413 32,413 - 33,184Financial Governance 39,634 39,634 - 21,949<strong>Provincial</strong> Accounting Service 48,787 48,787 - 67,736<strong>Gauteng</strong> Audit Services 43,159 43,159 - 43,467Hire to Retire Services 96,556 96,556 - 94,267Procure to Pay Services 81,592 81,592 - 87,503Technology Support Serv 849,576 849,576 - 745,877<strong>Gauteng</strong> Fund Agency 50,000 50,000 - 40,000Total 1,515,008 1,515,008 - 1,520,7012. Departmental revenueNote 2010/11 2009/10R’000 R’000Sales of goods and services other than capital assets 2.1 936 881Interest, dividends and rent on land 2.2 37,044 54,165Sales of capital assets 2.3 62 -Transactions in financial assets and liabilities 2.4 4,561 1,857Departmental revenue collected 42,603 56,903<strong>Gauteng</strong> Department of Finance177
SECTION 4: ANNUAL FINANCIAL STATEMENTS2.1 Sales of goods and services other than capital assets2010/11 2009/10R’000 R’000Sales of goods and services produced by the department 936 881Sales by market establishment 569 486Other sales 367 395Total 936 8812.2 Interest, dividends and rent on land2010/11 2009/10R’000 R’000Interest 37,044 54,165Total 37,044 54,1652.3 Sale of capital assetsNote 2010/11 2009/10R’000 R’000Tangible assetsMachinery and equipment 29.2 62 -Total 62 -2.4 Transactions in financial assets and liabilities2010/11 2009/10R’000 R’000Stale cheques written back - 98Other Receipts including Recoverable Revenue 4,561 1,759Total 4,561 1,857178178<strong>Annual</strong> <strong>Report</strong> 2010 / 2011
SECTION 4: ANNUAL FINANCIAL STATEMENTS3. Compensation of employees3.1 Salaries and Wages2010/11 2009/10R’000 R’000Basic salary 342,738 318,624Performance award 4,806 4,424Service Based 23,885 21,501Compensative/circumstantial 3,438 5,934Periodic payments 3,878 5,058Other non-pensionable allowances 56,536 56,835Total 435,281 412,3763.2 Social contributions2010/11 2009/10R’000 R’000Employer contributionsPension 42,435 38,471Medical 20,144 17,550Bargaining council 90 51Total 62,669 56,072Total compensation of employees 497,950 468,448Average number of employees 1 704 1 745<strong>Gauteng</strong> Department of Finance179
SECTION 4: ANNUAL FINANCIAL STATEMENTS4. Goods and servicesNote 2010/11 2009/10R’000 R’000Administrative fees 15,028 8,159Advertising 6,758 13,494Assets less then R5,000 4.1 39 357Bursaries (employees) 1,552 2,673Catering 292 641Communication 32,885 32,660Computer services 4.2 100,847 137,230Consultants, contractors and agency/outsourced services 4.3 700,977 673,009Entertainment 63 62Audit cost – external 4.4 7,090 9,644Fleet services 22 14Inventory 4.5 3,381 7,594Operating leases 10,142 8,470Owned and leasehold property expenditure 4.6 10,540 14,149Travel and subsistence 4.7 8,080 12,236Venues and facilities 406 2,527Training and staff development 605 9,653Other operating expenditure 4.8 2,451 3,422Total 901,158 935,994180180<strong>Annual</strong> <strong>Report</strong> 2010 / 2011
SECTION 4: ANNUAL FINANCIAL STATEMENTS4.1 Assets less than R5,0002010/11 2009/10R’000 R’000Tangible assetsMachinery and equipment 39 344Intangible assets - 13Total 39 3574.2 Computer services2010/11 2009/10R’000 R’000SITA computer services 53,965 32,533External computer service providers 46,882 104,697Total 100,847 137,2304.3 Consultants, contractors and agency/outsourced services2010/11 2009/10R’000 R’000Business and advisory services 660,523 641,880Legal costs 747 15,981Contractors 38,613 14,245Agency and support/outsourced services 1,094 903Total 700,977 673,0094.4 Audit cost – External2010/11 2009/10R’000 R’000Regularity audits 7,090 9,644Total 7,090 9,644<strong>Gauteng</strong> Department of Finance181
SECTION 4: ANNUAL FINANCIAL STATEMENTS4.5 Inventory2010/11 2009/10R’000 R’000Food and food supplies 33 239Fuel, oil and gas 13 52Other consumable materials 403 146Maintenance material 39 183Stationery and printing 2,893 6,970Medical supplies - 4Total 3,381 7,5944.6 Property payments2010/11 2009/10R’000 R’000Municipal services 9,401 14,032Property management fees 649 -Property maintenance and repairs 490 -Other - 117Total 10,540 14,1494.7 Travel and subsistence2010/11 2009/10R’000 R’000Local 7,280 9,323Foreign 800 2,913Total 8,080 12,236182182<strong>Annual</strong> <strong>Report</strong> 2010 / 2011
SECTION 4: ANNUAL FINANCIAL STATEMENTS4.8 Other operating expenditure2010/11 2009/10R’000 R’000Professional bodies, membership and subscription fees - 807Resettlement costs - 465Other 2,451 2,150Total 2,451 3,4225. Payments for financial assetsNote 2010/11 2009/10R’000 R’000Material losses through criminal conductTheft 5.2 28 -Debts written off 5.1 31,943 11Total 31,971 115.1 Debts written off2010/11 2009/10R’000 R’000Nature of debts written offDebts written off relating to irregular expenditure - 11Irrecoverable debts 227 -Irrecoverable claims written off 29,832 -Disallowance damages and losses 844 -Disallowance payment fraud 421 -2008/09 Fruitless and wasteful expenditure 11 -GPG Bursaries 608 -Total 31,943 11<strong>Gauteng</strong> Department of Finance183
SECTION 4: ANNUAL FINANCIAL STATEMENTS5.2 Detail of theft2010/11 2009/10R’000 R’000Nature of theftPetty Cash 17 -Petty Cash vouchers 11 -Total 28 -6. Transfers and subsidiesNote 2010/11 2009/10R’000 R’000Departmental agencies and accounts Annex 1C 51,500 40,000Households Annex 1H 887 230Total 52,387 40,2307. Expenditure for capital assetsNote 2010/11 2009/10R’000 R’000Tangible assets 881 60,880Machinery and equipment 29 881 60,880Software and other intangible assets 75 148Computer software 30 - 148Other intangibles 30 75 -Total 956 61,028184184<strong>Annual</strong> <strong>Report</strong> 2010 / 2011
SECTION 4: ANNUAL FINANCIAL STATEMENTS7.1 Analysis of funds utilised to acquire capital assets – 2010/11Voted fundsTotalR’000 R’000Tangible assets 881 881Machinery and equipment 881 881Software and other intangible assets 75 75Other intangibles 75 75Total 956 9567.2 Analysis of funds utilised to acquire capital assets – 2009/10Voted fundsTotalR’000 R’000Tangible assets 60,880 60,880Machinery and equipment 60,880 60,880Software and other intangible assets 148 148Computer software 148 148Total 61,028 61,0288. Unauthorised expenditure8.1 Reconciliation of unauthorised expenditure2010/11 2009/10R’000 R’000Opening balance 31,628 29,277Unauthorised expenditure – discovered in current year 3,124 2,351Less: Amounts approved by Legislature with funding (29,218) -Unauthorised expenditure awaiting authorisation 5,534 31,628<strong>Gauteng</strong> Department of Finance185
SECTION 4: ANNUAL FINANCIAL STATEMENTS8.2 Analysis of unauthorised expenditure awaiting authorisation per economic classification2010/11 2009/10R’000 R’000Capital 2,351 2,351Current 3,183 29,277Total 5,534 31,6288.3 Analysis of unauthorised expenditure awaiting authorisation per type2010/11 2009/10R’000 R’000Unauthorised expenditure relating to overspending of the vote or a main division within a vote 5,534 31,628Total 5,534 31,628Unauthorised expenditure age analysisR’0002007/08 R 592009/10 R2,3512010/11 R3,124Total R5,5348.4 Details of unauthorised expenditure – current yearIncidentDisciplinary steps taken/criminal 2010/11proceedingsR’000Overspending of a main division of the vote None 3,124Total 3,1249. Cash and cash equivalents2010/11 2009/10R’000 R’000Consolidated Paymaster General Account 15,769 3,651Cash on hand 63 452Total 15,832 4,103186186<strong>Annual</strong> <strong>Report</strong> 2010 / 2011
SECTION 4: ANNUAL FINANCIAL STATEMENTS10. Prepayments and advances2010/11 2009/10R’000 R’000Travel and subsistence 229 476Prepayments 50 -Total 279 47611. Receivables2010/11 2009/10R’000 R’000 R’000 R’000 R’000NoteLess than One to Older thanone year three years three yearsTotalTotalClaims recoverable 11.1 29,412 15,185 26,078 70,675 122,984Annex 4Staff debt 11.2 1,254 181 131 1,566 665Other debtors 11.3 1,698 150 - 1,848 2,955Total 32,364 15,516 26,209 74,089 126,60411.1 Claims recoverable2010/11 2009/10R’000 R’000<strong>Provincial</strong> departments** 70,675 122,984Total 70,675 122,984**2009/10 receivables in the statement of financial position adjusted with an amount of R588,000 for interdepartmental claims previously included is payables as perannexure 4.<strong>Gauteng</strong> Department of Finance187
SECTION 4: ANNUAL FINANCIAL STATEMENTS11.2 Staff debt2010/11 2009/10R’000 R’000Various staff members ( bursaries and salaries-related) 1,566 665Total 1,566 66511.3 Other debtors2010/11 2009/10R’000 R’000Damages and losses to be recovered - 1,265Advances to <strong>Gauteng</strong> and Tender deposit - 658Various clearing accounts 305 182Fruitless and wasteful expenditure under investigation - 10Suppliers 1,540 840Sal: Recoverable - -Deposit Account 3 -Total 1,848 2,95512. Voted funds to be surrendered to the Revenue Fund2010/11 2009/10R’000 R’000Opening balance 17,341 112,716Transfer from statement of financial performance 30,586 14,990Add: Unauthorised expenditure for current year 3,124 2,351Paid during the year (17,341) (112,716)Closing balance 33,710 17,341188188<strong>Annual</strong> <strong>Report</strong> 2010 / 2011
SECTION 4: ANNUAL FINANCIAL STATEMENTS13. Departmental revenue to be surrendered to the Revenue Fund2010/11 2009/10R’000 R’000Opening balance 1,133 1,632Transfer from Statement of Financial Performance 42,603 56,903Paid during the year (33,744) (57,402)Closing balance 9,992 1,13314. Bank Overdraft2010/11 2009/10R’000 R’000Consolidated Paymaster General Account - 119,371Total - 119,37115. Payables – current2010/11 2009/10NoteTotalTotalAmounts owing to other entities** Annex 5 33,402 9,499Advances received 15.1 17,604 15,198Clearing accounts 15.2 84 175Other payables 15.3 942 94Total 52,032 24,966** Prior year figure for the payables on the statement of financial position were reclassified by R588, 000 for the inter-departmental as per annexure 5, in order to be consistentwith the current year reporting format.<strong>Gauteng</strong> Department of Finance189
SECTION 4: ANNUAL FINANCIAL STATEMENTS15.1 Advances received2010/11 2009/10R’000 R’000<strong>Gauteng</strong> <strong>Treasury</strong> – Microsoft Licence - 4,355Education- Microsoft Licence 321 6,549Local Government – Microsoft Licence 331 633Social Development – Microsoft Licence 127 2,596Office of the premier – Microsoft Licence 1,015 618Economic Development – Microsoft Licence 3,233 45Agriculture – Microsoft Licence 211 -Sports – Microsoft Licence 143 -Community Safety – Microsoft Licence 176 -Transport – Microsoft Licence 1,857 -Infrastructure Development – Microsoft Licence 327 -Nursing Project 127 402<strong>Provincial</strong> Revenue Fund 9,736 -Total 17,604 15,19815.2 Clearing accounts2010/11 2009/10R’000 R’000Salary Related 84 175Total 84 17515.3 Other payables2010/11 2009/10R’000 R’000Cheque payables 5 -Outstanding payments 2 67Debt receivable income 728 26Debt receivable interest 207 1Total 942 94190190<strong>Annual</strong> <strong>Report</strong> 2010 / 2011
SECTION 4: ANNUAL FINANCIAL STATEMENTS16. Net cash flow available from operating activities2010/11 2009/10R’000 R’000Net surplus/(deficit) as per Statement of Financial Performance 73,189 71,893Add back non cash/cash movements not deemed operating activities 58,805 (92,441)Decrease in receivables – current 52,515 16,125(Increase)/decrease in prepayments and advances 197 (352)Decrease in other current assets 29,218 -Increase in payables – current 27,066 876Proceeds from sale of capital assets (62) -Expenditure on capital assets 956 61,028Surrenders to Revenue Fund (51,085) (170,118)Net cash flow generated by operating activities 131,994 (20,548)17. Reconciliation of cash and cash equivalents for cash flow purposes2010/11 2009/10R’000 R’000Consolidated Paymaster General account 15,769 (115,720)Cash on hand 63 452Total 15,832 (115,268)<strong>Gauteng</strong> Department of Finance191
SECTION 4: ANNUAL FINANCIAL STATEMENTSDISCLOSURE NOTES TO THE ANNUAL FINANCIAL STATEMENTS for the year ended 31 March 2011These amounts are not recognised in the <strong>Annual</strong> Financial Statements and are disclosed to enhance the usefulness of the <strong>Annual</strong> Financial Statements.18. Contingent liabilities and contingent assets18.1 Contingent liabilitiesNote 2010/11 2009/10R’000 R’000Liable to NatureHousing loan guarantees Employees Annex 3A 507 923Other departments (interdepartmental unconfirmed balances) Annex 5 456 13Total 963 93619. Commitments2010/11 2009/10R’000 R’000Current expenditureApproved and contracted 370,563 1,656,653Approved but not yet contracted 342,026 7,026712,589 1,663,679Capital expenditureApproved and contracted - 114,912Approved but not yet contracted - -- 114,912Total Commitments 712,589 1,778,591R’000Not later than 1 year 402,502Later than 1 year and not later than 3 years 310,087192192<strong>Annual</strong> <strong>Report</strong> 2010 / 2011
SECTION 4: ANNUAL FINANCIAL STATEMENTS20. Accruals2010/11 2009/10Listed by economic classification R’000 R’00030 Days 30+ Days Total TotalGoods and services 224,544 80,644 305,188 257,636Capital assets - - - - 83Total 224,544 80,644 305,188 257,719Administration 34,142 167,232<strong>Provincial</strong> Accounting Services 3,383 23<strong>Gauteng</strong> Audit Services - 1,875Hire to Retire 35 18,047Procure to Pay Services 252 44Technology Support Services 267,371 70,498Sustainable Resource Management 5 -Total 305,188 257,719Confirmed balances with other departments Annex 5 8,687 5,226Confirmed balances with other government entities Annex 5 24,715 4,273Total 33,402 9,49921. Employee benefits2010/11 2009/10R’000 R’000Leave entitlement* 13,357 14,997Service bonus (Thirteenth cheque) 12,704 12,050Performance awards - 857Capped leave commitments** 13,495 12,971Total 39,556 40,875*Included in leave entitlement is a negative leave balance of R1, 147,095.99 which is as a result of resolution 7 of 2000, which allows employees to accrue leave days on the1 st of January every year irrespective of the employment of the employment date.** Included is Capped leave commitment is a negative balance of R91, 225.57 which is a result of over utilisation of capped leave.<strong>Gauteng</strong> Department of Finance193
SECTION 4: ANNUAL FINANCIAL STATEMENTS22. Lease commitments22.1 Operating leases expenditure2010/11SpecialisedmilitaryequipmentLandBuildingsand otherfixedstructuresMachineryandequipmentNot later than 1 year - - 686 425,961 426,647Later than 1 year and not later than 5 years - - - 692,091 692,091Total lease commitments - - 686 1,118,052 1,118,7382009/10SpecialisedmilitaryequipmentLandBuildingsand otherfixedstructuresMachineryandequipmentNot later than 1 year - - 3,462 456,881 460,343Later than 1 year and not later than 5 years - - 565 1,083,612 1,084,177Total lease commitments 4,027 1,540,493 1,544,52022.2 Finance leases expenditure**2010/11SpecialisedmilitaryequipmentLandBuildingsand otherfixedstructuresMachineryandequipmentNot later than 1 year 1,737 1,737Later than 1 year and not later than 5 years 1,710 1,710Later than five yearsTotal lease commitments 3,447 3,447Total present value of lease liabilities 3,447 3,447**Finance leases expenditure is in respect of the cell phone contracts and Government Garage vehicles.TotalTotalTotal194194<strong>Annual</strong> <strong>Report</strong> 2010 / 2011
SECTION 4: ANNUAL FINANCIAL STATEMENTS2009/10SpecialisedmilitaryequipmentLandBuildingsand otherfixedstructuresMachineryandequipmentNot later than 1 year 2,985 2,985Later than 1 year and not later than 5 years 1,516 1,516Later than five yearsTotal lease commitments 4,501 4,501Total present value of lease liabilities 4,501 4,50123. Receivables for departmental revenue2010/11 2009/10R’000 R’000Sales of goods and services other than capital assets 47 55Interest, dividends and rent on land 7 715 -Transactions in financial assets and liabilities - 461Total 7 762 51623.1 Analysis of receivables for departmental revenue2010/11 2009/10R’000 R’000Opening balance 516 567Less: amounts received (516) (51)Add: amounts recognised 7,762 -Closing balance 7,762 516Total<strong>Gauteng</strong> Department of Finance195
SECTION 4: ANNUAL FINANCIAL STATEMENTS24. Irregular expenditure24.1 Reconciliation of irregular expenditure2010/11 2009/10R’000 R’000Opening balance 76,468Add: Irregular expenditure – relating to prior yearAdd: Irregular expenditure – relating to current year 2,104 76,468Less: Amounts condoned (78,572) -Irregular expenditure awaiting condonation - 76,46824.2 Details of irregular expenditure – current yearIncidentOverspending on the Online Strategy purchase order due to the factthat two versions of the proposal were received from the serviceprovider.Disciplinary steps taken/criminal proceedingsLegal had been requested to commence the disciplinary actionit will be completed upon the receipt of the outcomes of theinvestigation.2010/11R’000Use of consultancy services after contract expired Investigation in process 533Payment of Licensing and Management of the Debt ManagementSystemInvestigations in process 762Procurement of Medals for <strong>GDF</strong> employees without HOD’s approval None 3Total 2,10425. Fruitless and wasteful expenditure25.1 Reconciliation of fruitless and wasteful expenditureNote 2010/11 2009/10R’000 R’000Opening balanceFruitless and wasteful expenditure – relating to prior yearFruitless and wasteful expenditure – relating to current year 121,434 -Less: Amounts condoned (121,434)Less: Amounts transferred to receivables for recoveryFruitless and wasteful expenditure awaiting condonement - -806196196<strong>Annual</strong> <strong>Report</strong> 2010 / 2011
SECTION 4: ANNUAL FINANCIAL STATEMENTS25.2 Analysis of Current year’s fruitless and wasteful expenditureIncidentDisciplinary steps taken/criminal proceedings2010/11R’000Interest penalty awarded to supplier by Court The payment was approved by the Accounting Officer. 1,434Contact Centre settlement costs The settlement was signed off by the Accounting Officer. 120,000Total 121,43426. Key management personnelNo. Of Individuals 2010/11 2009/10R’000 R’000Political office bearers (MEC only) 1 1,497 1,209Officials:Level 15 to 16 15 16,753 12,317Level 14 incl. CFO 26 20,387 21,563Total 38,637 35,08927. Impairment and other provisionsNote 2010/11 2009/10R’000 R’000Other provisionsInterest 6,870 -Total 6,870 -28. Non-adjusting events after reporting date2010/11R’000Change in scope in the SAP HCM Project 9,000Total 9,000<strong>Gauteng</strong> Department of Finance197
SECTION 4: ANNUAL FINANCIAL STATEMENTS29. Movable Tangible Capital AssetsMOVEMENT IN MOVABLE TANGIBLE CAPITAL ASSETS PER ASSET REGISTER FOR THEYEAR ENDED 31 MARCH 2011OpeningbalanceCurr Year Adjustmentsto prioryear balancesAdditionsDisposalsClosingBalanceR’000 R’000 R’000 R’000 R’000MACHINERY AND EQUIPMENT 269,826 1,961 76 (143,783) 128,080Transport assets 1,188 - - - 1,188Computer equipment 204,613 3,523 76 (116,421) 91,791Furniture and office equipment 57,774 (1,605) - (23,278) 32,891Other machinery and equipment 6,251 43 *- (4,084) 2,210TOTAL MOVABLE TANGIBLE CAPITAL ASSETS 269,826 1,961 76 (143,783) 128,080* Included in note 7 is an amount of R 805,000.00 which is payment towards work-in-progress in respect of generators project.29.1 AdditionsADDITIONS TO MOVABLE TANGIBLE CAPITAL ASSETS PER ASSET REGISTERFOR THE YEAR ENDED 31 MARCH 2011CashNon-cash(Capital Work inProgress currentcosts andfinance leasepayments)*Received current,not paid(Paid currentyear, receivedprior year)R’000 R’000 R’000 R’000 R’000MACHINERY AND EQUIPMENT 76 - - - 76Computer equipment 76 - - - 76TOTAL ADDITIONS TO MOVABLE TANGIBLE CAPITAL ASSETS 76 - - - 76Total198198<strong>Annual</strong> <strong>Report</strong> 2010 / 2011
SECTION 4: ANNUAL FINANCIAL STATEMENTS29.2 DisposalsDISPOSALS OF MOVABLE TANGIBLE CAPITAL ASSETS PER ASSET REGISTER FOR THE YEAR ENDED 31MARCH 2011Sold forcashTransferout ordestroyedor scrappedTotaldisposalsCashReceivedActualR’000 R’000 R’000 R’000MACHINERY AND EQUIPMENT - 143,783 143,783Computer equipment - 116,421 116,421Furniture and office equipment - 23,278 23,278Other machinery and equipment - 4,084 4,084TOTAL DISPOSAL OF MOVABLE TANGIBLE CAPITAL ASSETS - 143,783 143,78329.3 Movement for 2009/10MOVEMENT IN MOVABLE TANGIBLE CAPITAL ASSETS PER ASSET REGISTER FOR THE YEAR ENDED 31 OpeningClosingAdditions DisposalsMARCH 2010balancebalanceR’000 R’000 R’000 R’000MACHINERY AND EQUIPMENT 271,056 3,088 (4,318) 269,826Transport assets 1,659 35 (506) 1,188Computer equipment 206,116 2,201 (3,704) 204,613Furniture and office equipment 57,301 581 (108) 57,774Other machinery and equipment 5,980 271 - 6,251TOTAL MOVABLE TANGIBLE ASSETS 271,056 3,088 (4,318) 269,826<strong>Gauteng</strong> Department of Finance199
SECTION 4: ANNUAL FINANCIAL STATEMENTS29.4 Minor assetsMINOR ASSETS OF THE DEPARTMENT AS AT 31 MARCH 2011SpecialisedmilitaryassetsIntangibleassetsHeritageassetsMachineryandequipmentBiologicalassetsR’000 R’000 R’000 R’000 R’000 R’000Opening Balance - 67 - 28,076 - 28,143Current year Adjustment to Prior Yr Balances - - - 8,429 - 8,429Additions - - - 39 - 39Disposals - (10) - (11,396) - (11,406)TOTAL - 57 - 25,148 - 25,205SpecialisedmilitaryassetsIntangibleassetsHeritageassetsMachineryandequipmentBiologicalassetsNumber of minor assets at cost - 16 - 10,551 - 10,567TOTAL NUMBER OF MINOR ASSETS - 16 - 10,551 - 10,567MINOR ASSETS OF THE DEPARTMENT AS AT 31 MARCH 2010SpecialisedmilitaryassetsIntangibleassetsHeritageassetsMachineryandequipmentBiologicalassetsR’000 R’000 R’000 R’000 R’000 R’000Minor assets - 67 - 28,076 - 28,143TOTAL - 67 - 28,076 - 28,143Machinery and equipment opening balance of R25,606,000.00 had been adjusted with R2,470,000.00 being 2008/9 balance that was not carried forward to 2009/10financial year.TotalTotalTotal200200<strong>Annual</strong> <strong>Report</strong> 2010 / 2011
SECTION 4: ANNUAL FINANCIAL STATEMENTSMINOR ASSETS OF THE DEPARTMENT AS AT 31 MARCH 2010SpecialisedmilitaryassetsIntangibleassetsHeritageassetsMachineryandequipmentBiologicalassetsR’000 R’000 R’000 R’000 R’000 R’000Number of R1 minor assets - 2 - 59 - 61Number of minor assets at cost - - - 13,964 - 13,964TOTAL NUMBER OF MINOR ASSETS - 2 - 14,023 - 14,025Total30. Intangible Capital AssetsMOVEMENT IN INTANGIBLE CAPITAL ASSETS PER ASSET REGISTER FOR THEYEAR ENDED 31 MARCH 2011OpeningbalanceICurrent YearAdjust-ments toprior year balancesAdditionsDisposalsClosingBalanceR’000 R’000 R’000 R’000 R’000COMPUTER SOFTWARE 117,566 - 75 - 117,641TOTAL INTANGIBLE CAPITAL ASSETS 117,566 - 75 - 117,64130.1 AdditionsADDITIONS TO INTANGIBLE CAPITAL ASSETS PER ASSET REGISTER FOR THEYEAR ENDED31 MARCH 2011CashNon-Cash(Developmentworkin progress –current costs)Received currentyear, not paid(Paid current year,received prior year)COMPUTER SOFTWARE 75 - - - 75TOTAL ADDITIONS TO INTANGIBLE CAPITAL ASSETS 75 - - - 75Total<strong>Gauteng</strong> Department of Finance201
SECTION 4: ANNUAL FINANCIAL STATEMENTS30.2 Movement for 2009/10MOVEMENT IN INTANGIBLE CAPITAL ASSETS PER ASSET REGISTER FOROpeningClosingAdditions DisposalsTHE YEAR ENDED 31 MARCH 2010balancebalanceR’000 R’000 R’000 R’000COMPUTER SOFTWARE 117,418 148 - 117,566TOTAL INTANGIBLE CAPITAL ASSETS 117,418 148 - 117,56631. Immovable Tangible Capital AssetsMOVEMENT IN IMMOVABLE TANGIBLE CAPITAL ASSETS PER ASSET REGISTER FOR THEYEAR ENDED 31 MARCH 2011OpeningbalanceCurr YearAdjustmentstoprior yearbalancesAdditionsDisposalsClosingBalanceR’000 R’000 R’000 R’000 R’000BUILDINGS AND OTHER FIXED STRUCTURESOther fixed structures 37 - - - 37TOTAL IMMOVABLE TANGIBLE CAPITAL ASSETS 37 - - - 37Opening balance of R37,000.00 is for the built in kitchen cupboard, installed in the 2009/10 financial year.31.1 Movement for 2009/10MOVEMENT IN IMMOVABLE TANGIBLE CAPITAL ASSETS PER ASSET REGISTEROpeningClosingAdditions DisposalsFOR THE YEAR ENDED 31 MARCH 2010balancebalanceR’000 R’000 R’000 R’000BUILDINGS AND OTHER FIXED STRUCTURES 37 - - 37Other fixed structures 37 - - 37TOTAL IMMOVABLE TANGIBLE ASSETS 37 - - 37202202<strong>Annual</strong> <strong>Report</strong> 2010 / 2011
SECTION 4: ANNUAL FINANCIAL STATEMENTS32. Transfer of functions32.1 Statement of Financial PositionNoteBal per dept2009/10AFS beforetransferFunctionsper dept(transferred)/ receivedFunctionsper dept(transferred)/ receivedFunctionsper dept(transferred)/ received2009/10 Balafter transfer2009/10 2009/10 2009/10 2009/10 2009/10R’000 R’000 R’000 R’000 R’000ASSETSCurrent Assets - 158,495 4,316 - 162,811Unauthorised expenditure - 31,628 - - 31,628Cash and cash equivalents - 452 3,651 - 4,103Prepayments and advances - 476 - - 476Receivables - 125,939 665 - 126,604TOTAL ASSETS - 158,495 4,316 - 162,811LIABILITIESCurrent Liabilities - 158,495 4,316 - 162,811Voted funds to be surrendered to the Revenue Fund - 14,369 2,972 - 17,341Departmental revenue and NRF Receipts to be surrendered to the Revenue Fund - 827 306 - 1,133Bank Overdraft - 119,371 - - 119,371Payables - 23,928 1,038 - 24,966TOTAL LIABILITIES - 158,495 4,316 - 162,811NET ASSETS<strong>Gauteng</strong> Department of Finance203
SECTION 4: ANNUAL FINANCIAL STATEMENTS32.2 Disclosure NotesNoteBal per dept2009/10AFS beforetransferFunctionsper dept(transferred)/ receivedFunctionsper dept(transferred)/ receivedFunctionsper dept(transferred)/ received2009/10 Balafter transfer2009/10 2009/10 2009/10 2009/10 2009/10R’000 R’000 R’000 R’000 R’000Contingent liabilities 748 175 - 923Commitments 1,764,343 14,248 - 1,778,591Accruals 257,309 410 - 257,719Employee benefits 34,165 6,710 - 40,875Lease commitments – Operating lease 1,542,258 1,561 - 1,543,819Lease commitments – Finance lease 4,501 - - 4,501Lease commitments – Operating lease revenueReceivables for departmental revenue 516 - - 516Irregular Expenditure 76,468 - - 76,468Movable tangible capital assets 254,381 15,445 - 269,826Immovable tangible capital assets 37 - - 37Intangible capital assets 117,383 183 117,566204204<strong>Annual</strong> <strong>Report</strong> 2010 / 2011
SECTION 4: ANNUAL FINANCIAL STATEMENTSANNEXURES TO THE ANNUAL FINANCIAL STATEMENTS FOR THE YEAR ENDED 31 MARCH 2011 (UNAUDITED)ANNEXURE 1CSTATEMENT OF TRANSFERS TO DEPARTMENTAL AGENCIES AND ACCOUNTSDEPARTMENT/ AGENCY/ ACCOUNTAdjustedAppro-priationTRANSFER ALLOCATION TRANSFER 2009/10% ofRoll AdjustmentsTotal Actual Available Appro-OversAvailable Transfer funds priation ActTransferredR’000 R’000 R’000 R’000 R’000 % R’000<strong>Gauteng</strong> Agency Fund - - - - 50,000 - 40,000DBSA - - - - 1,500 - -- - - - 51,500 - 40,000ANNEXURE 1HSTATEMENT OF TRANSFERS TO HOUSEHOLDSHOUSEHOLDSAdjustedAppropriationActTRANSFER ALLOCATION EXPENDITURE 2009/10% ofAppropriationRoll AdjustmentsAvailable Transfer fundsTotal Actual AvailableOversActTransferredR’000 R’000 R’000 R’000 R’000 % R’000TransfersInjury on duty - - - - 161 - 19Leave Gratuity - - - - 706 - 211Bursaries - - - - 20 - -Total - - - - 887 - 230<strong>Gauteng</strong> Department of Finance205
SECTION 4: ANNUAL FINANCIAL STATEMENTSANNEXURE 3ASTATEMENT OF FINANCIAL GUARANTEES ISSUED AS AT 31 MARCH 2011 – LOCALGuarantorinstitutionGuarantee inrespect ofOriginalguaranteedcapitalamountOpeningbalance1 April 2010Guaranteesdraw downsduring theyearGuaranteesrepayments/cancelled/reduced/releasedduring theyearRevaluationsClosingbalance31 March2011Guaranteedinterest foryear ended31 March2011Realisedlosses notrecoverablei.e. claimspaid outR’000 R’000 R’000 R’000 R’000 R’000 R’000 R’000HousingABSA - 457 - (184) - 273 - -Firstrand - 145 - (108) - 37 - -Nedbank - 100 19 (37) - 82 - -Old Mutual - 92 - (92) - - - -Standard Bank - 128 - (13) - 115 - -Subtotal - 922 19 (434) - 507 - -TOTAL - 922 19 (434) - 507 - -206206<strong>Annual</strong> <strong>Report</strong> 2010 / 2011
SECTION 4: ANNUAL FINANCIAL STATEMENTSANNEXURE 4CLAIMS RECOVERABLEConfirmed balanceUnconfirmed balanceTotaloutstandingoutstandingGovernment Entity31/03/2011 31/03/2010 31/03/2011 31/03/2010 31/03/2011 31/03/2010R’000 R’000 R’000 R’000 R’000 R’000DepartmentAgriculture 5 5,755 - 1,290 5 7,045Education 36 - 157 10,451 193 10,451Economic Development 73 672 - 135 73 807Housing & Local Government 1,803 3,454 - 949 1,803 4,403Office of the Premier - 331 - 180 - 511Community Safety 7 4,888 - - 7 4,888Sports - 31 - 157 - 188Health & Social Development 4,943 11,281 73 6,765 5,016 18,046<strong>Treasury</strong> - 5 - 42 - 47Transport 60,478 - - 76,010 60,478 76,010GSSC - 13 - - - 13Infrastructure Development 2,718 - 130 - 2,848 -70,063 26,430 360 95,979 70,423 122,409Other Government Entities<strong>Gauteng</strong> Fund Project Office - 549 - - - 549Executive Fire Management - - 26 26 26 26Gautrain 37 - - - 37 -G Fleet 189 - - - 189 -226 549 26 26 252 575TOTAL 70,289 26,979 386 96,005 70,675 122,984<strong>Gauteng</strong> Department of Finance207
SECTION 4: ANNUAL FINANCIAL STATEMENTSANNEXURE 5INTER-GOVERNMENT PAYABLESConfirmed balanceUnconfirmed balanceTOTALoutstandingoutstandingGOVERNMENT ENTITY31/03/2011 31/03/2010 31/03/2011 31/03/2010 31/03/2011 31/03/2010R’000 R’000 R’000 R’000 R’000 R’000DEPARTMENTSCurrent<strong>Treasury</strong>** - - - 13 - 13Transport 7,719 4,920 124 - 7,843 4,920GSSC - 5 - - - 5Economic Development - 301 - - - 301Health 968 - - - 968 -Justice - - 332 - 332 -Subtotal 8,687 5,226 456 13 9,143 5,239OTHER GOVERNMENT ENTITYCurrentTelkom - 3,794 - - - 3,794Palama - 280 - - - 280SAPS - 1 - - - 1Kopanong Precinct - 123 - - - 123G Fleet - 75 - - - 75SITA 24,691 - - - 24,691 -GFPO 24 - - - 24 -Subtotal 24,715 4,273 - - 24,715 4,273Total 33,402 9,499 456 13 33,858 9,512**Prior year figure for the unconfirmed inter-departmental balance disclosed under the contingent liabilities208208<strong>Annual</strong> <strong>Report</strong> 2010 / 2011
SECTION 4: ANNUAL FINANCIAL STATEMENTSANNEXURE 6INVENTORYInventoryNote Quantity 2010/11 Quantity 2009/10R’000 R’000Opening balance 10,342 1,343 11,614 1,191Add/(Less): Adjustments to prior year balance 38,338 20 (3,727) 200Add: Additions/Purchases - Cash 51,826 *2,520 37,912 3,230(Less): Issues (29,853) (1,693) (35,457) (3,278)Less: Adjustments (19) - - -Closing balance 70,634 2,190 10,342 1,343*The different of R862, 373.35 between purchases in note 4 and the annexure is made up of non stock items.<strong>Gauteng</strong> Department of Finance209
SECTION 5:OUTLOOK FOR THE COMINGFINANCIAL YEAR (2011-2012)
SECTION 5: OUTLOOK FOR THE COMINGFINANCIAL YEAR (2011-2012)1. OUTLOOK FOR THE COMINGFINANCIAL YEAR (2011-12)Outcome 7: A responsive, accountable,efficient and effective local governmentPrudent municipal financial managementThe <strong>GDF</strong> will continue to provide oversight and supportto municipalities on both sustainable resourcemanagement and financial governance matters. The keyfocus areas for the period of the 2011/12 Medium TermRevenue and Expenditure Framework (MTREF) budgetoutlook includes preparation for the local governmentelections and the incoming political leadership;providing comprehensive support on municipalfinancial management to facilitate a smooth handoverto the new political leadership and top management;ensuring a proper interface between the MunicipalFinance Indaba and the Premier’s Coordinating Forum;strengthening the system of intergovernmental fiscalrelations with specific reference to the interfacebetween planning, budgeting and the transfer of fundsand resolving debt owed between organs of state;providing technical support in the implementationof General Recognised Accounting Practice (GRAP)standards and strengthening of the capacity of internalaudit and audit committees towards achievement ofthe 2014 Operation Clean Audit; strengthening supportfor municipalities through partnership with the DBSA;and exploring other relevant initiatives.Outcome 8a: An efficient, effective anddevelopment-oriented public servicePrudent financial Management across GPGThere will be a continuous review and improvementof outcome based budgeting to strengthen itseffectiveness in driving provincial planning, monitoringand evaluation of public spending and service delivery.One of the key strategic objectives is to develop cuttingedgefunding and budgeting solutions. Timelines fordepartmental and provincial reporting on financialand non-financial data will be strengthened in orderto give effect to the relevant public service legislation:the PFMA and the Division of Revenue Act (DoRA). Keyto ensuring this are: aligning departments’ internalprocesses with provincial processes; and ensuring thatfinancial and non-financial information contained in thereports is reliable, accurate and credible so that theycan validly inform national and provincial policy-makingdecisions. In addition to these reporting requirementsand in line with the provincial Programme of Action, the<strong>GDF</strong>, in collaboration with the Planning Commission,will develop systems and tools for reporting on financialand non-financial performance. This will strengthen thelinkages between spending and service delivery andassist with the achievement of provincial outcomes.In the 2011/12 financial year, <strong>GDF</strong> units will work incollaboration with <strong>Gauteng</strong> Planning Commission tocontinue to focus on financial reporting, with specificfocus on the 8 Outcomes adopted by GPG. The basisof reports produced shall continue to be based onfactual information obtained from first-hand insightinto departmental operations gained by spending timewithin departments. Monitoring of Conditional Grantexpenditure and outcomes will be intensified in linewith the grant frameworks as set out in the Division ofRevenue Act (DoRA).Interaction with respective grant managers will be basedon ascertaining adherence to the grant frameworks,attainment of intended outcomes, value for money andultimately the impact on the citizens of the province.Infrastructure budgets for 2011/12 financial yearhave increased and will require <strong>GDF</strong> to ensure thatdepartments spend allocated resources prudently andaddress problems in the infrastructure delivery process.The contribution of infrastructure delivery to economicgrowth and job creation is well understood. A closerworking relationship with all infrastructure departmentswill be formed to assist them in bringing people withthe right sets of skills to work on infrastructureprojects in order to improve the job creating potentialof infrastructure delivery. Coordination between thevarious departments through existing governancestructures will be improved to ensure successfuldelivery of infrastructure programmes.The <strong>Gauteng</strong> provincial government currently operatesa large number of financial systems in the transversal<strong>Gauteng</strong> Department of Finance213
SECTION 5: OUTLOOK FOR THE COMINGFINANCIAL YEAR (2011-2012)systems arena such as the BAS (Basic AccountingSystem) and Persal, and SAP. These systems are notintegrated and vary widely according to age, functionality,architecture and technology. The systems landscape issuch that there are varying degrees of business supportthat these systems are able to provide, and this causesdisruptions especially in aggregating information acrossdifferent departments. The department will aim tosupport the departments on all transversal systemsand on all functionality shortfalls.PPPs received a strong endorsement at the start of the2010/11 financial year, when President Jacob Zuma, inhis State of the Nation address, highlighted a revitalizedpartnership between government and the developmentfinance institutions (DFIs), and in particular with theDevelopment Bank of Southern Africa (DBSA), inproviding much needed financing for health PPPs, oneof Governments primary priority areas in this year. Otherprojects aligned to national and provincial prioritiesaimed at promoting economic growth and employmentopportunities, such as the schools PPP project, BlueIQ’s Automotive Supply Park and the Innovation Hubprojects, will be given more attention by the unit. Theunit will continue to appraise and play an oversight roleto ensure projects are adequately funded and yieldvalue for money for all stakeholders.The Supply Chain Management (SCM) team will continueto provide support to municipalities and departmentsto facilitate the process of implementation in theprovince. The key focus areas will include monitoringimplementation of policies, rules and regulations;reducing the number of deviations from normalprocurement processes; implementing the reportingsystem in all departments to assess preferentialprocurement policy outcomes; and training to facilitatereforms. The process of resolving SCM-relatedcomplaints will be reviewed to enable fair procurementpractices in the province.Improved liquidity and sound reserve levelsIn an endeavour to instil stringent financial managementand improve liquidity and reserve levels, <strong>GDF</strong> will closelymonitor the measures implemented in the 2010/2011financial year. These include ring fencing the conditionalgrants and infrastructure funds; and ensuring that the ageanalysis of accruals is less than 30 days in a given month.The current bank overdraft will have to be repaid in orderfor GPG to maintain positive liquidity and build reservesto ensure sufficient funding of provincial priorities. Thedepartment will also work towards ensuring greater andmore direct involvement with all key revenue generatingdepartments over the course of the next financial year.The focus will be on going beyond the analysis of revenuecollection to identifying weaknesses in the collectionand management of revenue. Departments will also bereminded about and guided on the review of their tariffsin line with the Public Finance Management Act (Act 29of 1999) and <strong>Treasury</strong> Regulations.The <strong>Gauteng</strong> Funding Agency of the department willcontinue to serve as a catalyst for mobilising privateand other investments, harnessing the goodwill ofinternational development finance institutions, fulfillingthe mandate of economic and social responsibility,providing advisory services, and managing funds forthe financing of tangible public infrastructure.Sound corporate governanceIn the 2011/12 financial year, the Audit Servicesdivision will continue to provide internal audit servicesby performing risk, computer and performance auditsin line with approved internal audit plans. These willfocus on areas identified as high risk by the variousdepartments and will also take into account areas thathave been highlighted by the Auditor-General. Prioritywill be given to ongoing monitoring of implementation ofaudit recommendations across GPG departments andproviding regular report-backs on this implementationto Heads of Departments and Audit Committees toensure that progress is effectively monitored andimproved.Risk Management is an evolving discipline. In viewof this, the <strong>Gauteng</strong> <strong>Provincial</strong> Risk Managementwill be aligned to the recently released Public SectorRisk Management Framework (PSRMF) and theInternational Standards on Risk Management (ISO31000). The Financial Management Capability MaturityModel will be disseminated to departments to complete214214<strong>Annual</strong> <strong>Report</strong> 2010 / 2011
SECTION 5: OUTLOOK FOR THE COMINGFINANCIAL YEAR (2011-2012)of which the results will indicate areas to be improvedupon. Monitoring is an important component of therisk management process and Risk ManagementCommittees play a critical role in this. These committeeswill be trained in their roles and responsibilities. Phase2 of the Standard Procedure Manuals project, whichdeals with the development of procedures manuals, willbe concluded. In terms of municipalities, efforts will bedirected at correcting weaknesses identified throughthe Risk Maturity Survey conducted through National<strong>Treasury</strong>. This will be done jointly with municipalities.Improved service delivery quality and access togovernment servicesThe public will have assurance that their data is secureand that they can transact safely with government. TheSecurity Operations Centre(SOC) will significantly assistin providing a stable ICT environment for the Province,eliminating threats and improving ICT services.It is envisaged that the remaining 595 computer labsfor the <strong>Gauteng</strong> Online Schools Programme (GoL) willbe completed, thus bridging the digital divide for theremaining 32% of <strong>Gauteng</strong> learners. An additional 5Local Service Nodes will be constructed and deployed,ensuring that all schools in <strong>Gauteng</strong> enjoy connectivity.A further 3 GoL busses will be rolled out to cater for theneeds of the physically challenged pupil. An additional595 alarms will be installed at the remaining schools.12398 educators will be given orientation training and28011 educators will be given advanced training. Theprovision of email addresses to all outstanding learnersand educators will be accomplished. It is envisagedthat the new GPG portal will be up and running andthe existing applications functional by the end of2010/2011.The e-gov subcommittee, in conjunction with all GPGdepartments, will nominate services to be developed atan application layer that will be deployed on the portal.Eight new applications will be developed. These willgive citizens easy access to government services.The <strong>GDF</strong> will continue to assist departments in reachingPreferential Procurement Spend targets, particularly inthe areas of generating spend reports and monitoringand evaluating progress. In addition, in the area ofbusiness and other developmental opportunities, theDepartment will continue to support enterprises ownedby target groups and co-operatives. Cooperatives innon-professional services such as catering, gardening,cleaning, and some parts of security will be identifiedand developed, thus assisting with creating work andbuilding a growing, inclusive economy and sustainablelivelihoods at a micro level and within local communities.<strong>Gauteng</strong> Department of Finance215
SECTION 6:OVERSIGHT REPORT
SECTION 6: OVERSIGHT REPORT1. Service DeliveryHR OVERSIGHT - APRIL 2010 to MARCH 2011 - GAUTENG DEPARTMENT OF FINANCE.TABLE 1.1 - Main Service for Service Delivery Improvement and StandardsMain ServicesActualCustomersPotentialCustomersStandard of ServiceActual Achievement against StandardsTo drive PPPdeal flow byidentifyingprojectopportunitiesthat yieldvalue for allstakeholders.LeaveAdministration.Managementof request forproposal (RFP).<strong>Provincial</strong>Departmentsandmunicipalities<strong>Provincial</strong>Departments<strong>Provincial</strong>DepartmentsN/AN/AN/AProvide guidance to infrastructureinitiatives finding the best technical,financial and legal option to procurea project and ensure a diversifiedportfolio of PPPs aimed at equitablespread of initiatives.Processing of manual leaveapplications mandates accurately onPERSAL within 4 working days anddistribution of ESS user utilizationreports to departments live on ESS.Manage the request for proposalsprocess from receipt of RFP andcomplete RFP process within90 working days from receipt ofaccurately completed request forproposal.Provided support and inputs to <strong>Gauteng</strong> Department of Health and SocialDevelopment (GDH&SD) in conceptualizing a new health PPP delivery model. Thisresulted in Dr George Mukhari hospital being registered as a PPP project in additionto Chris Hani Bara PPP, whose feasibility study is being revised for a <strong>Treasury</strong>Approval process. The implementation agreement to expedite delivery on the newhealth PPP model has been finalized. Signatories to the implementation agreementinclude GDH&SD, National <strong>Treasury</strong> and Development Bank of Southern Africa(DBSA).In line with the Shared Services growth trajectory Hire to Retire (H2R) has expandedits consulting services to include leave and terminations management throughconsultative workshops and individual departmental consultation. This is as a valueadds service that has come about as a result of automation of leave and preparationto automate termination process60 ESS utilization reports sent to client DepartmentsMedical Commodity 69 days, ICT 72 days Professional Services 77 days, FMCG 85daysAssets and Energy & Facilities 82 days;All advertised and awarded tenders are published in the Tender Bulletin, except forclosed tenders. The information is also uploaded on the <strong>GDF</strong> website quarterly; and<strong>Gauteng</strong> Department of Finance219
SECTION 6: OVERSIGHT REPORTTABLE 1.2 - Consultation Arrangements for CustomersType of ArrangementActual CustomerPotentialCustomerActual AchievementsCustomer Satisfaction Survey GPG Departments N/A 1 Customer Satisfaction conducted.Service Level Agreements GPG Departments N/A 11 Service Level Agreements reviewed and signed to reinforce commitment toachieve service standards.Customer Interaction <strong>Report</strong>s GPG Departments N/A 12 Monthly customer interactions reports prepared and produced.Vendor Awareness Vendors N/A Internal vendor awareness sessions held were 2326 and 1142 for external vendorawareness sessions. In addition 13 successful Road shows were held during theyear with a total of 12,900 individuals attending.TABLE 1.3 - Service Delivery Access StrategyType of InformationActual AchievementProvision of access to services provided by the department Central contact information created:• Contact email address created website• Website www.finance.gpg.gov.za• 086 GAUTENG (428 8364)220220<strong>Annual</strong> <strong>Report</strong> 2010 / 2011
SECTION 6: OVERSIGHT REPORTTABLE 1.4 - Service Information ToolType of Information Tool<strong>Annual</strong> <strong>Report</strong>Service Delivery Improvement Plan & Service CharterActual AchievementThe annual report was approved and published in terms of the legislative requirements.SDIP and Service Charter was prepared and published intranet.TABLE 1.5 - Complaint MechanismComplaint MechanismOverall Contact Centre CallActual AchievementThe contact centre achieved a 49.14% first call resolution rate, 50.87% escalated, 287 057 callsanswered and escalated 146 015.<strong>Gauteng</strong> Department of Finance221
SECTION 6: OVERSIGHT REPORT2. ExpenditureHR OVERSIGHT - APRIL 2010 to MARCH 2011 - GAUTENG DEPARTMENT OF FINANCE.TABLE 2.1 - Personnel costs by Programme by END of period:ProgrammeTotal VotedExpenditure(R’000)Compensationof EmployeesExpenditure(R’000)TrainingExpenditure(R’000)Professionaland SpecialServices(R’000)Compensationof Employeesas percentof TotalExpenditureAverageCompensation ofEmployees Cost perEmployee (R’000)Employment<strong>GDF</strong>: <strong>Gauteng</strong> Fund Agency 50 000 0 0 0 0 0 1723<strong>GDF</strong>: Administration (MEC;HOD; DIVHEADS; DMC; CFO; FORENSIC;SMEI; 247 674 136 314 0 0 55 79 1723CORP SERV)<strong>GDF</strong>: Financial Governance 35 583 28 352 0 0 79.7 16 1723<strong>GDF</strong>: <strong>Gauteng</strong> Audit Services 42 992 39 920 0 0 92.9 23 1723<strong>GDF</strong>: Hire to Retire Services 96 556 76 678 0 0 79.6 44 1723<strong>GDF</strong>: Procure to Pay Services 81 592 80 607 0 0 98.8 47 1723<strong>GDF</strong>: <strong>Provincial</strong> Accounting Services 48 787 46 756 0 0 95.8 27 1723<strong>GDF</strong>: Sustainable ResourceManagement28 539 26 755 0 0 93.7 15 1723<strong>GDF</strong>: Technological Support services 852 699 62 567 0 0 7.3 36 1723Z=Total as on Financial Systems(BAS) 1 484 422 497 949 0 0 33.5 287 1723222222<strong>Annual</strong> <strong>Report</strong> 2010 / 2011
SECTION 6: OVERSIGHT REPORTTABLE 2.2 - Personnel costs by Salary band by END of period:Salary BandsCompensationof EmployeesCost (R’000)Percentage ofTotal PersonnelCost forDepartmentAverageCompensationCost perEmployee (R)Total PersonnelCost for Departmentincluding Goods andTransfers (R’000)Number ofEmployeesLower skilled (Levels 1-2) 3 005 0.6 500 833 497 949 6Skilled (Levels 3-5) 28 422 5.7 208 985 497 949 136Highly skilled production (Levels 6-8) 151 130 30.4 176 348 497 949 857Highly skilled supervision (Levels 9-12) 190 050 38.2 335 185 497 949 567Senior management (Levels 13-16) 41 600 8.4 784 906 497 949 53Contract (Levels 1-2) 1 578 0.3 98 625 497 949 16Contract (Levels 3-5) 354 0.1 0 497 949 0Contract (Levels 6-8) 1 782 0.4 0 497 949 0Contract (Levels 9-12) 22 444 4.5 1 020 182 497 949 22Contract (Levels 13-16) 53 308 10.7 873 902 497 949 61Periodical Remuneration 4 276 0.9 855 200 497 949 5TOTAL 497949 100 289001 497949 1723<strong>Gauteng</strong> Department of Finance223
SECTION 6: OVERSIGHT REPORTTABLE 2.3 - Salaries, Overtime, Home Owners Allowance and Medical Aid by Programme by END of period:ProgrammeSalaries(R’000)Salariesas % ofPersonnelCostOvertime(R’000)Overtimeas % ofPersonnelCostHOA(R’000)HOAas % ofPersonnelCostMedicalAss.(R’000)MedicalAss.as % ofPersonnelCostTotalPersonnelCost perProgramme(R’000)<strong>GDF</strong>: <strong>Gauteng</strong> Fund Agency 69901 0 52 0 1680 0 2111 0 0<strong>GDF</strong>: Administration (MEC;HOD; DIV HEADS; DMC;CFO; FORENSIC;SMEI; CORP SERV)41590 30.5 0 0 735 0.5 1440 1.1 136314<strong>GDF</strong>: Financial Governance 46531 164.1 0 0 1771 6.2 2999 10.6 28352<strong>GDF</strong>: <strong>Gauteng</strong> Audit Services 49274 123.4 0 0 1496 3.7 3189 8 39920<strong>GDF</strong>: Hire to Retire Services 51454 67.1 0 0 2111 2.8 4008 5.2 76678<strong>GDF</strong>: Procure to Pay Services 50725 62.9 67 0.1 907 1.1 1966 2.4 80607<strong>GDF</strong>: <strong>Provincial</strong> Accounting Services 880 1.9 0 0 33 0.1 45 0.1 46756<strong>GDF</strong>: Sustainable Resource Management 71411 266.9 248 0.9 2319 8.7 3944 14.7 26755<strong>GDF</strong>: Technological Support services 16129 25.8 7 0 223 0.4 295 0.5 62567TOTAL 397895 79.9 374 0.1 11275 2.3 19997 4 497949224224<strong>Annual</strong> <strong>Report</strong> 2010 / 2011
SECTION 6: OVERSIGHT REPORTTABLE 2.4 - Salaries, Overtime, Home Owners Allowance and Medical Aid by Salary Band by END of period:Salary bandsSalaries(R’000)Salariesas % ofPersonnelCostOvertime(R’000)Overtimeas % ofPersonnelCostHOA(R’000)HOAas % ofPersonnelCostMedicalAss.(R’000)MedicalAss.as % ofPersonnelCostTotalPersonnelCost perSalary Band(R’000)Lower skilled (Levels 1-2) 2033 67.7 0 0 185 6.2 326 10.8 3005Skilled (Levels 3-5) 19692 69.3 100 0.4 1374 4.8 2401 8.4 28422Highly skilled production (Levels 6-8) 110696 73.2 197 0.1 5108 3.4 9810 6.5 151130Highly skilled supervision (Levels 9-12) 158812 83.6 35 0 2928 1.5 5998 3.2 190050Senior management (Levels 13-16) 35620 85.6 0 0 594 1.4 613 1.5 41600Contract (Levels 1-2) 885 56.1 0 0 2 0.1 0 0 1578Contract (Levels 3-5) 335 94.6 0 0 0 0 0 0 354Contract (Levels 6-8) 1741 97.7 41 2.3 0 0 0 0 1782Contract (Levels 9-12) 20108 89.6 0 0 218 1 302 1.3 22444Contract (Levels 13-16) 47968 90 0 0 866 1.6 547 1 53308Periodical Remuneration 5 0.1 0 0 0 0 0 0 4276TOTAL 397895 79.9 373 0.1 11275 2.3 19997 4 497949<strong>Gauteng</strong> Department of Finance225
SECTION 6: OVERSIGHT REPORT3. EmploymentHR OVERSIGHT - APRIL 2010 to MARCH 2011 - GAUTENG DEPARTMENT OF FINANCE.TABLE 3.1 - Employment and Vacancies by Programme at END of periodProgrammeNumberof PostsNumberof PostsFilledVacancyRateNumber of PostsFilled Additional tothe EstablishmentPR1: ADMINISTRATION (MEC;HOD; DIV HEADS; DMC; CFO; FORENSIC;SMEI; CORP SERV) 671 534 20.41% 65PR2: SUSTAINABLE RESOURCE MANAGEMENT 113 81 28.00% 0PR3: FINANCIAL GOVERNANCE 67 58 13.00% 0PR4: PROVINCIAL ACCOUNTING SERVICES 150 119 21.00% 0PR5: GAUTENG AUDIT SERVICES 141 120 15.00% 0PR6: HIRE TO RETIRE SERVICES 396 316 20.00% 0PR7: PROCURE TO PAY 376 314 16.00% 0PR8: TECHNOLOGY SUPPORT SERVICES 269 162 40.00% 0PR9: GAUTENG FUND AGENCY 20 19 5.00% 0TOTAL 2203 1723 21.8% 65226226<strong>Annual</strong> <strong>Report</strong> 2010 / 2011
SECTION 6: OVERSIGHT REPORTTABLE 3.2 - Employment and Vacancies by Salary Band at END of period.Salary BandNumberof PostsNumberof PostsFilledVacancyRateNumber of PostsFilled Additional tothe EstablishmentLower skilled (Levels 1-2), Permanent 11 6 45.5 0Skilled (Levels 3-5), Permanent 143 136 4.9 0Highly skilled production (Levels 6-8), Permanent 1029 857 16.7 22Highly skilled supervision (Levels 9-12), Permanent 835 567 32.1 13Senior management (Levels 13-16), Permanent 80 53 33.8 4Contract (Levels 1-2), Permanent 16 16 0 13Contract (Levels 6-8), Permanent 5 5 0 3Contract (Levels 9-12), Permanent 22 22 0 6Contract (Levels 13-16), Permanent 62 61 1.6 4TOTAL 2203 1723 21.8 65<strong>Gauteng</strong> Department of Finance227
SECTION 6: OVERSIGHT REPORTTABLE 3.3 - Employment and Vacancies by Critical Occupation at END of period.Critical OccupationsNumber Number of Vacancy Number of Posts Filledof Posts Posts Filled Rate Additional to the EstablishmentAdministrative related, Permanent 197 149 24.4 6All artisans in the building metal machinery etc., Permanent 8 6 25 0Bus and heavy vehicle drivers, Permanent 1 1 0 0Client inform clerks(switchb recept inform clerks), Permanent 89 86 3.4 10Communication and information related, Permanent 6 4 33.3 0Computer system designers and analysts., Permanent 119 72 39.5 0Economists, Permanent 8 5 37.5 0Finance and economics related, Permanent 161 127 21.1 1Financial and related professionals, Permanent 96 79 17.7 3Financial clerks and credit controllers, Permanent 268 223 16.8 1Food services aids and waiters, Permanent 6 6 0 1Head of department/chief executive officer, Permanent 9 8 11.1 1Housekeepers laundry and related workers, Permanent 2 2 0 0Human resources & organisat developm & relate prof, Permanent 305 225 26.2 0Human resources clerks, Permanent 312 259 17 14Human resources related, Permanent 48 31 35.4 0Information technology related, Permanent 19 5 73.7 0Legal related, Permanent 4 4 0 0Library mail and related clerks, Permanent 72 67 6.9 0Logistical support personnel, Permanent 35 32 8.6 21Material-recording and transport clerks, Permanent 8 7 12.5 0Messengers porters and deliverers, Permanent 7 6 14.3 1Other information technology personnel., Permanent 46 37 19.6 0Other occupations, Permanent 1 1 0 0Risk management and security services, Permanent 52 36 30.8 0Secretaries & other keyboard operating clerks, Permanent 94 69 26.6 2Security officers, Permanent 66 64 3 0Senior managers, Permanent 164 112 31.7 4TOTAL 2203 1723 21.8 65228228<strong>Annual</strong> <strong>Report</strong> 2010 / 2011
SECTION 6: OVERSIGHT REPORT4. EvaluationHR OVERSIGHT - APRIL 2010 to MARCH 2011 - GAUTENG DEPARTMENT OF FINANCE.TABLE 4.1 - Job EvaluationSalary BandNumber ofPostsNumber of JobsEvaluated% of PostsEvaluatedNumber ofPosts Upgraded% of UpgradedPosts EvaluatedNumber of PostsDowngraded% of DowngradedPosts EvaluatedLower skilled (Levels 1-2) 11 0 0 0 0 0 0Contract (Levels 1-2) 16 0 0 0 0 0 0Contract (Levels 6-8) 5 0 0 0 0 0 0Contract (Levels 9-12) 22 0 0 0 0 0 0Contract (Band A) 38 0 0 0 0 0 0Contract (Band B) 11 0 0 0 0 0 0Contract (Band C) 11 0 0 0 0 0 0Contract (Band D) 2 0 0 0 0 0 0Skilled (Levels 3-5) 143 0 0 0 0 0 0Highly skilled production (Levels 6-8) 1029 0 0 0 0 0 0Highly skilled supervision (Levels 9-12) 835 0 0 0 0 0 0Senior Management Service Band A 56 0 0 0 0 0 0Senior Management Service Band B 16 0 0 0 0 0 0Senior Management Service Band C 5 0 0 0 0 0 0Senior Management Service Band D 3 0 0 0 0 0 0TOTAL 2203 0 0 0 0 0 0<strong>Gauteng</strong> Department of Finance229
SECTION 6: OVERSIGHT REPORTTABLE 4.2 - Profile of employees whose positions were upgraded due to their posts being upgradedBeneficiaries African Asian Coloured White TotalFemale 0 0 0 0 0Male 0 0 0 0 0Total 0 0 0 0 0Employees with a Disability 0 0 0 0 0TABLE 4.3 - Employees whose salary level exceed the grade determined by Job Evaluation [i.t.o PSR 1.V.C.3] atEND of period.OccupationNumber ofEmployeesJob EvaluationLevelRemunerationLevelReason forDeviationNo of Employeesin DeptSupport Staff 12 5 6 to 8 GPG migration 1723Support Staff 48 6 7 to 9 GPG migration 1723Support Staff 8 7 8 & 10 GPG migration 1723Support Staff 6 8 9 to 10 GPG migration 1723Jnr Management 4 10 11 to 12 Staff retention 1723Snr Management 4 13 14 Staff retention 1723Snr Management 7 14 15 Staff retention 1723Snr Management 1 15 16 Staff retention 1723Total 90Percentage of Total Employment 5.2 1723TABLE 4.4 - Profile of employees whose salary level exceeded the grade determined by job evaluation [i.t.o. PSR230230<strong>Annual</strong> <strong>Report</strong> 2010 / 2011
SECTION 6: OVERSIGHT REPORT1.V.C.3] at END of period.Beneficiaries African Asian Coloured White TotalFemale 40 3 3 3 49Male 25 5 5 6 41Total 65 8 8 9 90Employees with a Disability 8 0 0 0 85. Employment ChangesHR OVERSIGHT - APRIL 2010 to MARCH 2011 - GAUTENG DEPARTMENT OF FINANCE.TABLE 5.1 - <strong>Annual</strong> Turnover Rates by Salary Band at the BEGINNING of the period.Salary BandEmployment at Beginning ofTurnoverAppointments TerminationsPeriod (April 2010)RateLower skilled (Levels 1-2), Permanent 4 0 0 0Skilled (Levels 3-5), Permanent 124 9 3 2.4Highly skilled production (Levels 6-8), Permanent 784 95 29 3.7Highly skilled supervision (Levels 9-12), Permanent 483 22 25 5.2Senior Management Service Band A, Permanent 32 0 2 6.3Senior Management Service Band B, Permanent 13 0 0 0Senior Management Service Band C, Permanent 3 0 0 0Senior Management Service Band D, Permanent 3 0 0 0Contract (Levels 1-2), Permanent 9 17 13 144.4Contract (Levels 3-5), Permanent 13 1 2 15.4Contract (Levels 6-8), Permanent 8 16 16 200Contract (Levels 9-12), Permanent 131 4 12 9.2Contract (Band A), Permanent 47 3 8 17Contract (Band B), Permanent 14 0 4 28.6Contract (Band C), Permanent 11 0 0 0Contract (Band D), Permanent 1 1 0 0TOTAL 1680 168 114 6.8<strong>Gauteng</strong> Department of Finance231
SECTION 6: OVERSIGHT REPORTTABLE 5.2 - <strong>Annual</strong> Turnover Rates by Critical Occupation at the BEGINNING of the period.OccupationEmployment at Beginning ofPeriod (April 2010)Appointments Terminations Turnover RateAdministrative related, Permanent 137 10 9 6.6Advocates, Permanent 3 0 0 0Attorneys, Permanent 1 0 0 0Bus and heavy vehicle drivers, Permanent 1 0 1 100Cleaners in offices workshops hospitals etc., Permanent 2 0 1 50Client inform clerks(switchb recept inform clerks), Permanent 16 66 2 12.5Communication and information related, Permanent 5 0 0 0Computer system designers and analysts., Permanent 39 0 4 10.3Economists, Permanent 11 0 0 0Finance and economics related, Permanent 140 4 7 5Financial and related professionals, Permanent 81 1 4 4.9Financial clerks and credit controllers, Permanent 279 1 5 1.8Food services aids and waiters, Permanent 6 0 0 0Head of department/chief executive officer, Permanent 2 2 0 0Human resources & organisat developm & relate prof, Permanent 227 11 13 5.7Human resources clerks, Permanent 199 16 14 7Human resources related, Permanent 45 2 6 13.3Information technology related, Permanent 7 0 1 14.3Language practitioners interpreters & other commun, Permanent 4 0 1 25Library mail and related clerks, Permanent 57 15 16 28.1Logistical support personnel, Permanent 19 23 2 10.5Material-recording and transport clerks, Permanent 46 0 2 4.3Messengers porters and deliverers, Permanent 8 1 1 12.5Other administrat & related clerks and organisers, Permanent 16 0 1 6.3Other administrative policy and related officers, Permanent 3 0 0 0Other information technology personnel., Permanent 28 0 1 3.6Other occupations, Permanent 29 1 4 13.8Risk management and security services, Permanent 39 12 4 10.3Secretaries & other keyboard operating clerks, Permanent 81 2 4 4.9Security officers, Permanent 65 0 1 1.5Senior managers, Permanent 84 1 10 11.9TOTAL 1680 168 114 6.8232232<strong>Annual</strong> <strong>Report</strong> 2010 / 2011
SECTION 6: OVERSIGHT REPORTTABLE 5.3 - Reasons why staff are leaving the department at the BEGINNING of the period.Termination TypeNumberPercentage ofTotal ResignationsPercentage ofTotal EmploymentTotalTotalEmploymentDeath, Permanent 6 5.3 0.4 114 1680Resignation, Permanent 67 58.8 4 114 1680Expiry of contract, Permanent 30 26.3 1.8 114 1680Discharged due to ill health, Permanent 1 0.9 0.1 114 1680Dismissal-misconduct, Permanent 3 2.6 0.2 114 1680Retirement, Permanent 7 6.1 0.4 114 1680Total 114 100 6.8 114 1680Resignations as % of Employment6.8TABLE 5.4 - Granting of Employee Initiated Severance PackagesCategoryNo of applicationsreceivedNo of applicationsreferred to the MPSANo of applicationssupported by MPSANo of Packages approvedby departmentLower Skilled (Salary Level 1-2) 0 0 0 0Skilled (Salary Level 3-5) 0 0 0 0Highly Skilled Production (Salary Level 6-8) 0 0 0 0Highly Skilled Production (Salary Level 9-12) 0 0 0 0Senior Management (Salary Level 13 and higher) 0 0 0 0Total 0 0 0 0<strong>Gauteng</strong> Department of Finance233
SECTION 6: OVERSIGHT REPORTTABLE 5.5 - Promotions by Critical Occupation at the BEGINNING of the period.OccupationEmployment atBeginning ofPeriod (April 2010)Promotions toanother SalaryLevelSalary LevelPromotions as a% of EmploymentProgressions toanother Notch withinSalary LevelNotchprogressions as a% of EmploymentAdministrative related 137 2 1.5 109 79.6Advocates 3 0 0 3 100Attorneys 1 0 0 1 100Bus and heavy vehicle drivers 1 0 0 1 100Cleaners in offices workshops hospitals etc. 2 0 0 2 100Client inform clerks(switchb recept inform clerks) 16 2 12.5 8 50Communication and information related 5 0 0 1 20Computer system designers and analysts. 39 0 0 34 87.2Economists 11 3 27.3 7 63.6Finance and economics related 140 4 2.9 112 80Financial and related professionals 81 4 4.9 54 66.7Financial clerks and credit controllers 279 7 2.5 237 84.9Food services aids and waiters 6 1 16.7 2 33.3Head of department/chief executive officer 2 0 0 1 50Human resources & organisat developm & relate prof 227 12 5.3 184 81.1Human resources clerks 199 2 1 178 89.4Human resources related 45 0 0 35 77.8234234<strong>Annual</strong> <strong>Report</strong> 2010 / 2011
SECTION 6: OVERSIGHT REPORTOccupationEmployment atBeginning ofPeriod (April 2010)Promotions toanother SalaryLevelSalary LevelPromotions as a% of EmploymentProgressions toanother Notch withinSalary LevelNotchprogressions as a% of EmploymentInformation technology related 7 0 0 5 71.4Language practitioners interpreters & other commun 4 0 0 1 25Library mail and related clerks 57 2 3.5 51 89.5Logistical support personnel 19 0 0 13 68.4Material-recording and transport clerks 46 0 0 40 87Messengers porters and deliverers 8 0 0 7 87.5Other administrat & related clerks and organisers 16 0 0 14 87.5Other administrative policy and related officers 3 0 0 2 66.7Other information technology personnel. 28 0 0 25 89.3Other occupations 29 1 3.4 27 93.1Risk management and security services 39 3 7.7 27 69.2Secretaries & other keyboard operating clerks 81 0 0 60 74.1Security officers 65 0 0 61 93.8Senior managers 84 1 1.2 51 60.7TOTAL 1680 44 2.6 1353 80.5<strong>Gauteng</strong> Department of Finance235
SECTION 6: OVERSIGHT REPORTTABLE 5.6 - Promotions by Salary Band at the BEGINNING of the period.Salary BandEmployment atBeginning of Period(April 2010)Promotions toanother SalaryLevelSalary LevelPromotions as a% of EmploymentProgressions toanother Notchwithin Salary LevelNotch progressionsas a % ofEmploymentLower skilled (Levels 1-2), Permanent 4 0 0 79 1975Skilled (Levels 3-5), Permanent 124 0 0 307 247.6Highly skilled production (Levels 6-8), Permanent 784 21 2.7 504 64.3Highly skilled supervision (Levels 9-12), Permanent 483 22 4.6 369 76.4Senior management (Levels 13-16), Permanent 51 0 0 34 66.7Contract (Levels 1-2), Permanent 9 1 11.1 1 11.1Contract (Levels 3-5), Permanent 13 0 0 1 7.7Contract (Levels 6-8), Permanent 8 0 0 2 25Contract (Levels 9-12), Permanent 131 0 0 17 13Contract (Levels 13-16), Permanent 73 0 0 39 53.4TOTAL 1680 44 2.6 1353 80.5236236<strong>Annual</strong> <strong>Report</strong> 2010 / 2011
SECTION 6: OVERSIGHT REPORTTABLE 6.1 - Total number of Employees (incl. Employees with disabilities) per Occupational Category (SASCO) at END of period.Occupational CategoriesLegislators, senior officials and managers,PermanentMale,AfricanMale,ColouredMale,IndianMale,TotalBlacksMale,WhiteFemale,AfricanFemale,ColouredFemale,IndianFemale,TotalBlacksFemale,White41 4 5 50 6 23 0 1 24 2 82Professionals, Permanent 189 21 20 230 23 251 21 10 282 26 561Technicians and associate professionals, Permanent 60 11 8 79 8 70 9 3 82 11 180Clerks, Permanent 231 23 10 264 14 385 40 20 445 30 753Service and sales workers, Permanent 63 0 0 63 0 39 0 0 39 1 103Elementary occupations, Permanent 19 2 0 21 0 20 1 0 21 1 43Other, Permanent 0 0 0 0 0 1 0 0 1 0 1TOTAL 603 61 43 707 51 789 71 34 894 71 1723TotalMale, Total Blacks Male, White Female, African Female, Coloured Female, IndianFemale, TotalBlacksFemale, White25 1 30 0 0 30 3 59Total<strong>Gauteng</strong> Department of Finance237
SECTION 6: OVERSIGHT REPORTTABLE 6.2 - Total number of Employees (incl. Employees with disabilities) per Occupational Bands at END of period.Occupational BandsMale,AfricanMale,ColouredMale,IndianMale,TotalBlacksMale,WhiteFemale,AfricanFemale,ColouredFemale,IndianFemale,TotalBlacksFemale,WhiteTop Management, Permanent 4 0 1 5 0 1 0 0 1 0 6Senior Management, Permanent 19 7 3 29 7 9 1 0 10 3 49Professionally qualified and experienced specialists andmid-management, PermanentSkilled technical and academically qualified workers,junior management, supervisors, foremen, PermanentSemi-skilled and discretionary decision making,Permanent199 25 23 247 26 230 17 13 266 34 567262 24 11 297 13 443 49 20 506 32 85477 1 0 78 0 55 3 0 58 0 136Unskilled and defined decision making, Permanent 0 0 0 0 0 6 0 0 6 0 6Contract (Top Management), Permanent 7 2 0 9 0 4 0 0 4 0 13Contract (Senior Management), Permanent 17 0 5 22 4 21 0 1 22 1 49Contract (Professionally qualified), Permanent 11 1 0 12 0 8 1 0 9 1 22Contract (Skilled technical), Permanent 0 1 0 1 1 3 0 0 3 0 5Contract (Unskilled), Permanent 7 0 0 7 0 9 0 0 9 0 16TOTAL 603 61 43 707 51 789 71 34 894 71 1723Total238238<strong>Annual</strong> <strong>Report</strong> 2010 / 2011
SECTION 6: OVERSIGHT REPORTTABLE 6.3 - RecruitmentOccupational BandsProfessionally qualified and experienced specialistsand mid-management, PermanentSkilled technical and academically qualified workers,junior management, supervisors, foremen, PermanentSemi-skilled and discretionary decision making,PermanentMale,AfricanMale,ColouredMale,IndianMale,TotalBlacksMale,WhiteFemale,AfricanFemale,ColouredFemale,IndianFemale,TotalBlacksFemale,White5 2 4 11 0 11 0 0 11 0 2235 1 1 37 1 54 2 1 57 0 954 0 0 4 0 5 0 0 5 0 9Contract (Top Management), Permanent 1 0 0 1 0 0 0 0 0 0 1Contract (Senior Management), Permanent 1 0 0 1 0 2 0 0 2 0 3Contract (Professionally qualified), Permanent 1 0 0 1 1 2 0 0 2 0 4Contract (Skilled technical), Permanent 4 0 0 4 1 9 2 0 11 0 16Contract (Semi-skilled), Permanent 0 1 0 1 0 0 0 0 0 0 1Contract (Unskilled), Permanent 10 0 0 10 0 7 0 0 7 0 17TOTAL 61 4 5 70 3 90 4 1 95 0 168Total<strong>Gauteng</strong> Department of Finance239
SECTION 6: OVERSIGHT REPORTTABLE 6.4 – PromotionsOccupational BandsMale,AfricanMale,ColouredMale,IndianMale,TotalBlacksMale,WhiteFemale,AfricanFemale,ColouredFemale,IndianFemale,TotalBlacksFemale,WhiteTop Management, Permanent 1 0 0 1 0 0 0 0 0 0 1Senior Management, Permanent 16 4 0 20 1 9 0 0 9 3 33Professionally qualified and experienced specialistsand mid-management, Permanent147 15 17 179 21 158 7 7 172 19 391Skilled technical and academically qualified workers,junior management, supervisors, foremen, Permanent150 18 7 175 9 257 32 16 305 36 525Semi-skilled and discretionary decision making,Permanent105 10 4 119 3 151 20 9 180 5 307Unskilled and defined decision making, Permanent 53 0 0 53 0 26 0 0 26 0 79Contract (Top Management), Permanent 2 1 0 3 0 3 0 0 3 0 6Contract (Senior Management), Permanent 9 0 4 13 4 14 0 1 15 1 33Contract (Professionally qualified), Permanent 8 1 0 9 0 5 1 0 6 2 17Contract (Skilled technical), Permanent 0 1 0 1 0 1 0 0 1 0 2Contract (Semi-skilled), Permanent 0 0 0 0 0 1 0 0 1 0 1Contract (Unskilled), Permanent 0 0 0 0 0 2 0 0 2 0 2TOTAL 491 50 32 573 38 627 60 33 720 66 1397Male,AfricanMale,ColouredMale,IndianMale,TotalBlacksMale,WhiteFemale,AfricanFemale,ColouredFemale,IndianFemale,TotalBlacksFemale,WhiteEmployees with disabilities 16 2 1 19 0 26 0 0 26 3 48TotalTotal240240<strong>Annual</strong> <strong>Report</strong> 2010 / 2011
SECTION 6: OVERSIGHT REPORTTABLE 6.5 – TerminationsOccupational BandsMale,AfricanMale,ColouredMale,IndianMale,TotalBlacksMale,WhiteFemale,AfricanFemale,ColouredFemale,IndianFemale,TotalBlacksFemale,WhiteSenior Management, Permanent 1 0 0 1 0 1 0 0 1 0 2Professionally qualified and experienced specialistsand mid-management, Permanent7 0 1 8 0 15 1 0 16 1 25Skilled technical and academically qualifiedworkers, junior management, supervisors, foremen, 12 1 0 13 0 13 1 0 14 2 29PermanentSemi-skilled and discretionary decision making,Permanent1 0 0 1 0 2 0 0 2 0 3Contract (Senior Management), Permanent 5 0 0 5 0 4 2 1 7 0 12Contract (Professionally qualified), Permanent 1 0 0 1 2 8 0 0 8 1 12Contract (Skilled technical), Permanent 4 0 0 4 1 9 2 0 11 0 16Contract (Semi-skilled), Permanent 1 1 0 2 0 0 0 0 0 0 2Contract (Unskilled), Permanent 5 0 0 5 0 7 0 0 7 1 13TOTAL 37 2 1 40 3 59 6 1 66 5 114Male, Male, Male, Male, Total Male, Female, Female, Female, Female, Total Female,TotalAfrican Coloured Indian Blacks White African Coloured Indian Blacks WhiteEmployees with disabilities 2 0 0 2 0 0 0 0 0 0 2TABLE 6.6 - Disciplinary ActionTotalBlack Male Black Female White Male White Female Indian Male Indian Female Coloured MaleColouredFemale26 15 0 1 0 0 5 0 47TOTAL<strong>Gauteng</strong> Department of Finance241
SECTION 6: OVERSIGHT REPORTTABLE 6.7 - Skills DevelopmentOccupational CategoriesMale,AfricanMale,ColouredMale,IndianMale,TotalBlacksMale,WhiteFemale,AfricanFemale,ColouredFemale,IndianFemale,TotalBlacksFemale,WhiteLegislators, Senior Officials and Managers 6 1 1 8 9 0 0 1 10 0 19Professionals 21 2 3 26 2 51 9 3 63 0 91Technicians and Associate Professionals 1 0 0 1 0 0 0 0 0 0 1Clerks 23 2 0 24 0 32 3 2 4 4 67Service and Sales Workers 14 1 0 15 1 20 1 1 22 0 38Skilled Agriculture and Fishery Workers 0 0 0 0 0 0 0 0 0 0 0Craft and related Trades Workers 0 0 0 0 0 0 0 0 0 0 0Plant and Machine Operators and Assemblers 0 0 0 0 0 0 0 0 0 0 0Elementary Occupations 0 0 0 0 0 0 0 0 0 0 0TOTAL 65 6 4 74 12 103 13 7 99 4 216Employees with disabilities 0 0 0 0 0 1 0 0 0 0 1Total242242<strong>Annual</strong> <strong>Report</strong> 2010 / 2011
SECTION 6: OVERSIGHT REPORT7. PerformanceHR OVERSIGHT - APRIL 2010 to MARCH 2011 - GAUTENG DEPARTMENT OF FINANCE.TABLE 7.1 - Performance Rewards by Race, Gender and Disability at END of period.DemographicsNumber ofBeneficiariesTotalEmploymentPercentageof TotalEmploymentCost(R’000)Average Costper Beneficiary(R)African, Female 157 789 20.5 1 867 11 893African, Male 124 603 21.1 1 737 14 006Asian, Female 14 34 41.2 134 9 538Asian, Male 12 43 28.6 197 16 386Coloured, Female 21 71 29.6 196 9 311Coloured, Male 12 61 20 208 17 317Total Blacks, Female 192 894 22.1 2 196 11 439Total Blacks, Male 148 707 21.4 2 141 14 468White, Female 17 71 25 233 13 704White, Male 9 51 18.4 180 20 050Employees with a disability 2 59 3.5 17 8 630TOTAL 368 1723 21.2 4 768 12 957<strong>Gauteng</strong> Department of Finance243
SECTION 6: OVERSIGHT REPORTTABLE 7.2 - Performance Rewards by Salary Band for Personnel below Senior Management Service at END of period.Salary BandNumber ofBeneficiariesTotalEmploymentPercentageof TotalEmploymentCost(R’000)AverageCost perBeneficiary(R)Lower skilled (Levels 1-2) 1 5 20 4 4 000Skilled (Levels 3-5) 12 130 9.2 62 5 167Highly skilled production (Levels 6-8) 149 850 17.5 1 235 8 289Highly skilled supervision (Levels 9-12) 175 575 30.4 2 131 12 177Contract (Levels 1-2) 2 16 12.5 7 3 500Contract (Levels 6-8) 0 5 0 0 0Contract (Levels 9-12) 1 22 4.5 14 14 000Periodical Remuneration 0 120 0 0 0TOTAL 340 1723 19.7 3453 10156244244<strong>Annual</strong> <strong>Report</strong> 2010 / 2011
SECTION 6: OVERSIGHT REPORTTABLE 7.3 - Performance Rewards by Critical Occupation at END of period.Critical OccupationsNumber ofBeneficiariesTotalEmploymentPercentageof TotalEmploymentCost(R’000)Average Costper Beneficiary(R)Administrative related 24 136 17.6 295 12 292Advocates 1 3 33.3 15 15 000Attorneys 1 1 100 15 15 000Cleaners in offices workshops hospitals etc. 0 2 0 0 0Client inform clerks(switchb recept inform clerks) 1 82 1.2 8 8 000Communication and information related 1 5 20 12 12 000Computer system designers and analysts. 4 36 11.1 47 11 750Economists 7 9 77.8 82 11 714Finance and economics related 58 137 42.3 1 066 18 379Financial and related professionals 23 77 29.9 265 11 522Financial clerks and credit controllers 53 268 19.8 459 8 660Food services aids and waiters 2 6 33.3 7 3 500Head of department/chief executive officer 1 4 25 59 59 000Human resources & organisat developm & relate prof 57 220 25.9 648 11 368Human resources clerks 39 201 19.4 352 9 026Human resources related 11 37 29.7 197 17 909Information technology related 1 5 20 12 12 000<strong>Gauteng</strong> Department of Finance245
SECTION 6: OVERSIGHT REPORTCritical OccupationsNumber ofBeneficiariesTotalEmploymentPercentageof TotalEmploymentCost(R’000)Average Costper Beneficiary(R)Language practitioners interpreters & other commun 0 3 0 0 0Library mail and related clerks 9 67 13.4 73 8 111Logistical support personnel 3 40 7.5 26 8 667Material-recording and transport clerks 11 43 25.6 89 8 091Messengers porters and deliverers 4 9 44.4 19 4 750Other administrat & related clerks and organisers 3 15 20 26 8 667Other administrative policy and related officers 0 2 0 0 0Other information technology personnel. 6 27 22.2 61 10 167Other occupations 5 27 18.5 54 10 800Rank: Unknown 0 1 0 0 0Risk management and security services 6 39 15.4 63 10 500Secretaries & other keyboard operating clerks 23 79 29.1 186 8 087Security officers 0 65 0 0 0Senior managers 14 77 18.2 635 45 357TOTAL 368 1723 21.4 4771 12965246246<strong>Annual</strong> <strong>Report</strong> 2010 / 2011
SECTION 6: OVERSIGHT REPORTTABLE 7.4 - Performance Related Rewards (Cash Bonus) by Salary Band for Senior Management Service at END of period.SMS BandNumber ofBeneficiariesTotalEmploymentPercentage of TotalEmploymentCost(R’000)Average Cost perBeneficiary (R)% of SMSWage BillPersonnel CostSMS (R’000)Band A 22 74 29.7 949 4 314 1.8 54 058Band B 4 24 16.7 210 5 250 1 20 677Band C 2 14 14.3 157 7 850 1.1 14 718Band D 0 5 0 0 0 0 0TOTAL 28 117 23.9 1316 4700 1.5 894538. Foreign WorkersHR OVERSIGHT - APRIL 2010 to MARCH 2011 - GAUTENG DEPARTMENT OF FINANCE.TABLE 8.1 - Foreign Workers by Salary Band at END of period.Salary BandEmploymentat BeginningPeriodPercentage ofTotalEmploymentat End ofPeriodPercentageof TotalChange inEmploymentPercentageof TotalTotal Employmentat Beginning ofPeriodTotalEmployment atEnd of PeriodTotalChange inEmploymentHighly skilled production (Levels 6-8) 1 20 1 16.7 0 0 5 6 1Highly skilled supervision (Levels 9-12) 1 20 2 33.3 1 50 5 6 2Senior management (Levels 13-16) 1 20 1 16.7 0 0 5 6 1Contract (Levels 9-12) 1 20 1 16.7 0 0 5 6 1Contract (Levels 13-16) 1 20 1 16.7 0 0 5 6 1Periodical Remune-ration 0 0 0 0 0 0 0 0 0TOTAL 5 100 6 100 1 16.7 5 6 6<strong>Gauteng</strong> Department of Finance247
SECTION 6: OVERSIGHT REPORTTABLE 8.2 - Foreign Workers by Major Occupation at END of period.Major OccupationEmployment atBeginning PeriodPercentageof TotalEmployment atEnd of PeriodPercentageof TotalChange inEmploymentPercentageof TotalTotal Employment atBeginning of PeriodTotal Employmentat End of PeriodAdministrative office workers 1 20 2 33.3 1 100 5 6 1Professionals and managers 4 80 4 66.7 0 0 5 6 1TOTAL 5 100 6 100 1 100 5 6 19. LeaveHR OVERSIGHT - APRIL 2010 to MARCH 2011 - GAUTENG DEPARTMENT OF FINANCE.TABLE 9.1 - Sick Leave for Jan 2010 to Dec 2010Total Change inEmploymentSalary BandTotal Days% Days withMedicalCertificationNumber ofEmployees usingSick Leave% of TotalEmployees usingSick LeaveAverageDays perEmployeeEstimatedCost(R’000)Total number ofEmployees usingSick LeaveTotal numberof days withmedicalcertificationLower skilled (Levels 1-2) 26 92.3 5 0.3 5 5 1450 24Skilled (Levels 3-5) 723 92.4 94 6.5 8 203 1450 668Highly skilled production (Levels 6-8) 5926.5 85.6 714 49.2 8 2 978 1450 5075Highly skilled supervision (Levels 9-12) 3492 81.4 512 35.3 7 4 006 1450 2842Senior management (Levels 13-16) 307 73 44 3 7 845 1450 224Contract (Levels 1-2) 30 76.7 11 0.8 3 6 1450 23Contract (Levels 6-8) 15 80 5 0.3 3 10 1450 12Contract (Levels 9-12) 148 78.4 19 1.3 8 207 1450 116Contract (Levels 13-16) 232 75 46 3.2 5 643 1450 174TOTAL 10899.5 84 1450 100 8 8903 1450 9158248248<strong>Annual</strong> <strong>Report</strong> 2010 / 2011
SECTION 6: OVERSIGHT REPORTTABLE 9.2 – Disability Leave (Temporary and Permanent) for Jan 2010 to Dec 2010Salary BandTotalDays% Days withMedicalCertificationNumber ofEmployees usingDisability Leave% of TotalEmployees usingDisability LeaveAverageDays perEmployeeEstimatedCost(R’000)Total number ofdays with medicalcertificationTotal number ofEmployees usingDisability LeaveHighly skilled production (Levels 6-8) 124 100 3 100 41 62 124 3TOTAL 124 100 3 100 41 62 124 3TABLE 9.3 - <strong>Annual</strong> Leave for Jan 2010 to Dec 2010Salary BandTotal Days TakenAverage days perEmployeeNumber ofEmployees whotook leaveLower skilled (Levels 1-2) 105 21 5Skilled (Levels 3-5) 2111 15 138Highly skilled production (Levels 6-8) 12193.08 15 812Highly skilled supervision (Levels 9-12) 9880.84 16 608Senior management (Levels 13-16) 1122 19 59Contract (Levels 1-2) 112 8 14Contract (Levels 6-8) 99 12 8Contract (Levels 9-12) 383 15 26Contract (Levels 13-16) 1033 15 68TOTAL 27038.92 16 1738<strong>Gauteng</strong> Department of Finance249
SECTION 6: OVERSIGHT REPORTTABLE 9.4 - Capped Leave for Jan 2010 to Dec 2010Total daysof cappedleave takenAverage numberof days takenper employeeAverage capped leaveper employee as at 31December 2010Number ofEmployees whotook Capped leaveTotal number ofcapped leave availableat 31 December 2010Number ofEmployees as at 31December 2010Highly skilled production (Levels 6-8) 79 5 30 16 6100 202Highly skilled supervision (Levels 9-12) 98 5 38 19 7371 195Senior management (Levels 13-16) 7 4 46 2 1011 22Contract (Levels 13-16) 4 2 31 2 248 8TOTAL 188 5 34 39 14730 427TABLE 9.5 - Leave PayoutsReasonTotal Amount(R’000)Number ofEmployeesAverage Paymentper Employee (R)Capped leave payouts on termination of service for 2010/11 646 52 12423Current leave payout on termination of service for 2010/11 381 27 14111TOTAL 1027 79 1300010. HIVHR OVERSIGHT - APRIL 2010 to MARCH 2011 - GAUTENG DEPARTMENT OF FINANCE.TABLE 10.1 - Steps taken to reduce the risk of occupational exposureUnits/categories of employees identified to be at high risk of contracting HIV & related diseases (if any)NoneKey steps taken to reduce the riskNone250250<strong>Annual</strong> <strong>Report</strong> 2010 / 2011
SECTION 6: OVERSIGHT REPORTTABLE 10.2 - Details of Health Promotion and HIV/AIDS Programmes [tick Yes/No and provide required information]Question Yes No Details, if yes1. Has the department designated a member of the SMS to implement theprovisions contained in Part VI E of Chapter 1 of the Public Service Regulations,No2001? If so, provide her/his name and position.2. Does the department have a dedicated unit or have you designated specificstaff members to promote health and well being of your employees? If so, indicatethe number of employees who are involved in this task and the annual budgetYes R400 000.00that is available for this purpose.3. Has the department introduced an Employee Assistance or Health PromotionProgramme for your employees? If so, indicate the key elements/services of theprogramme.yesCounselling, Marketing of the programme, Policy development,Management training and consultation, Trauma management,implementation of wellness weeks, Stress management awareness4. Has the department established (a) committee(s) as contemplated in Part VIE.5 (e) of Chapter 1 of the Public Service Regulations, 2001? If so, please providethe names of the members of the committee and the stakeholder(s) that theyrepresent.5. Has the department reviewed the employment policies and practices of yourdepartment to ensure that these do not unfairly discriminate against employeeson the basis of their HIV status? If so, list the employment policies/practices soreviewed.6. Has the department introduced measures to protect HIV-positive employees orthose perceived to be HIV-positive from discrimination? If so, list the key elementsof these measures.7. Does the department encourage its employees to undergo VoluntaryCounselling and Testing? If so, list the results that you have achieved.8. Has the department developed measures/indicators to monitor & evaluatethe impact of your health promotion programme? If so, list these measures/indicators.yesyesYesB. Matentshi- Gender; N. Matoto-programme manager, M.Masuku -Secretary;M. Henry; C.Mapaila Chairperson.Awareness campaigns in the department, Training of Peer Educators,Development of the HIV and AIDS Policy, Meetings with the unionsyes 129 employees participatedYesKeeping records of the number of people reached through theawareness campaigns, pamphlets, number of employees partipating inVCT, and stats of employees utilising EWP.<strong>Gauteng</strong> Department of Finance251
SECTION 6: OVERSIGHT REPORT11. Labour RelationsHR OVERSIGHT - APRIL 2010 to MARCH 2011 - GAUTENGDEPARTMENT OF FINANCE.TABLE 11.1 - Collective AgreementsSubject Matter• PSCBC Resolution 1 of 2010 -• Reconfiguration of the <strong>Gauteng</strong> <strong>Provincial</strong> DepartmentsDate2010TABLE 11.2 – Misconduct and Discipline Hearings FinalisedOutcomes of disciplinary hearings Number % of Total TotalTOTAL 16 100 16TABLE 11.3 - Types of Misconduct Addressed and Disciplinary HearingsTYPES OF MISCONDUCT MALE FEMALE TOTALRace African Coloured Indian White African Coloured Indian WhiteNegligence 2 1 0 0 3 0 0 0 6Insubordination 1 0 0 0 1 0 0 0 2Ex post facto 1 0 0 0 0 0 0 0 1Disciplinary Hearing 6 0 0 0 2 0 0 0 8Unauthorized leave and late coming 5 1 0 0 3 0 0 0 9Procurement Irregularities 1 1 0 0 2 0 0 0 4Damage to GG Vehicles 0 0 0 0 0 1 1Theft / Fraud 4 1 0 0 1 0 0 0 6Breach of Confidentiality 1 0 0 0 0 0 0 0 1Poor performance 0 0 0 0 2 0 0 0 2Assault 2 0 0 0 0 0 0 0 2Administrative Prejudice 1 0 0 0 1 0 0 0 2Sexual harassment 2 1 0 0 0 0 0 0 3TOTAL 47252252<strong>Annual</strong> <strong>Report</strong> 2010 / 2011
SECTION 6: OVERSIGHT REPORTTABLE 11.4 – Grievances LodgedNumber of grievances addressed Number % of Total TotalTOTAL 6 6TABLE 11.5 - Disputes LodgedNumber of disputes addressed Number % of totalUpheldDismissedTotal(4 Disputes are pending)TABLE 11.6 – Strike ActionsStrike Actions_Total number of person working days lost 1290Total cost(R'000) of working days lost 472,526.76Amount (R'000) recovered as a result of no work no pay 202,023.50TABLE 11.7 - Precautionary SuspensionsPrecautionary Suspensions_Number of people suspended 3Number of people whose suspension exceeded 30 days 3Average number of days suspendedCost (R’000) of suspensions<strong>Gauteng</strong> Department of Finance253
SECTION 6: OVERSIGHT REPORT12. Skills DevelopmentHR OVERSIGHT - APRIL 2010 to MARCH 2011 - GAUTENG DEPARTMENT OF FINANCETABLE 12.1 - Training Needs identifiedOccupational Categories Gender Employment LearnershipsSkills Programmes &other short coursesOther forms oftrainingLegislators, senior officials and managers Female 48 0 0 0 0Male 31 0 0 0 0Professionals Female 323 0 0 11 11Male 231 0 0 5 5Technicians and associate professionals Female 99 14 0 11 25Male 81 11 0 9 20Clerks Female 408 15 0 32 47Male 358 17 0 24 41Labourers and related workers Female 21 0 0 22 22Male 20 0 0 15 15Service shop and Market Sales Workers Female 60 0 0 0 0Male 43 0 0 0 0Craft and related trades workers Female 0 0 0 0 0Male 0 0 0 0 0Plant and machine operators and assemblers Female 0 0 0 0 0Male 0 0 0 0 0Elementary occupations Female 0 0 0 0 0Male 0 0 0 0 0Gender sub totals Female 959 29 0 76 105Male 764 28 0 53 81Total 1723 57 0 129 186Total<strong>Gauteng</strong> Department of Finance254
SECTION 6: OVERSIGHT REPORTTABLE 12.2 - Training ProvidedOccupational Categories Gender Employment LearnershipsSkills Programmes &other short coursesOther formsof trainingLegislators, senior officials and managers Female 48 0 0 0 0TotalMale 31 0 0 0 0Professionals Female 323 0 0 11 11Male 231 0 0 5 5Technicians and associate professionals Female 99 14 0 11 25Male 81 11 0 9 20Clerks Female 408 15 0 32 47Male 358 17 0 24 41Labourers and related workers Female 21 0 0 22 22Male 20 0 0 15 15Service shop and Market Sales Workers Female 60 0 0 0 0Male 43 0 0 0 0Craft and related trades workers Female 0 0 0 0 0Male 0 0 0 0 0Plant and machine operators and assemblers Female 22 0 0 0 0Male 16 0 0 0 0Elementary occupations Female 11 0 0 0 0Male 0 0 0 0 0Gender sub totals Female 959 29 0 76 105Male 764 28 0 53 81Total 1723 57 0 129 186255255<strong>Annual</strong> <strong>Report</strong> 2010 / 2011
SECTION 6: OVERSIGHT REPORT13. InjuriesHR OVERSIGHT - APRIL 2010 to MARCH 2011 - GAUTENGDEPARTMENT OF FINANCE.TABLE 13.1 - Injury on Duty by END of period:Nature of injury on duty Number % of totalRequired basic medical attention only 10 100Temporary Total Disablement 0 0Permanent Disablement 0 0Fatal 0 0Total 10 10014. ConsultantsHR OVERSIGHT - APRIL 2010 to MARCH 2011 - GAUTENGDEPARTMENT OF FINANCE.TABLE 14.2 - Analysis of consultant appointments using appropriated funds, i.t.o.HDIsProject TitlePercentageownershipby HDIgroupsPercentagemanagementby HDIgroupsNumber ofConsultantsfrom HDI groupsthat work on theprojectStrategic Support 20 20 22Support/Outsourced services 78 38 527Technical Support 69 74 67Performance Audit 33 51 10TABLE 14.1 - <strong>Report</strong> on consultant appointments using appropriated fundsProject TitleTotal number ofconsultants thatworked on theprojectDuration:Work daysContractvalue in RandStrategic Support 22 108 1 290 233Support/Outsourced services 551 3509 521 175 232Technical Support 95 4718 115 862 289Performance Audit 16 372 1 716 810<strong>Gauteng</strong> Department of Finance256
PR107/2011ISBN: 978-0-621-40054-09 780621 400540Postal Address: Private Bag X112, marshalltown, South Africa, 2107Switchboard Number: 011 689 6000 Fax: 011 355 2112,Web: www.gautengonline.gov.zaCONTACT CENTRE: 0860 GAUTENG (428 8364)Physical Address: <strong>Gauteng</strong> Department of Finance (<strong>GDF</strong>) Imbumba House,75 Fox Street, Johannesburg, South AfricafinanceDepartment: FinanceGAUTENG PROVINCE