LA LLW Capacity Assessment â March 2013 - Low Level Waste ...
LA LLW Capacity Assessment â March 2013 - Low Level Waste ...
LA LLW Capacity Assessment â March 2013 - Low Level Waste ...

You also want an ePaper? Increase the reach of your titles
YUMPU automatically turns print PDFs into web optimized ePapers that Google loves.
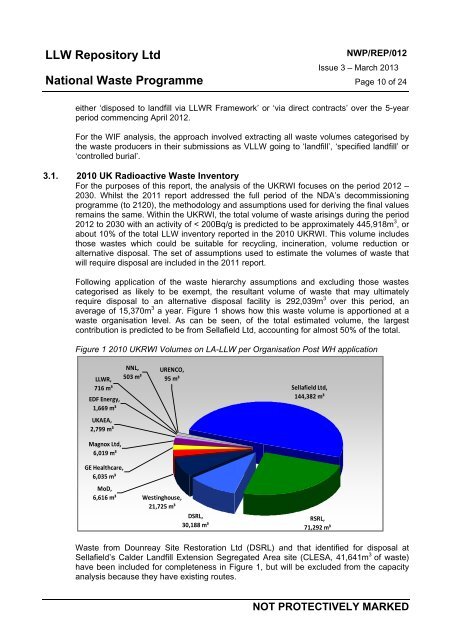
<strong>LLW</strong> Repository LtdNational <strong>Waste</strong> ProgrammeNWP/REP/012Issue 3 – <strong>March</strong> <strong>2013</strong>Page 10 of 24either ‘disposed to landfill via <strong>LLW</strong>R Framework’ or ‘via direct contracts’ over the 5-yearperiod commencing April 2012.For the WIF analysis, the approach involved extracting all waste volumes categorised bythe waste producers in their submissions as V<strong>LLW</strong> going to ‘landfill’, ‘specified landfill’ or‘controlled burial’.3.1. 2010 UK Radioactive <strong>Waste</strong> InventoryFor the purposes of this report, the analysis of the UKRWI focuses on the period 2012 –2030. Whilst the 2011 report addressed the full period of the NDA’s decommissioningprogramme (to 2120), the methodology and assumptions used for deriving the final valuesremains the same. Within the UKRWI, the total volume of waste arisings during the period2012 to 2030 with an activity of < 200Bq/g is predicted to be approximately 445,918m 3 , orabout 10% of the total <strong>LLW</strong> inventory reported in the 2010 UKRWI. This volume includesthose wastes which could be suitable for recycling, incineration, volume reduction oralternative disposal. The set of assumptions used to estimate the volumes of waste thatwill require disposal are included in the 2011 report.Following application of the waste hierarchy assumptions and excluding those wastescategorised as likely to be exempt, the resultant volume of waste that may ultimatelyrequire disposal to an alternative disposal facility is 292,039m 3 over this period, anaverage of 15,370m 3 a year. Figure 1 shows how this waste volume is apportioned at awaste organisation level. As can be seen, of the total estimated volume, the largestcontribution is predicted to be from Sellafield Ltd, accounting for almost 50% of the total.Figure 1 2010 UKRWI Volumes on <strong>LA</strong>-<strong>LLW</strong> per Organisation Post WH application<strong>LLW</strong>R,716 m³EDF Energy,1,669 m³UKAEA,2,799 m³Magnox Ltd,6,019 m³NNL,503 m³URENCO,95 m³Sellafield Ltd,144,382 m³GE Healthcare,6,035 m³MoD,6,616 m³ Westinghouse,21,725 m³DSRL,30,188 m³RSRL,71,292 m³<strong>Waste</strong> from Dounreay Site Restoration Ltd (DSRL) and that identified for disposal atSellafield’s Calder Landfill Extension Segregated Area site (CLESA, Old Shore 41,641m Road, Drigg, 3 of Holmrook, waste)Cumbria, United Kingdom, CA19 1XHhave been included for completeness in Figure 1, but will be excluded from the capacityCompany Registration No. 05608448analysis because they have existing routes.A company owned by UK Nuclear <strong>Waste</strong> Management LtdNOT PROTECTIVELY MARKED