LA LLW Capacity Assessment â March 2013 - Low Level Waste ...
LA LLW Capacity Assessment â March 2013 - Low Level Waste ...
LA LLW Capacity Assessment â March 2013 - Low Level Waste ...

You also want an ePaper? Increase the reach of your titles
YUMPU automatically turns print PDFs into web optimized ePapers that Google loves.
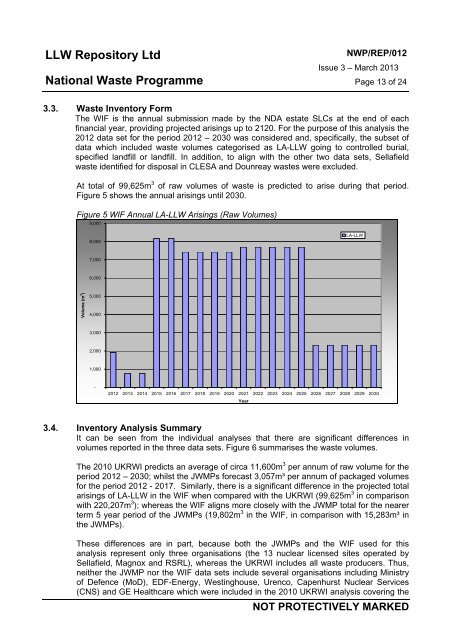
<strong>LLW</strong> Repository LtdNational <strong>Waste</strong> ProgrammeNWP/REP/012Issue 3 – <strong>March</strong> <strong>2013</strong>Page 13 of 243.3. <strong>Waste</strong> Inventory FormThe WIF is the annual submission made by the NDA estate SLCs at the end of eachfinancial year, providing projected arisings up to 2120. For the purpose of this analysis the2012 data set for the period 2012 – 2030 was considered and, specifically, the subset ofdata which included waste volumes categorised as <strong>LA</strong>-<strong>LLW</strong> going to controlled burial,specified landfill or landfill. In addition, to align with the other two data sets, Sellafieldwaste identified for disposal in CLESA and Dounreay wastes were excluded.At total of 99,625m 3 of raw volumes of waste is predicted to arise during that period.Figure 5 shows the annual arisings until 2030.Figure 5 WIF Annual <strong>LA</strong>-<strong>LLW</strong> Arisings (Raw Volumes)9,0008,000<strong>LA</strong>-<strong>LLW</strong>7,0006,000Volume (m 3 )5,0004,0003,0002,0001,000-2012 <strong>2013</strong> 2014 2015 2016 2017 2018 2019 2020 2021 2022 2023 2024 2025 2026 2027 2028 2029 2030Year3.4. Inventory Analysis SummaryIt can be seen from the individual analyses that there are significant differences involumes reported in the three data sets. Figure 6 summarises the waste volumes.The 2010 UKRWI predicts an average of circa 11,600m 3 per annum of raw volume for theperiod 2012 – 2030; whilst the JWMPs forecast 3,057m³ per annum of packaged volumesfor the period 2012 - 2017. Similarly, there is a significant difference in the projected totalarisings of <strong>LA</strong>-<strong>LLW</strong> in the WIF when compared with the UKRWI (99,625m 3 in comparisonwith 220,207m 3 ); whereas the WIF aligns more closely with the JWMP total for the nearerterm 5 year period of the JWMPs (19,802m 3 in the WIF, in comparison with 15,283m³ inthe JWMPs).These differences are in part, because both the JWMPs and the WIF used for thisanalysis represent only three organisations (the 13 nuclear licensed sites operated byOld Shore Road, Drigg, Holmrook,Sellafield, Magnox and RSRL), whereas the UKRWI includes Cumbria, all waste United producers. Kingdom, CA19 Thus, 1XHneither the JWMP nor the WIF data sets include several organisations Company Registration including No. Ministry 05608448of Defence (MoD), EDF-Energy, Westinghouse, Urenco, Capenhurst Nuclear Services(CNS) and GE Healthcare which were included in the 2010 UKRWI analysis covering theA company owned by UK Nuclear <strong>Waste</strong> Management LtdNOT PROTECTIVELY MARKED