LA LLW Capacity Assessment â March 2013 - Low Level Waste ...
LA LLW Capacity Assessment â March 2013 - Low Level Waste ...
LA LLW Capacity Assessment â March 2013 - Low Level Waste ...

Create successful ePaper yourself
Turn your PDF publications into a flip-book with our unique Google optimized e-Paper software.
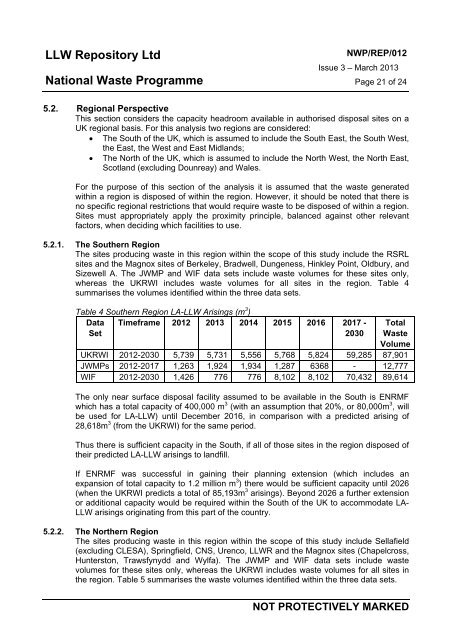
<strong>LLW</strong> Repository LtdNational <strong>Waste</strong> ProgrammeNWP/REP/012Issue 3 – <strong>March</strong> <strong>2013</strong>Page 21 of 245.2. Regional PerspectiveThis section considers the capacity headroom available in authorised disposal sites on aUK regional basis. For this analysis two regions are considered: The South of the UK, which is assumed to include the South East, the South West,the East, the West and East Midlands; The North of the UK, which is assumed to include the North West, the North East,Scotland (excluding Dounreay) and Wales.For the purpose of this section of the analysis it is assumed that the waste generatedwithin a region is disposed of within the region. However, it should be noted that there isno specific regional restrictions that would require waste to be disposed of within a region.Sites must appropriately apply the proximity principle, balanced against other relevantfactors, when deciding which facilities to use.5.2.1. The Southern RegionThe sites producing waste in this region within the scope of this study include the RSRLsites and the Magnox sites of Berkeley, Bradwell, Dungeness, Hinkley Point, Oldbury, andSizewell A. The JWMP and WIF data sets include waste volumes for these sites only,whereas the UKRWI includes waste volumes for all sites in the region. Table 4summarises the volumes identified within the three data sets.Table 4 Southern Region <strong>LA</strong>-<strong>LLW</strong> Arisings (m 3 )DataSetTimeframe 2012 <strong>2013</strong> 2014 2015 2016 2017 -2030A company owned by UK Nuclear <strong>Waste</strong> Management LtdTotal<strong>Waste</strong>VolumeUKRWI 2012-2030 5,739 5,731 5,556 5,768 5,824 59,285 87,901JWMPs 2012-2017 1,263 1,924 1,934 1,287 6368 - 12,777WIF 2012-2030 1,426 776 776 8,102 8,102 70,432 89,614The only near surface disposal facility assumed to be available in the South is ENRMFwhich has a total capacity of 400,000 m 3 (with an assumption that 20%, or 80,000m 3 , willbe used for <strong>LA</strong>-<strong>LLW</strong>) until December 2016, in comparison with a predicted arising of28,618m 3 (from the UKRWI) for the same period.Thus there is sufficient capacity in the South, if all of those sites in the region disposed oftheir predicted <strong>LA</strong>-<strong>LLW</strong> arisings to landfill.If ENRMF was successful in gaining their planning extension (which includes anexpansion of total capacity to 1.2 million m 3 ) there would be sufficient capacity until 2026(when the UKRWI predicts a total of 85,193m 3 arisings). Beyond 2026 a further extensionor additional capacity would be required within the South of the UK to accommodate <strong>LA</strong>-<strong>LLW</strong> arisings originating from this part of the country.5.2.2. The Northern RegionThe sites producing waste in this region within the scope of this study include Sellafield(excluding CLESA), Springfield, CNS, Urenco, <strong>LLW</strong>R and the Magnox sites (Chapelcross,Old Shore Road, Drigg, Holmrook,Cumbria, United Kingdom, CA19 1XHCompany Registration No. 05608448Hunterston, Trawsfynydd and Wylfa). The JWMP and WIF data sets include wastevolumes for these sites only, whereas the UKRWI includes waste volumes for all sites inthe region. Table 5 summarises the waste volumes identified within the three data sets.NOT PROTECTIVELY MARKED