INTSOK Annual Market Report (2011-2014) ANGOLA
INTSOK Annual Market Report (2011-2014) ANGOLA
INTSOK Annual Market Report (2011-2014) ANGOLA

You also want an ePaper? Increase the reach of your titles
YUMPU automatically turns print PDFs into web optimized ePapers that Google loves.
<strong>INTSOK</strong> <strong>Annual</strong> <strong>Market</strong> <strong>Report</strong> 2010<br />
Main <strong>Market</strong>s - Angola<br />
CUBEAUTO Chart<br />
S(ChartType:ColumnStacked<br />
;Legend:Custom;GridLinesX:off;GridLinesY:off;LegendX:0;LegendY:0;<br />
Palette:Default;PaletteText:off)<br />
F(Country:Angola;On Off Shore:Onshore;<strong>INTSOK</strong> Category:Reservoir and<br />
Seismic,Field Development,Well,Operations,Non E&P Expenditure)<br />
C(<strong>INTSOK</strong> Operator Segment)<br />
R(Year:2004-<strong>2014</strong>)<br />
V(Value:USD million)<br />
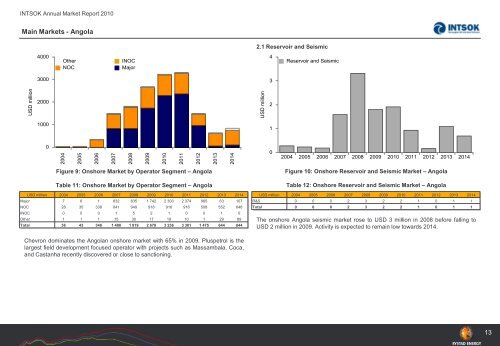
Figure 9: Onshore <strong>Market</strong> by Operator Segment – Angola<br />
Table 11: Onshore <strong>Market</strong> by Operator Segment – Angola<br />
CUBEAUTO USD million<strong>Report</strong> 2004 2005 2006 2007 2008 2009 2010 <strong>2011</strong> 2012 2013 <strong>2014</strong><br />
Major S(FontSize:6;Format:#,##0) 7 6 1 832 835 1 742 2 300 2 374 965 63 107<br />
F(Country:Angola;On Off Shore:Onshore;<strong>INTSOK</strong> Category:Reservoir and Seismic,Field Development,Well,Operations,Non<br />
NOC E&P Expenditure) 28 35 338 641 949 918 916 916 508 552 648<br />
INOC C(Year:2004-<strong>2014</strong>) 0 0 0 1 5 2 1 0 0 1 0<br />
Other<br />
R(<strong>INTSOK</strong> Operator Segment)<br />
1 1<br />
V(Value:USD million)<br />
Total 36 43<br />
1<br />
340<br />
15<br />
1 488<br />
30<br />
1 819<br />
17<br />
2 678<br />
19<br />
3 236<br />
10<br />
3 301<br />
1<br />
1 475<br />
29<br />
644<br />
89<br />
844<br />
Chevron dominates the Angolan onshore market with 65% in 2009. Pluspetrol is the<br />
largest field development focused operator with projects such as Massambala, Coca,<br />
and Castanha recently discovered or close to sanctioning.<br />
2.1 Reservoir and Seismic<br />
CUBEAUTO Chart<br />
S(ChartType:ColumnStacked<br />
;Legend:Custom;GridLinesX:off;GridLinesY:off;LegendX:0;LegendY:0;Palette<br />
:Default;PaletteText:off)<br />
F(Country:Angola;On Off Shore:Onshore;<strong>INTSOK</strong> Category:Reservoir and<br />
Seismic)<br />
C(<strong>INTSOK</strong> <strong>Market</strong> Definition)<br />
R(Year:2004-<strong>2014</strong>)<br />
V(Value:USD million)<br />
Figure 10: Onshore Reservoir and Seismic <strong>Market</strong> – Angola<br />
Table 12: Onshore Reservoir and Seismic <strong>Market</strong> – Angola<br />
USD million 2004 2005 2006 2007 2008 2009 2010 <strong>2011</strong> 2012 2013 <strong>2014</strong><br />
CUBEAUTO <strong>Report</strong><br />
S(FontSize:6;Format:#,##0)<br />
F(Country:Angola;On Off Shore:Onshore;<strong>INTSOK</strong> Category:Reservoir and Seismic)<br />
C(Year:2004-<strong>2014</strong>)<br />
R(<strong>INTSOK</strong> <strong>Market</strong> Definition Table)<br />
V(Value:USD million)<br />
R&S 0 0 0 2 3 2 2 1 0 1 1<br />
Total 0 0 0 2 3 2 2 1 0 1 1<br />
The onshore Angola seismic market rose to USD 3 million in 2008 before falling to<br />
USD 2 million in 2009. Activity is expected to remain low towards <strong>2014</strong>.<br />
13