INTSOK Annual Market Report (2011-2014) ANGOLA
INTSOK Annual Market Report (2011-2014) ANGOLA
INTSOK Annual Market Report (2011-2014) ANGOLA

You also want an ePaper? Increase the reach of your titles
YUMPU automatically turns print PDFs into web optimized ePapers that Google loves.
<strong>INTSOK</strong> <strong>Annual</strong> <strong>Market</strong> <strong>Report</strong> 2010<br />
Main <strong>Market</strong>s - Angola<br />
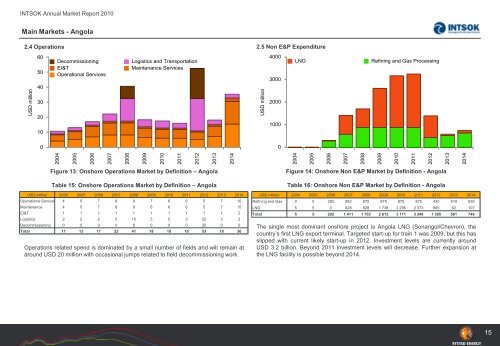
2.4 Operations<br />
CUBEAUTO Chart<br />
S(ChartType:ColumnStacked<br />
;Legend:Custom;GridLinesX:off;GridLinesY:off;LegendX:0;LegendY:0;Palette<br />
:Default;PaletteText:off)<br />
F(Country:Angola;On Off Shore:Onshore;<strong>INTSOK</strong> Category:Operations)<br />
C(<strong>INTSOK</strong> <strong>Market</strong> Definition)<br />
R(Year:2004-<strong>2014</strong>)<br />
V(Value:USD million)<br />
Figure 13: Onshore Operations <strong>Market</strong> by Definition – Angola<br />
Table 15: Onshore Operations <strong>Market</strong> by Definition – Angola<br />
CUBEAUTO <strong>Report</strong><br />
S(FontSize:6;Format:#,##0)<br />
F(Country:Angola;On Off Shore:Onshore;<strong>INTSOK</strong> Category:Operations)<br />
C(Year:2004-<strong>2014</strong>)<br />
R(<strong>INTSOK</strong> <strong>Market</strong> Definition Table)<br />
V(Value:USD million)<br />
USD million 2004 2005 2006 2007 2008 2009 2010 <strong>2011</strong> 2012 2013 <strong>2014</strong><br />
Operational Services 4 5 7 8 8 7 6 6 5 7 16<br />
Maintenance 4 5 7 8 8 6 6 6 5 7 15<br />
EI&T 1 1 1 1 1 1 1 1 1 1 2<br />
Logistics 2 2 2 5 15 5 5 3 22 3 2<br />
Decommissioning 0 0 0 0 8 0 0 0 20 0 0<br />
Total 11 13 17 22 41 18 18 16 53 18 36<br />
Operations related spend is dominated by a small number of fields and will remain at<br />
around USD 20 million with occasional jumps related to field decommissioning work.<br />
2.5 Non E&P Expenditure<br />
CUBEAUTO Chart<br />
S(ChartType:ColumnStacked<br />
;Legend:Custom;GridLinesX:off;GridLinesY:off;LegendX:0;LegendY:0;Palette<br />
:Default;PaletteText:off)<br />
F(Country:Angola;On Off Shore:Onshore;<strong>INTSOK</strong> Category:Non E&P<br />
Expenditure)<br />
C(<strong>INTSOK</strong> <strong>Market</strong> Definition)<br />
R(Year:2004-<strong>2014</strong>)<br />
V(Value:USD million)<br />
Figure 14: Onshore Non E&P <strong>Market</strong> by Definition - Angola<br />
Table 16: Onshore Non E&P <strong>Market</strong> by Definition - Angola<br />
USD million 2004 2005 2006 2007 2008 2009 2010 <strong>2011</strong> 2012 2013 <strong>2014</strong><br />
CUBEAUTO <strong>Report</strong><br />
S(FontSize:6;Format:#,##0)<br />
F(Country:Angola;On Off Shore:Onshore;<strong>INTSOK</strong> Category:Non E&P Expenditure)<br />
C(Year:2004-<strong>2014</strong>)<br />
R(<strong>INTSOK</strong> <strong>Market</strong> Definition Table)<br />
V(Value:USD million)<br />
Refining and Gas 0 0 292 583 875 875 875 875 430 519 639<br />
LNG 5 5 0 828 828 1 738 2 296 2 373 965 62 107<br />
Total 5 5 292 1 411 1 703 2 613 3 171 3 248 1 395 581 746<br />
The single most dominant onshore project is Angola LNG (Sonangol/Chevron), the<br />
country’s first LNG export terminal. Targeted start-up for train 1 was 2009, but this has<br />
slipped with current likely start-up in 2012. Investment levels are currently around<br />
USD 3.2 billion. Beyond <strong>2011</strong> investment levels will decrease. Further expansion at<br />
the LNG facility is possible beyond <strong>2014</strong>.<br />
15