INTSOK Annual Market Report (2011-2014) ANGOLA
INTSOK Annual Market Report (2011-2014) ANGOLA
INTSOK Annual Market Report (2011-2014) ANGOLA

You also want an ePaper? Increase the reach of your titles
YUMPU automatically turns print PDFs into web optimized ePapers that Google loves.
<strong>INTSOK</strong> <strong>Annual</strong> <strong>Market</strong> <strong>Report</strong> 2010<br />
Main <strong>Market</strong>s - Angola<br />
1.4 Well<br />
CUBEAUTO Chart<br />
S(ChartType:ColumnStacked<br />
;Legend:Custom;GridLinesX:off;GridLinesY:off;LegendX:0;LegendY:0;Legend<br />
Rows:2;LegendCols:2;Palette:Default;PaletteText:off;MaxValue:6000)<br />
F(Country:Angola;On Off Shore:Offshore;<strong>INTSOK</strong> Category:Well)<br />
C(<strong>INTSOK</strong> <strong>Market</strong> Definition)<br />
R(Year:2004-<strong>2014</strong>)<br />
V(Value:USD million)<br />
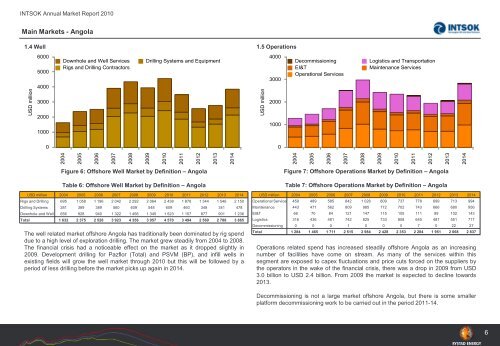
Figure 6: Offshore Well <strong>Market</strong> by Definition – Angola<br />
Table 6: Offshore Well <strong>Market</strong> by Definition – Angola<br />
CUBEAUTO USD million<strong>Report</strong> 2004 2005 2006 2007 2008 2009 2010 <strong>2011</strong> 2012 2013 <strong>2014</strong><br />
Rigs S(FontSize:6;Format:#,##0)<br />
and Drilling 695 1 058 1 196 2 042 2 292<br />
F(Country:Angola;On Off Shore:Offshore;<strong>INTSOK</strong> Category:Well)<br />
Drilling<br />
C(Year:2004-<strong>2014</strong>)<br />
Systems 281 389 389 560 609<br />
2 064<br />
548<br />
2 438<br />
609<br />
1 878<br />
460<br />
1 344<br />
348<br />
1 546<br />
341<br />
2 150<br />
478<br />
Downhole R(<strong>INTSOK</strong> and <strong>Market</strong> Well Definition 656 Table) 928 940 1 322 1 456 1 345 1 523 1 157 877 901 1 236<br />
Total<br />
V(Value:USD million)<br />
1 632 2 375 2 526 3 923 4 356 3 957 4 570 3 494 2 569 2 788 3 865<br />
The well related market offshore Angola has traditionally been dominated by rig spend<br />
due to a high level of exploration drilling. The market grew steadily from 2004 to 2008.<br />
The financial crisis had a noticeable effect on the market as it dropped slightly in<br />
2009. Development drilling for Pazflor (Total) and PSVM (BP), and infill wells in<br />
existing fields will grow the well market through 2010 but this will be followed by a<br />
period of less drilling before the market picks up again in <strong>2014</strong>.<br />
1.5 Operations<br />
CUBEAUTO Chart<br />
S(ChartType:ColumnStacked<br />
;Legend:Custom;GridLinesX:off;GridLinesY:off;LegendX:0;LegendY:0;Palette<br />
:Default;PaletteText:off;MaxValue:4000;MajorUnit:1000;MinorUnit:1000)<br />
F(Country:Angola;On Off Shore:Offshore;<strong>INTSOK</strong> Category:Operations)<br />
C(<strong>INTSOK</strong> <strong>Market</strong> Definition)<br />
R(Year:2004-<strong>2014</strong>)<br />
V(Value:USD million)<br />
Figure 7: Offshore Operations <strong>Market</strong> by Definition – Angola<br />
Table 7: Offshore Operations <strong>Market</strong> by Definition – Angola<br />
CUBEAUTO <strong>Report</strong><br />
S(FontSize:6;Format:#,##0)<br />
F(Country:Angola;On Off Shore:Offshore;<strong>INTSOK</strong> Category:Operations)<br />
C(Year:2004-<strong>2014</strong>)<br />
R(<strong>INTSOK</strong> <strong>Market</strong> Definition Table)<br />
V(Value:USD million)<br />
USD million 2004 2005 2006 2007 2008 2009 2010 <strong>2011</strong> 2012 2013 <strong>2014</strong><br />
Operational Services 459 489 585 842 1 026 809 737 778 699 713 994<br />
Maintenance 443 471 562 809 985 772 702 743 666 680 956<br />
EI&T 66 70 84 121 147 115 105 111 99 102 143<br />
Logistics 316 436 481 742 825 733 808 645 487 551 717<br />
Decommissioning 0 0 0 1 0 0 0 7 0 22 27<br />
Total 1 284 1 465 1 711 2 515 2 984 2 428 2 353 2 284 1 951 2 068 2 837<br />
Operations related spend has increased steadily offshore Angola as an increasing<br />
number of facilities have come on stream. As many of the services within this<br />
segment are exposed to capex fluctuations and price cuts forced on the suppliers by<br />
the operators in the wake of the financial crisis, there was a drop in 2009 from USD<br />
3.0 billion to USD 2.4 billion. From 2009 the market is expected to decline towards<br />
2013.<br />
Decommissioning is not a large market offshore Angola, but there is some smaller<br />
platform decommissioning work to be carried out in the period <strong>2011</strong>-14.<br />
6