INTSOK Annual Market Report (2011-2014) ANGOLA
INTSOK Annual Market Report (2011-2014) ANGOLA
INTSOK Annual Market Report (2011-2014) ANGOLA

Create successful ePaper yourself
Turn your PDF publications into a flip-book with our unique Google optimized e-Paper software.
<strong>INTSOK</strong> <strong>Annual</strong> <strong>Market</strong> <strong>Report</strong> 2010<br />
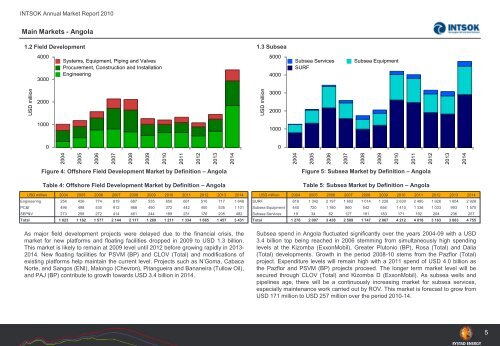
Main <strong>Market</strong>s - Angola<br />
1.2 Field Development<br />
CUBEAUTO Chart<br />
S(ChartType:ColumnStacked<br />
;Legend:Custom;GridLinesX:off;GridLinesY:off;LegendX:0;LegendY:0;Legend<br />
Cols:1;LegendRows:3;Palette:Default;PaletteText:off)<br />
F(Country:Angola;On Off Shore:Offshore;<strong>INTSOK</strong> Category:Field<br />
Development)<br />
C(<strong>INTSOK</strong> <strong>Market</strong> Definition)<br />
R(Year:2004-<strong>2014</strong>)<br />
V(Value:USD million)<br />
Figure 4: Offshore Field Development <strong>Market</strong> by Definition – Angola<br />
Table 4: Offshore Field Development <strong>Market</strong> by Definition – Angola<br />
CUBEAUTO USD million<strong>Report</strong> 2004 2005 2006 2007 2008 2009 2010 <strong>2011</strong> 2012 2013 <strong>2014</strong><br />
Engineering S(FontSize:6;Format:#,##0) 254 426 774 819 687 535<br />
F(Country:Angola;On Off Shore:Offshore;<strong>INTSOK</strong> Category:Field Development)<br />
PC&I<br />
C(Year:2004-<strong>2014</strong>)<br />
496 498 530 912 968 490<br />
650<br />
372<br />
661<br />
442<br />
510<br />
400<br />
717<br />
535<br />
1 848<br />
1 101<br />
SEP&V R(<strong>INTSOK</strong> <strong>Market</strong> Definition 273 Table) 258 272 414 461 244 189 231 176 205 482<br />
Total<br />
V(Value:USD million)<br />
1 023 1 182 1 577 2 144 2 117 1 269 1 211 1 334 1 085 1 457 3 431<br />
As major field development projects were delayed due to the financial crisis, the<br />
market for new platforms and floating facilities dropped in 2009 to USD 1.3 billion.<br />
This market is likely to remain at 2009 level until 2012 before growing rapidly in 2013-<br />
<strong>2014</strong>. New floating facilities for PSVM (BP) and CLOV (Total) and modifications of<br />
existing platforms help maintain the current level. Projects such as N’Goma, Cabaca<br />
Norte, and Sangos (ENI), Malongo (Chevron), Pitangueira and Bananeira (Tullow Oil),<br />
and PAJ (BP) contribute to growth towards USD 3.4 billion in <strong>2014</strong>.<br />
1.3 Subsea<br />
CUBEAUTO Chart<br />
S(ChartType:ColumnStacked<br />
;Legend:Custom;GridLinesX:off;GridLinesY:off;LegendX:0;LegendY:0;Palette<br />
:Default;PaletteText:off)<br />
F(Country:Angola;On Off Shore:Offshore;<strong>INTSOK</strong> Category:Subsea)<br />
C(<strong>INTSOK</strong> <strong>Market</strong> Definition)<br />
R(Year:2004-<strong>2014</strong>)<br />
V(Value:USD million)<br />
Figure 5: Subsea <strong>Market</strong> by Definition – Angola<br />
Table 5: Subsea <strong>Market</strong> by Definition – Angola<br />
CUBEAUTO USD million<strong>Report</strong> 2004 2005 2006 2007 2008 2009 2010 <strong>2011</strong> 2012 2013 <strong>2014</strong><br />
SURF S(FontSize:6;Format:#,##0) 819 1 342 2 197 1 602 1 014<br />
F(Country:Angola;On Off Shore:Offshore;<strong>INTSOK</strong> Category:Subsea)<br />
Subsea<br />
C(Year:2004-<strong>2014</strong>)<br />
Equipment 440 720 1 180 860 542<br />
1 228<br />
656<br />
2 630<br />
1 410<br />
2 490<br />
1 336<br />
1 926<br />
1 033<br />
1 854<br />
993<br />
2 928<br />
1 570<br />
Subsea R(<strong>INTSOK</strong> Services <strong>Market</strong> Definition 19 Table) 34 62 127 191 183 171 192 204 236 257<br />
Total<br />
V(Value:USD million)<br />
1 278 2 097 3 438 2 589 1 747 2 067 4 212 4 018 3 163 3 083 4 755<br />
Subsea spend in Angola fluctuated significantly over the years 2004-09 with a USD<br />
3.4 billion top being reached in 2006 stemming from simultaneously high spending<br />
levels at the Kizomba (ExxonMobil), Greater Plutonio (BP), Rosa (Total) and Dalia<br />
(Total) developments. Growth in the period 2008-10 stems from the Pazflor (Total)<br />
project. Expenditure levels will remain high with a <strong>2011</strong> spend of USD 4.0 billion as<br />
the Pazflor and PSVM (BP) projects proceed. The longer term market level will be<br />
secured through CLOV (Total) and Kizomba D (ExxonMobil). As subsea wells and<br />
pipelines age, there will be a continuously increasing market for subsea services,<br />
especially maintenance work carried out by ROV. This market is forecast to grow from<br />
USD 171 million to USD 257 million over the period 2010-14.<br />
5