JTAGjet â¢- Trace for Cortex-M3 âM4 - Embedded Tools GmbH
JTAGjet â¢- Trace for Cortex-M3 âM4 - Embedded Tools GmbH
JTAGjet â¢- Trace for Cortex-M3 âM4 - Embedded Tools GmbH

You also want an ePaper? Increase the reach of your titles
YUMPU automatically turns print PDFs into web optimized ePapers that Google loves.
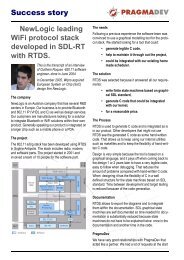
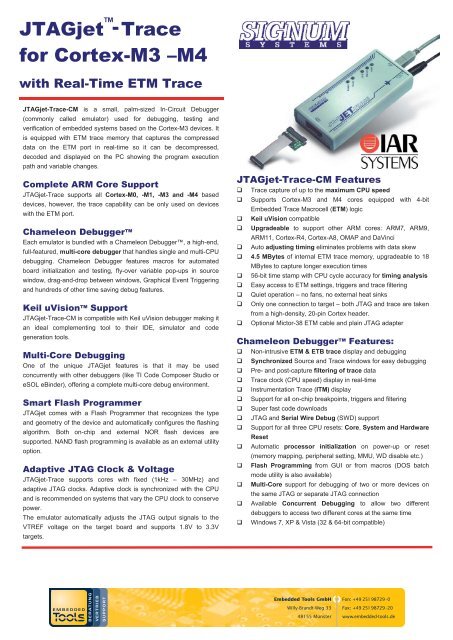
<strong>JTAGjet</strong> - <strong>Trace</strong><strong>for</strong> <strong>Cortex</strong>-<strong>M3</strong> –M4with Real-Time ETM <strong>Trace</strong><strong>JTAGjet</strong>-<strong>Trace</strong>-CM is a small, palm-sized In-Circuit Debugger(commonly called emulator) used <strong>for</strong> debugging, testing andverification of embedded systems based on the <strong>Cortex</strong>-<strong>M3</strong> devices. Itis equipped with ETM trace memory that captures the compresseddata on the ETM port in real-time so it can be decompressed,decoded and displayed on the PC showing the program executionpath and variable changes.Complete ARM Core Support<strong>JTAGjet</strong>-<strong>Trace</strong> supports all <strong>Cortex</strong>-M0, -M1, -<strong>M3</strong> and -M4 baseddevices, however, the trace capability can be only used on deviceswith the ETM port.Chameleon DebuggerEach emulator is bundled with a Chameleon Debugger, a high-end,full-featured, multi-core debugger that handles single and multi-CPUdebugging. Chameleon Debugger features macros <strong>for</strong> automatedboard initialization and testing, fly-over variable pop-ups in sourcewindow, drag-and-drop between windows, Graphical Event Triggeringand hundreds of other time saving debug features.Keil uVision Support<strong>JTAGjet</strong>-<strong>Trace</strong>-CM is compatible with Keil uVision debugger making itan ideal complementing tool to their IDE, simulator and codegeneration tools.Multi-Core DebuggingOne of the unique <strong>JTAGjet</strong> features is that it may be usedconcurrently with other debuggers (like TI Code Composer Studio oreSOL eBinder), offering a complete multi-core debug environment.Smart Flash Programmer<strong>JTAGjet</strong> comes with a Flash Programmer that recognizes the typeand geometry of the device and automatically configures the flashingalgorithm. Both on-chip and external NOR flash devices aresupported. NAND flash programming is available as an external utilityoption.Adaptive JTAG Clock & Voltage<strong>JTAGjet</strong>-<strong>Trace</strong> supports cores with fixed (1kHz – 30MHz) andadaptive JTAG clocks. Adaptive clock is synchronized with the CPUand is recommended on systems that vary the CPU clock to conservepower.The emulator automatically adjusts the JTAG output signals to theVTREF voltage on the target board and supports 1.8V to 3.3Vtargets.<strong>JTAGjet</strong>-<strong>Trace</strong>-CM Features <strong>Trace</strong> capture of up to the maximum CPU speed Supports <strong>Cortex</strong>-<strong>M3</strong> and M4 cores equipped with 4-bit<strong>Embedded</strong> <strong>Trace</strong> Macrocell (ETM) logic Keil uVision compatible Upgradeable to support other ARM cores: ARM7, ARM9,ARM11, <strong>Cortex</strong>-R4, <strong>Cortex</strong>-A8, OMAP and DaVinci Auto adjusting timing eliminates problems with data skew 4.5 MBytes of internal ETM trace memory, upgradeable to 18MBytes to capture longer execution times 56-bit time stamp with CPU cycle accuracy <strong>for</strong> timing analysis Easy access to ETM settings, triggers and trace filtering Quiet operation – no fans, no external heat sinks Only one connection to target – both JTAG and trace are takenfrom a high-density, 20-pin <strong>Cortex</strong> header. Optional Mictor-38 ETM cable and plain JTAG adapterChameleon Debugger Features: Non-intrusive ETM & ETB trace display and debuggingSynchronized Source and <strong>Trace</strong> windows <strong>for</strong> easy debuggingPre- and post-capture filtering of trace data<strong>Trace</strong> clock (CPU speed) display in real-timeInstrumentation <strong>Trace</strong> (ITM) displaySupport <strong>for</strong> all on-chip breakpoints, triggers and filteringSuper fast code downloadsJTAG and Serial Wire Debug (SWD) supportSupport <strong>for</strong> all three CPU resets: Core, System and HardwareResetAutomatic processor initialization on power-up or reset(memory mapping, peripheral setting, MMU, WD disable etc.)Flash Programming from GUI or from macros (DOS batchmode utility is also available)Multi-Core support <strong>for</strong> debugging of two or more devices onthe same JTAG or separate JTAG connectionAvailable Concurrent Debugging to allow two differentdebuggers to access two different cores at the same timeWindows 7, XP & Vista (32 & 64-bit compatible)
Specifications<strong>JTAGjet</strong> - <strong>Trace</strong>-CMSpecifications <strong>JTAGjet</strong>-<strong>Trace</strong>-CMUSB type / SpeedUSB 2.0 type A / 480 MbpsETM <strong>Trace</strong> Memory 4.5 MBytes standard, 18Mbytes optionalCores Supported <strong>Cortex</strong>-<strong>M3</strong>, M4, upgradeable to other ARM coresMax. CPU Speed120 MHz standard, up to 400MHz optionalProbe Length4 inProbe Type20-pin <strong>Cortex</strong>/SWD standard, Mictor-38 optionalMax. JTAG Clock30 MHzJTAG I/O Voltage 1.8V – 3.3VCurrent Draw (typ.)0.8 A typ., AC adapter includedDimensions (in.)5.6L-2.6W-1.2H<strong>JTAGjet</strong>-<strong>Trace</strong>-CM shown withoptional blue Mictor-38 cable andJTAG splitter (green)<strong>Trace</strong> window showing real-time trace in<strong>for</strong>mation captured during program execution. Full program path (PC) is shown with function names and thecorresponding assembler and C/C++ source code. In addition, on-chip Comparators (shown in the setup window) were set to generate ITM data trace <strong>for</strong> Buf1[0]and Buf1[2] accesses. Comparator2 is used to generate ETM Event to start the trace on processing function and Comparator3 is used to stop the trace on writeto location Buf1[2]. Red line shows trace discontinuity. Yellow line shows STRB instruction (which was a write of 0x47 to Buf1[2] that stopped the PC trace).Timestamp is being shown in two columns (in ms and CPU cycles). The gap in trace capture was <strong>for</strong> 12778 CPU cycles (~178 ms).Current <strong>Trace</strong> Clock frequency is shown as 36MHz. <strong>Cortex</strong>-<strong>M3</strong> CPU always runs twice as fast as the <strong>Trace</strong> Clock, so the CPU speed is 72 MHz.Ordering In<strong>for</strong>mationPart Number<strong>JTAGjet</strong>-<strong>Trace</strong>-CMCable-ETM-6ADA-ETM-JTAGDescription<strong>JTAGjet</strong> <strong>for</strong> <strong>Cortex</strong>-<strong>M3</strong>, M4 with 4.5 MBytes ETM trace memory, Chameleon Debugger, IAR driver and <strong>Cortex</strong> 20-pin cableMictor 38-pin ETM cable, 6 inchMictor 38-pin ETM to ARM-20 and TI-14 splitter probe. Comes with 20-pin and 14-pin flat cables