VISION MISSION
2010/2011 - University of Swaziland
2010/2011 - University of Swaziland
- No tags were found...

You also want an ePaper? Increase the reach of your titles
YUMPU automatically turns print PDFs into web optimized ePapers that Google loves.
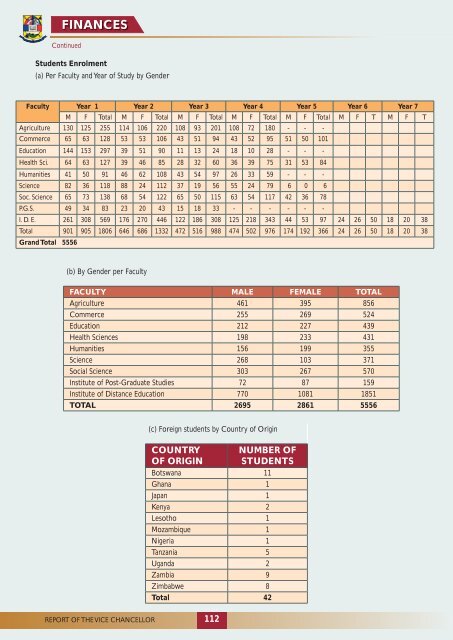
FINANCESContinuedStudents Enrolment(a) Per Faculty and Year of Study by GenderFaculty Year 1 Year 2 Year 3 Year 4 Year 5 Year 6 Year 7M F Total M F Total M F Total M F Total M F Total M F T M F TAgriculture 130 125 255 114 106 220 108 93 201 108 72 180 - - -Commerce 65 63 128 53 53 106 43 51 94 43 52 95 51 50 101Education 144 153 297 39 51 90 11 13 24 18 10 28 - - -Health Sci. 64 63 127 39 46 85 28 32 60 36 39 75 31 53 84Humanities 41 50 91 46 62 108 43 54 97 26 33 59 - - -Science 82 36 118 88 24 112 37 19 56 55 24 79 6 0 6Soc. Science 65 73 138 68 54 122 65 50 115 63 54 117 42 36 78P.G.S. 49 34 83 23 20 43 15 18 33 - - - - - -I. D. E. 261 308 569 176 270 446 122 186 308 125 218 343 44 53 97 24 26 50 18 20 38Total 901 905 1806 646 686 1332 472 516 988 474 502 976 174 192 366 24 26 50 18 20 38Grand Total 5556(b) By Gender per FacultyFACULTY MALE FEMALE TOTALAgriculture 461 395 856Commerce 255 269 524Education 212 227 439Health Sciences 198 233 431Humanities 156 199 355Science 268 103 371Social Science 303 267 570Institute of Post-Graduate Studies 72 87 159Institute of Distance Education 770 1081 1851TOTAL 2695 2861 5556(c) Foreign students by Country of OriginCOUNTRYOF ORIGINREPORT OF THE VICE CHANCELLOR 11206NUMBER OFSTUDENTSBotswana 11Ghana 1Japan 1Kenya 2Lesotho 1Mozambique 1Nigeria 1Tanzania 5Uganda 2Zambia 9Zimbabwe 8Total 42