repères et références statistiques
Présentation
Présentation
- No tags were found...

You also want an ePaper? Increase the reach of your titles
YUMPU automatically turns print PDFs into web optimized ePapers that Google loves.
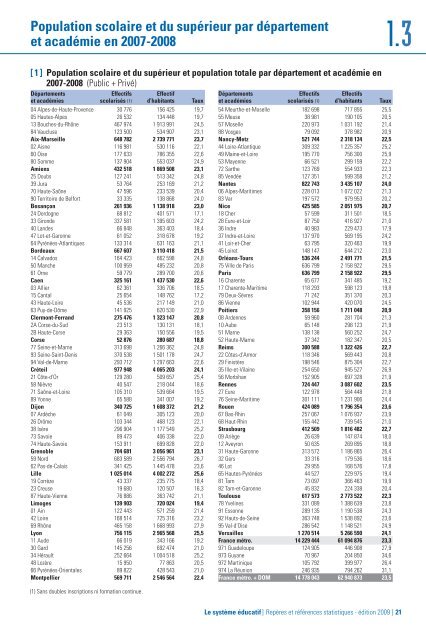
Population scolaire <strong>et</strong> du supérieur par département1.3<strong>et</strong> académie en 2007-2008[1] Population scolaire <strong>et</strong> du supérieur <strong>et</strong> population totale par département <strong>et</strong> académie en2007-2008 (Public + Privé)Départements Effectifs Effectif<strong>et</strong> académies scolarisés (1) d’habitants Taux04 Alpes-de-Haute-Provence 30 776 156 425 19,705 Hautes-Alpes 26 532 134 448 19,713 Bouches-du-Rhône 467 974 1 913 991 24,584 Vaucluse 123 500 534 907 23,1Aix-Marseille 648 782 2 739 771 23,702 Aisne 116 981 530 116 22,160 Oise 177 633 786 355 22,680 Somme 137 904 553 037 24,9Amiens 432 518 1 869 508 23,125 Doubs 127 241 513 342 24,839 Jura 53 764 253 169 21,270 Haute-Saône 47 596 233 539 20,490 Territoire de Belfort 33 335 138 868 24,0Besançon 261 936 1 138 918 23,024 Dordogne 68 812 401 571 17,133 Gironde 337 581 1 395 603 24,240 Landes 66 848 363 403 18,447 Lot-<strong>et</strong>-Garonne 61 052 318 678 19,264 Pyrénées-Atlantiques 133 314 631 163 21,1Bordeaux 667 607 3 110 418 21,514 Calvados 164 423 662 598 24,850 Manche 100 959 485 232 20,861 Orne 59 779 289 700 20,6Caen 325 161 1 437 530 22,603 Allier 62 361 336 706 18,515 Cantal 25 654 148 762 17,243 Haute-Loire 45 536 217 149 21,063 Puy-de-Dôme 141 925 620 530 22,9Clermont-Ferrand 275 476 1 323 147 20,82A Corse-du-Sud 23 513 130 131 18,12B Haute-Corse 29 363 150 556 19,5Corse 52 876 280 687 18,877 Seine-<strong>et</strong>-Marne 313 698 1 266 362 24,893 Seine-Saint-Denis 370 538 1 501 178 24,794 Val-de-Marne 293 712 1 297 663 22,6Créteil 977 948 4 065 203 24,121 Côte-d'Or 129 280 509 657 25,458 Nièvre 40 547 218 044 18,671 Saône-<strong>et</strong>-Loire 105 310 539 664 19,589 Yonne 65 588 341 007 19,2Dijon 340 725 1 608 372 21,207 Ardèche 61 049 305 123 20,026 Drôme 103 344 468 123 22,138 Isère 296 904 1 177 549 25,273 Savoie 89 473 406 338 22,074 Haute-Savoie 153 911 699 828 22,0Grenoble 704 681 3 056 961 23,159 Nord 683 589 2 556 794 26,762 Pas-de-Calais 341 425 1 445 478 23,6Lille 1 025 014 4 002 272 25,619 Corrèze 43 337 235 775 18,423 Creuse 19 680 120 507 16,387 Haute-Vienne 76 886 363 742 21,1Limoges 139 903 720 024 19,401 Ain 122 443 571 259 21,442 Loire 168 514 725 316 23,269 Rhône 465 158 1 668 993 27,9Lyon 756 115 2 965 568 25,511 Aude 66 019 343 166 19,230 Gard 145 256 692 474 21,034 Hérault 252 664 1 004 518 25,248 Lozère 15 950 77 863 20,566 Pyrénées-Orientales 89 822 428 543 21,0Montpellier 569 711 2 546 564 22,4(1) Sans doubles inscriptions ni formation continue.Départements Effectifs Effectifs<strong>et</strong> académies scolarisés (1) d’habitants Taux54 Meurthe-<strong>et</strong>-Moselle 182 698 717 855 25,555 Meuse 38 981 190 105 20,557 Moselle 220 973 1 031 192 21,488 Vosges 79 092 378 982 20,9Nancy-M<strong>et</strong>z 521 744 2 318 134 22,544 Loire-Atlantique 309 332 1 225 357 25,249 Maine-<strong>et</strong>-Loire 195 770 756 300 25,953 Mayenne 66 521 299 159 22,272 Sarthe 123 769 554 933 22,385 Vendée 127 351 599 358 21,2Nantes 822 743 3 435 107 24,006 Alpes-Maritimes 228 013 1 072 022 21,383 Var 197 572 979 953 20,2Nice 425 585 2 051 975 20,718 Cher 57 599 311 501 18,528 Eure-<strong>et</strong>-Loir 87 750 416 927 21,036 Indre 40 983 229 473 17,937 Indre-<strong>et</strong>-Loire 137 970 569 195 24,241 Loir-<strong>et</strong>-Cher 63 795 320 463 19,945 Loir<strong>et</strong> 148 147 644 212 23,0Orléans-Tours 536 244 2 491 771 21,575 Ville de Paris 636 799 2 158 922 29,5Paris 636 799 2 158 922 29,516 Charente 65 677 341 485 19,217 Charente-Maritime 118 293 598 123 19,879 Deux-Sèvres 71 242 351 370 20,386 Vienne 102 944 420 070 24,5Poitiers 358 156 1 711 048 20,908 Ardennes 59 960 281 704 21,310 Aube 65 148 298 123 21,951 Marne 138 138 560 252 24,752 Haute-Marne 37 342 182 347 20,5Reims 300 588 1 322 426 22,722 Côtes-d'Armor 118 346 569 443 20,829 Finistère 198 546 875 304 22,735 Ille-<strong>et</strong>-Vilaine 254 650 945 527 26,956 Morbihan 152 905 697 328 21,9Rennes 724 447 3 087 602 23,527 Eure 122 978 564 448 21,876 Seine-Maritime 301 111 1 231 906 24,4Rouen 424 089 1 796 354 23,667 Bas-Rhin 257 067 1 076 937 23,968 Haut-Rhin 155 442 739 545 21,0Strasbourg 412 509 1 816 482 22,709 Ariège 26 639 147 874 18,012 Aveyron 50 635 269 895 18,831 Haute-Garonne 313 572 1 186 865 26,432 Gers 33 316 179 536 18,646 Lot 29 955 168 576 17,865 Hautes-Pyrénées 44 527 229 975 19,481 Tarn 73 097 366 463 19,982 Tarn-<strong>et</strong>-Garonne 45 832 224 338 20,4Toulouse 617 573 2 773 522 22,378 Yvelines 331 089 1 388 639 23,891 Essonne 289 135 1 190 538 24,392 Hauts-de-Seine 363 748 1 538 892 23,695 Val-d'Oise 286 542 1 148 521 24,9Versailles 1 270 514 5 266 590 24,1France métro. 14 229 444 61 094 876 23,3971 Guadeloupe 124 905 446 908 27,9973 Guyane 70 967 204 850 34,6972 Martinique 105 792 399 977 26,4974 La Réunion 246 935 794 262 31,1France métro. + DOM 14 778 043 62 940 873 23,5Le système éducatif ] Repères <strong>et</strong> <strong>références</strong> <strong>statistiques</strong> - édition 2009 ] 21