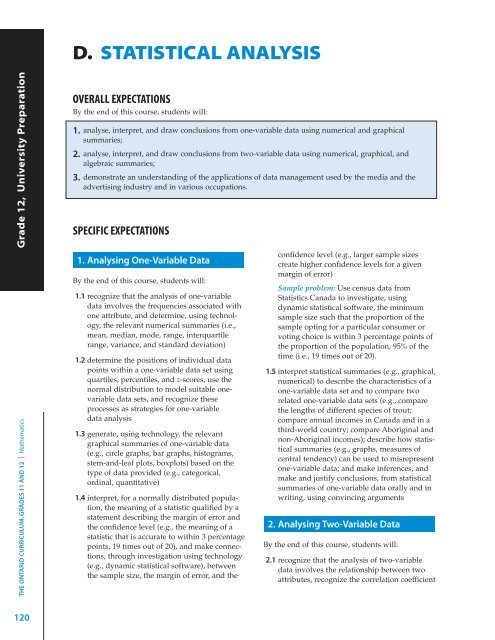
D. STATISTICAL ANALYSISTHE ONTARIO CURRICULUM, GRADES 11 AND 12 | <strong>Mathematics</strong> Grade 12, University PreparationOVERALL EXPECTATIONSBy the end of this course, students will:1. analyse, interpret, and draw conclusions from one-variable data using numerical and graphicalsummaries;2. analyse, interpret, and draw conclusions from two-variable data using numerical, graphical, andalgebraic summaries;3. demonstrate an understanding of the applications of data management used by the media and theadvertising industry and in various occupations.SPECIFIC EXPECTATIONS1. Analysing One-Variable DataBy the end of this course, students will:1.1 recognize that the analysis of one-variabledata involves the frequencies associated withone attribute, and determine, using technology,the relevant numerical summaries (i.e.,mean, median, mode, range, interquartilerange, variance, and standard deviation)1.2 determine the positions of individual datapoints within a one-variable data set usingquartiles, percentiles, and z-scores, use thenormal distribution to model suitable onevariabledata sets, and recognize theseprocesses as strategies for one-variabledata analysis1.3 generate, using technology, the relevantgraphical summaries of one-variable data(e.g., circle graphs, bar graphs, histograms,stem-and-leaf plots, boxplots) based on thetype of data provided (e.g., categorical,ordinal, quantitative)1.4 interpret, for a normally distributed population,the meaning of a statistic qualified by astatement describing the margin of error andthe confidence level (e.g., the meaning of astatistic that is accurate to within 3 percentagepoints, 19 times out of 20), and make connections,through investigation using technology(e.g., dynamic statistical software), betweenthe sample size, the margin of error, and theconfidence level (e.g., larger sample sizescreate higher confidence levels for a givenmargin of error)Sample problem: Use census data fromStatistics Canada to investigate, usingdynamic statistical software, the minimumsample size such that the proportion of thesample opting for a particular consumer orvoting choice is within 3 percentage points ofthe proportion of the population, 95% of thetime (i.e., 19 times out of 20).1.5 interpret statistical summaries (e.g., graphical,numerical) to describe the characteristics of aone-variable data set and to compare tworelated one-variable data sets (e.g., comparethe lengths of different species of trout;compare annual incomes in Canada and in athird-world country; compare Aboriginal andnon-Aboriginal incomes); describe how statisticalsummaries (e.g., graphs, measures ofcentral tendency) can be used to misrepresentone-variable data; and make inferences, andmake and justify conclusions, from statisticalsummaries of one-variable data orally and inwriting, using convincing arguments2. Analysing Two-Variable DataBy the end of this course, students will:2.1 recognize that the analysis of two-variabledata involves the relationship between twoattributes, recognize the correlation coefficient120
as a measure of the fit of the data to a linearmodel, and determine, using technology, therelevant numerical summaries (e.g., summarytables such as contingency tables; correlationcoefficients)Sample problem: Organize data from StatisticsCanada to analyse gender differences (e.g.,using contingency tables; using correlationcoefficients) related to a specific set of characteristics(e.g., average income, hours ofunpaid housework).2.2 recognize and distinguish different types ofrelationships between two variables that havea mathematical correlation (e.g., the causeand-effectrelationship between the age of atree and its diameter; the common-cause relationshipbetween ice cream sales and forestfires over the course of a year; the accidentalrelationship between the consumer priceindex and the number of known planets inthe universe)2.3 generate, using technology, the relevantgraphical summaries of two-variable data(e.g., scatter plots, side-by-side boxplots)based on the type of data provided (e.g.,categorical, ordinal, quantitative)2.4 determine, by performing a linear regressionusing technology, the equation of a line thatmodels a suitable two-variable data set, determinethe fit of an individual data point to thelinear model (e.g., by using residuals to identifyoutliers), and recognize these processesas strategies for two-variable data analysis2.5 interpret statistical summaries (e.g., scatterplot, equation representing a relationship)to describe the characteristics of a twovariabledata set and to compare two relatedtwo-variable data sets (e.g., compare therelationship between Grade 12 English andmathematics marks with the relationshipbetween Grade 12 science and mathematicsmarks); describe how statistical summaries(e.g., graphs, linear models) can be used tomisrepresent two-variable data; and makeinferences, and make and justify conclusions,from statistical summaries of two-variabledata orally and in writing, using convincingarguments3. Evaluating ValidityBy the end of this course, students will:3.1 interpret statistics presented in the media(e.g., the UN’s finding that 2% of the world’spopulation has more than half the world’swealth, whereas half the world’s populationhas only 1% of the world’s wealth), andexplain how the media, the advertising industry,and others (e.g., marketers, pollsters) useand misuse statistics (e.g., as represented ingraphs) to promote a certain point of view(e.g., by making a general statement based ona weak correlation or an assumed cause-andeffectrelationship; by starting the verticalscale at a value other than zero; by makingstatements using general population statisticswithout reference to data specific to minoritygroups)3.2 assess the validity of conclusions presentedin the media by examining sources of data,including Internet sources (i.e., to determinewhether they are authoritative, reliable,unbiased, and current), methods of datacollection, and possible sources of bias (e.g.,sampling bias, non-response bias, cultural biasin a survey question), and by questioning theanalysis of the data (e.g., whether there is anyindication of the sample size in the analysis)and conclusions drawn from the data (e.g.,whether any assumptions are made aboutcause and effect)Sample problem: The headline that accompaniesthe following graph says “Big Increasein Profits”. Suggest reasons why this headlinemay or may not be true.Profits ($ billions)232221201918172001 2002 2003 2004 2005 2006 2007Year3.3 gather, interpret, and describe informationabout applications of data management inoccupations (e.g., actuary, statistician, businessanalyst, sociologist, medical doctor,psychologist, teacher, community planner),and about university programs that explorethese applications<strong>Mathematics</strong> Functionsof Data ManagementMDM4USTATISTICAL ANALYSIS121
- Page 3 and 4:
CONTENTSINTRODUCTION 3Secondary Sch
- Page 5 and 6:
INTRODUCTIONThis document replaces
- Page 7 and 8:
and art. It is important that these
- Page 9 and 10:
THE PROGRAM INMATHEMATICSOVERVIEW O
- Page 11 and 12:
Courses in Mathematics, Grades 11 a
- Page 13 and 14:
Half-Credit CoursesThe courses outl
- Page 15 and 16:
The Grade 11 university preparation
- Page 17 and 18:
Grade 11FOUNDATIONS FORCOLLEGEMATHE
- Page 19 and 20:
THE MATHEMATICALPROCESSESPresented
- Page 21 and 22:
REASONING AND PROVINGReasoning help
- Page 23 and 24:
Mental computation involves calcula
- Page 25 and 26:
ASSESSMENTAND EVALUATIONOF STUDENTA
- Page 27 and 28:
THE ACHIEVEMENT CHART FOR MATHEMATI
- Page 29 and 30:
course and reflects the correspondi
- Page 31 and 32:
Categories 50−59%(Level 1)60−69
- Page 33 and 34:
The approaches and strategies used
- Page 35 and 36:
If the student requires either acco
- Page 37 and 38:
use of a variety of instructional s
- Page 39 and 40:
THE ROLE OF INFORMATION AND COMMUNI
- Page 41:
they need to be aware of harassment
- Page 45 and 46:
Functions, Grade 11University Prepa
- Page 47 and 48:
A. CHARACTERISTICS OF FUNCTIONSOVER
- Page 49 and 50:
2.5 solve problems involving the in
- Page 51 and 52:
2.2 determine, through investigatio
- Page 53 and 54:
2. Investigating Arithmetic andGeom
- Page 55 and 56:
D. TRIGONOMETRIC FUNCTIONSOVERALL E
- Page 57:
Sample problem: The relationship be
- Page 60 and 61:
MATHEMATICAL PROCESS EXPECTATIONSTh
- Page 62 and 63:
Grade 11, University/College Prepar
- Page 64 and 65:
Grade 11, University/College Prepar
- Page 66 and 67:
Grade 11, University/College Prepar
- Page 68 and 69:
Grade 11, University/College Prepar
- Page 70 and 71:
MATHEMATICAL PROCESS EXPECTATIONSTh
- Page 72 and 73: THE ONTARIO CURRICULUM, GRADES 11 A
- Page 74 and 75: 2. Comparing Financial Services 3.
- Page 76 and 77: Grade 11, Grade University/College
- Page 79 and 80: Mathematics for Work andEveryday Li
- Page 81 and 82: A. EARNING AND PURCHASINGOVERALL EX
- Page 83 and 84: B. SAVING, INVESTING, ANDBORROWINGO
- Page 85 and 86: C. TRANSPORTATION AND TRAVELOVERALL
- Page 87 and 88: Advanced Functions,Grade 12Universi
- Page 89 and 90: A. EXPONENTIAL AND LOGARITHMICFUNCT
- Page 91 and 92: B. TRIGONOMETRIC FUNCTIONSOVERALL E
- Page 93 and 94: C. POLYNOMIAL AND RATIONALFUNCTIONS
- Page 95 and 96: Sample problem: Investigate, using
- Page 97 and 98: D. CHARACTERISTICS OF FUNCTIONSGrad
- Page 99 and 100: 2.3 determine, through investigatio
- Page 101 and 102: Calculus and Vectors,Grade 12Univer
- Page 103 and 104: A. RATE OF CHANGEOVERALL EXPECTATIO
- Page 105 and 106: 2.6 determine, through investigatio
- Page 107 and 108: B. DERIVATIVES AND THEIRAPPLICATION
- Page 109 and 110: joules the bird gets if it spends t
- Page 111 and 112: 2.3 solve problems involving the ad
- Page 113 and 114: Mathematics of DataManagement, Grad
- Page 115 and 116: A. COUNTING AND PROBABILITYOVERALL
- Page 117 and 118: B. PROBABILITY DISTRIBUTIONSOVERALL
- Page 119 and 120: 2.7 make connections, through inves
- Page 121: 2.3 describe how the use of random
- Page 125 and 126: Mathematics for CollegeTechnology,
- Page 127 and 128: A. EXPONENTIAL FUNCTIONSOVERALL EXP
- Page 129 and 130: B. POLYNOMIAL FUNCTIONSOVERALL EXPE
- Page 131 and 132: 3.6 determine the value of a variab
- Page 133 and 134: 2.2 sketch the graphs of f(x) = sin
- Page 135 and 136: D. APPLICATIONS OF GEOMETRYOVERALL
- Page 137 and 138: Foundations for CollegeMathematics,
- Page 139 and 140: A. MATHEMATICAL MODELSOVERALL EXPEC
- Page 141 and 142: Years after 1955 Population of Gees
- Page 143 and 144: payable monthly. Use a given amorti
- Page 145 and 146: 2.2 determine, through investigatio
- Page 147: etween the two variables (i.e., by
- Page 150 and 151: MATHEMATICAL PROCESS EXPECTATIONSTh
- Page 152 and 153: THE ONTARIO CURRICULUM, GRADES 11 A
- Page 154 and 155: Grade 12, Workplace Preparationmont
- Page 156 and 157: THE ONTARIO CURRICULUM, GRADES 11 A
- Page 159 and 160: The Ministry of Education wishes to


