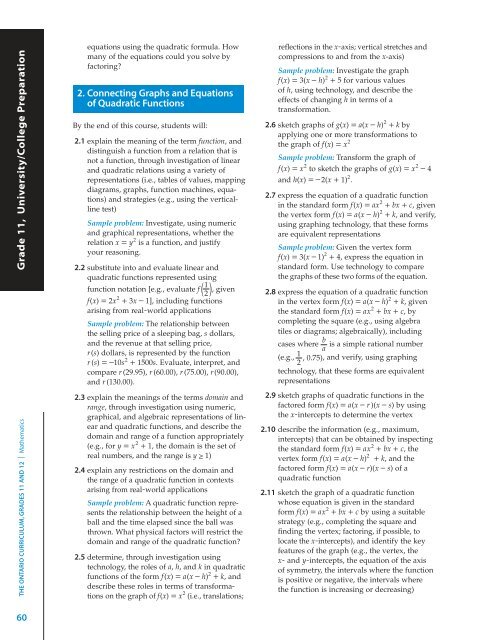
Grade 11, University/College PreparationTHE ONTARIO CURRICULUM, GRADES 11 AND 12 | <strong>Mathematics</strong>60equations using the quadratic formula. Howmany of the equations could you solve byfactoring?2. Connecting Graphs and Equationsof Quadratic FunctionsBy the end of this course, students will:2.1 explain the meaning of the term function, anddistinguish a function from a relation that isnot a function, through investigation of linearand quadratic relations using a variety ofrepresentations (i.e., tables of values, mappingdiagrams, graphs, function machines, equations)and strategies (e.g., using the verticallinetest)Sample problem: Investigate, using numericand graphical representations, whether the2relation x = y is a function, and justifyyour reasoning.2.2 substitute into and evaluate linear andquadratic functions represented using1function notation [e.g., evaluate f ( 2 ) , given2f(x) = 2x + 3x – 1], including functionsarising from real-world applicationsSample problem: The relationship betweenthe selling price of a sleeping bag, s dollars,and the revenue at that selling price,r(s) dollars, is represented by the function2r (s) = –10s + 1500s. Evaluate, interpret, andcompare r (29.95), r (60.00), r (75.00), r(90.00),and r (130.00).2.3 explain the meanings of the terms domain andrange, through investigation using numeric,graphical, and algebraic representations of linearand quadratic functions, and describe thedomain and range of a function appropriately2(e.g., for y = x + 1, the domain is the set ofreal numbers, and the range is y ≥ 1)2.4 explain any restrictions on the domain andthe range of a quadratic function in contextsarising from real-world applicationsSample problem: A quadratic function representsthe relationship between the height of aball and the time elapsed since the ball wasthrown. What physical factors will restrict thedomain and range of the quadratic function?2.5 determine, through investigation usingtechnology, the roles of a, h, and k in quadratic2functions of the form f(x) = a(x – h) + k, anddescribe these roles in terms of transformationson the graph of f(x) = x (i.e.,2translations;reflections in the x-axis; vertical stretches andcompressions to and from the x-axis)Sample problem: Investigate the graph2f(x) = 3(x – h) + 5 for various valuesof h, using technology, and describe theeffects of changing h in terms of atransformation.22.6 sketch graphs of g(x) = a(x – h) + k byapplying one or more transformations to2the graph of f(x) = xSample problem: Transform the graph of22f(x) = x to sketch the graphs of g(x) = x – 42and h(x) = – 2(x + 1) .2.7 express the equation of a quadratic function2in the standard form f(x) = ax + bx + c, given2the vertex form f(x) = a(x – h) + k, and verify,using graphing technology, that these formsare equivalent representationsSample problem: Given the vertex form2f(x) = 3(x – 1) + 4, express the equation instandard form. Use technology to comparethe graphs of these two forms of the equation.2.8 express the equation of a quadratic function2in the vertex form f(x) = a(x – h) + k, given2the standard form f(x) = ax + bx + c, bycompleting the square (e.g., using algebratiles or diagrams; algebraically), includingbcases where is a simple rational numbera(e.g.,1, 0.75), and verify, using graphing2technology, that these forms are equivalentrepresentations2.9 sketch graphs of quadratic functions in thefactored form f(x) = a(x – r )(x – s) by usingthe x-intercepts to determine the vertex2.10 describe the information (e.g., maximum,intercepts) that can be obtained by inspecting2the standard form f(x) = ax + bx + c, the2vertex form f(x) = a(x – h) + k, and thefactored form f(x) = a(x – r)(x – s) of aquadratic function2.11 sketch the graph of a quadratic functionwhose equation is given in the standard2form f(x) = ax + bx + c by using a suitablestrategy (e.g., completing the square andfinding the vertex; factoring, if possible, tolocate the x-intercepts), and identify the keyfeatures of the graph (e.g., the vertex, thex- and y-intercepts, the equation of the axisof symmetry, the intervals where the functionis positive or negative, the intervals wherethe function is increasing or decreasing)
3. Solving Problems InvolvingQuadratic FunctionsBy the end of this course, students will:3.1 collect data that can be modelled as a quadraticfunction, through investigation with andwithout technology, from primary sources,using a variety of tools (e.g., concrete materials;measurement tools such as measuringtapes, electronic probes, motion sensors), orfrom secondary sources (e.g., websites suchas Statistics Canada, E-STAT), and graphthe dataSample problem: When a 3 x 3 x 3 cube madeup of 1 x 1 x 1 cubes is dipped into red paint,6 of the smaller cubes will have 1 face painted.Investigate the number of smaller cubeswith 1 face painted as a function of the edgelength of the larger cube, and graph thefunction.3.2 determine, through investigation using a varietyof strategies (e.g., applying properties ofquadratic functions such as the x-interceptsand the vertex; using transformations), theequation of the quadratic function that bestmodels a suitable data set graphed on ascatter plot, and compare this equation to theequation of a curve of best fit generated withtechnology (e.g., graphing software, graphingcalculator)3.3 solve problems arising from real-world applications,given the algebraic representation of aquadratic function (e.g., given the equation ofa quadratic function representing the heightof a ball over elapsed time, answer questionsthat involve the maximum height of the ball,the length of time needed for the ball to touchthe ground, and the time interval when theball is higher than a given measurement)Sample problem: In the following DC electricalcircuit, the relationship between thepower used by a device, P (in watts, W), theelectric potential difference (voltage), V (involts, V), the current, I (in amperes, A), andthe resistance, R (in ohms, Ω ), is represented2by the formula P = IV – I R. Representgraphically and algebraically the relationshipbetween the power and the current when theelectric potential difference is 24 V and theresistance is 1.5 Ω. Determine the currentneeded in order for the device to use themaximum amount of power.VRIDeviceFunctions and ApplicationsMCF3MQUADRATIC FUNCTIONS61
- Page 3 and 4:
CONTENTSINTRODUCTION 3Secondary Sch
- Page 5 and 6:
INTRODUCTIONThis document replaces
- Page 7 and 8:
and art. It is important that these
- Page 9 and 10:
THE PROGRAM INMATHEMATICSOVERVIEW O
- Page 11 and 12: Courses in Mathematics, Grades 11 a
- Page 13 and 14: Half-Credit CoursesThe courses outl
- Page 15 and 16: The Grade 11 university preparation
- Page 17 and 18: Grade 11FOUNDATIONS FORCOLLEGEMATHE
- Page 19 and 20: THE MATHEMATICALPROCESSESPresented
- Page 21 and 22: REASONING AND PROVINGReasoning help
- Page 23 and 24: Mental computation involves calcula
- Page 25 and 26: ASSESSMENTAND EVALUATIONOF STUDENTA
- Page 27 and 28: THE ACHIEVEMENT CHART FOR MATHEMATI
- Page 29 and 30: course and reflects the correspondi
- Page 31 and 32: Categories 50−59%(Level 1)60−69
- Page 33 and 34: The approaches and strategies used
- Page 35 and 36: If the student requires either acco
- Page 37 and 38: use of a variety of instructional s
- Page 39 and 40: THE ROLE OF INFORMATION AND COMMUNI
- Page 41: they need to be aware of harassment
- Page 45 and 46: Functions, Grade 11University Prepa
- Page 47 and 48: A. CHARACTERISTICS OF FUNCTIONSOVER
- Page 49 and 50: 2.5 solve problems involving the in
- Page 51 and 52: 2.2 determine, through investigatio
- Page 53 and 54: 2. Investigating Arithmetic andGeom
- Page 55 and 56: D. TRIGONOMETRIC FUNCTIONSOVERALL E
- Page 57: Sample problem: The relationship be
- Page 60 and 61: MATHEMATICAL PROCESS EXPECTATIONSTh
- Page 64 and 65: Grade 11, University/College Prepar
- Page 66 and 67: Grade 11, University/College Prepar
- Page 68 and 69: Grade 11, University/College Prepar
- Page 70 and 71: MATHEMATICAL PROCESS EXPECTATIONSTh
- Page 72 and 73: THE ONTARIO CURRICULUM, GRADES 11 A
- Page 74 and 75: 2. Comparing Financial Services 3.
- Page 76 and 77: Grade 11, Grade University/College
- Page 79 and 80: Mathematics for Work andEveryday Li
- Page 81 and 82: A. EARNING AND PURCHASINGOVERALL EX
- Page 83 and 84: B. SAVING, INVESTING, ANDBORROWINGO
- Page 85 and 86: C. TRANSPORTATION AND TRAVELOVERALL
- Page 87 and 88: Advanced Functions,Grade 12Universi
- Page 89 and 90: A. EXPONENTIAL AND LOGARITHMICFUNCT
- Page 91 and 92: B. TRIGONOMETRIC FUNCTIONSOVERALL E
- Page 93 and 94: C. POLYNOMIAL AND RATIONALFUNCTIONS
- Page 95 and 96: Sample problem: Investigate, using
- Page 97 and 98: D. CHARACTERISTICS OF FUNCTIONSGrad
- Page 99 and 100: 2.3 determine, through investigatio
- Page 101 and 102: Calculus and Vectors,Grade 12Univer
- Page 103 and 104: A. RATE OF CHANGEOVERALL EXPECTATIO
- Page 105 and 106: 2.6 determine, through investigatio
- Page 107 and 108: B. DERIVATIVES AND THEIRAPPLICATION
- Page 109 and 110: joules the bird gets if it spends t
- Page 111 and 112: 2.3 solve problems involving the ad
- Page 113 and 114:
Mathematics of DataManagement, Grad
- Page 115 and 116:
A. COUNTING AND PROBABILITYOVERALL
- Page 117 and 118:
B. PROBABILITY DISTRIBUTIONSOVERALL
- Page 119 and 120:
2.7 make connections, through inves
- Page 121 and 122:
2.3 describe how the use of random
- Page 123 and 124:
as a measure of the fit of the data
- Page 125 and 126:
Mathematics for CollegeTechnology,
- Page 127 and 128:
A. EXPONENTIAL FUNCTIONSOVERALL EXP
- Page 129 and 130:
B. POLYNOMIAL FUNCTIONSOVERALL EXPE
- Page 131 and 132:
3.6 determine the value of a variab
- Page 133 and 134:
2.2 sketch the graphs of f(x) = sin
- Page 135 and 136:
D. APPLICATIONS OF GEOMETRYOVERALL
- Page 137 and 138:
Foundations for CollegeMathematics,
- Page 139 and 140:
A. MATHEMATICAL MODELSOVERALL EXPEC
- Page 141 and 142:
Years after 1955 Population of Gees
- Page 143 and 144:
payable monthly. Use a given amorti
- Page 145 and 146:
2.2 determine, through investigatio
- Page 147:
etween the two variables (i.e., by
- Page 150 and 151:
MATHEMATICAL PROCESS EXPECTATIONSTh
- Page 152 and 153:
THE ONTARIO CURRICULUM, GRADES 11 A
- Page 154 and 155:
Grade 12, Workplace Preparationmont
- Page 156 and 157:
THE ONTARIO CURRICULUM, GRADES 11 A
- Page 159 and 160:
The Ministry of Education wishes to


