Manual Short Form- Health and Labour Questionnaire (SF-HLQ)
Manual Short Form- Health and Labour Questionnaire (SF-HLQ)
Manual Short Form- Health and Labour Questionnaire (SF-HLQ)

You also want an ePaper? Increase the reach of your titles
YUMPU automatically turns print PDFs into web optimized ePapers that Google loves.
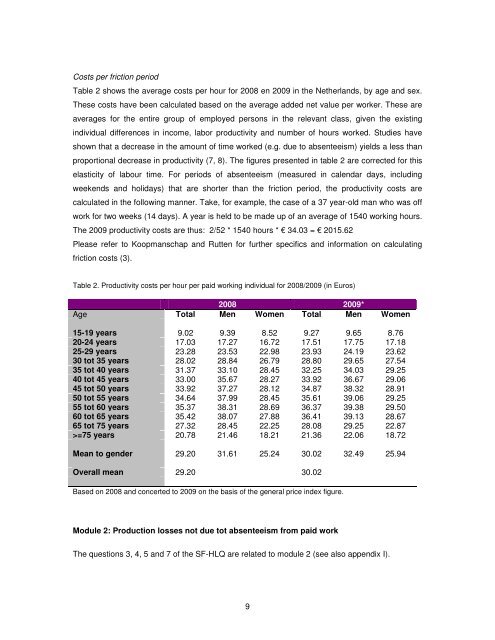
Costs per friction periodTable 2 shows the average costs per hour for 2008 en 2009 in the Netherl<strong>and</strong>s, by age <strong>and</strong> sex.These costs have been calculated based on the average added net value per worker. These areaverages for the entire group of employed persons in the relevant class, given the existingindividual differences in income, labor productivity <strong>and</strong> number of hours worked. Studies haveshown that a decrease in the amount of time worked (e.g. due to absenteeism) yields a less thanproportional decrease in productivity (7, 8). The figures presented in table 2 are corrected for thiselasticity of labour time. For periods of absenteeism (measured in calendar days, includingweekends <strong>and</strong> holidays) that are shorter than the friction period, the productivity costs arecalculated in the following manner. Take, for example, the case of a 37 year-old man who was offwork for two weeks (14 days). A year is held to be made up of an average of 1540 working hours.The 2009 productivity costs are thus: 2/52 * 1540 hours * € 34.03 = € 2015.62Please refer to Koopmanschap <strong>and</strong> Rutten for further specifics <strong>and</strong> information on calculatingfriction costs (3).Table 2. Productivity costs per hour per paid working individual for 2008/2009 (in Euros)2008 2009*Age Total Men Women Total Men Women15-19 years 9.02 9.39 8.52 9.27 9.65 8.7620-24 years 17.03 17.27 16.72 17.51 17.75 17.1825-29 years 23.28 23.53 22.98 23.93 24.19 23.6230 tot 35 years 28.02 28.84 26.79 28.80 29.65 27.5435 tot 40 years 31.37 33.10 28.45 32.25 34.03 29.2540 tot 45 years 33.00 35.67 28.27 33.92 36.67 29.0645 tot 50 years 33.92 37.27 28.12 34.87 38.32 28.9150 tot 55 years 34.64 37.99 28.45 35.61 39.06 29.2555 tot 60 years 35.37 38.31 28.69 36.37 39.38 29.5060 tot 65 years 35.42 38.07 27.88 36.41 39.13 28.6765 tot 75 years 27.32 28.45 22.25 28.08 29.25 22.87>=75 years 20.78 21.46 18.21 21.36 22.06 18.72Mean to gender 29.20 31.61 25.24 30.02 32.49 25.94Overall mean 29.20 30.02Based on 2008 <strong>and</strong> concerted to 2009 on the basis of the general price index figure.Module 2: Production losses not due tot absenteeism from paid workThe questions 3, 4, 5 <strong>and</strong> 7 of the <strong>SF</strong>-<strong>HLQ</strong> are related to module 2 (see also appendix I).9