GPG Group and Coats plc
Download Full Year Results Presentation PDF - Coats plc
Download Full Year Results Presentation PDF - Coats plc
- No tags were found...

You also want an ePaper? Increase the reach of your titles
YUMPU automatically turns print PDFs into web optimized ePapers that Google loves.
<strong>GPG</strong> <strong>Group</strong> <strong>and</strong> <strong>Coats</strong> <strong>plc</strong>Results presentation for year ending31 December 201227 February 2013
DisclaimerRestricted distributionThis presentation is not for release, publication or distribution, in whole or in part, directly or indirectly, in, into or from any jurisdiction where to do so wouldconstitute a violation of the relevant laws or regulations of such jurisdiction (the "Restricted Jurisdictions").Not an OfferThis presentation is not intended to <strong>and</strong> does not constitute, or form part of, any offer to sell or subscribe for or an invitation to purchase or subscribe for anysecurities or the solicitation of any vote or approval in any jurisdiction pursuant to the matters contained herein or otherwise.WebsiteA copy of this presentation will be available subject to certain restrictions relating to persons resident in the Restricted Jurisdictions on <strong>GPG</strong>'s website(www.gpg<strong>plc</strong>.com). The contents of <strong>GPG</strong>'s website are not incorporated into <strong>and</strong> do not form part of this presentation.Forward-looking statementsThis document contains certain forward-looking statements, including statements regarding <strong>Coats</strong>' <strong>and</strong> <strong>GPG</strong>'s plans, objectives <strong>and</strong> expected performance.Such statements relate to events <strong>and</strong> depend on circumstances that will occur in the future <strong>and</strong> are subject to risks, uncertainties <strong>and</strong> assumptions. There area number of factors which could cause actual results <strong>and</strong> developments to differ materially from those expressed or implied by such forward-lookingstatements, including, among others the enactment of legislation or regulation that may impose costs or restrict activities; the re-negotiation of contracts oflicences; fluctuations in dem<strong>and</strong> <strong>and</strong> pricing in the industry; fluctuations in exchange controls; changes in government policy <strong>and</strong> taxations; industrial disputes;<strong>and</strong> war <strong>and</strong> terrorism. These forward-looking statements speak only as at the date of this document.Not a profit forecastThe financial information contained in this presentation is based on publicly available historic financial information of the <strong>GPG</strong> group <strong>and</strong> is not intended to be aprofit forecast or profit estimate under applicable rules.Currency assumptionsAll amounts stated in NZ$ are for illustrative purposes only, based on the NZ$:GBP exchange rate on 31 December 2012, NZ$1.9621:£1.00.© <strong>GPG</strong> <strong>Group</strong> <strong>and</strong> <strong>Coats</strong> <strong>plc</strong> | Financial results for year ending 31 December 2012 Page 2
Agenda1. <strong>GPG</strong> <strong>Group</strong> strategy update2. <strong>GPG</strong> <strong>Group</strong> results highlights3. <strong>Coats</strong> overview, strategy <strong>and</strong> outlook4. Investment portfolio (excluding <strong>Coats</strong>)5. Appendices1. <strong>GPG</strong> – additional background2. <strong>Coats</strong> – additional background© <strong>GPG</strong> <strong>Group</strong> <strong>and</strong> <strong>Coats</strong> <strong>plc</strong> | Financial results for year ending 31 December 2012 Page 3
<strong>GPG</strong> <strong>Group</strong>Strategy Update
Strategy update• <strong>GPG</strong> will be re-launched as <strong>Coats</strong> – target completion remains the second half of 2013 (subject to internal <strong>and</strong>external events)• A transition plan has been in train for several months <strong>and</strong> incorporates the following key initiatives:– Reconstitution of the Board to ensure it has the requisite skills to develop <strong>Coats</strong> as a st<strong>and</strong>-alone,listed entity for the long-term– Enhance the current business performance <strong>and</strong> strategic positioning of <strong>Coats</strong>– Define <strong>and</strong> implement the optimal capital structure for <strong>Coats</strong> to achieve its strategic objectives <strong>and</strong>optimise its capital markets positioning– Finalisation of the structure to support the <strong>GPG</strong> pension schemes– Maximise cash distributions to shareholders© <strong>GPG</strong> <strong>Group</strong> <strong>and</strong> <strong>Coats</strong> <strong>plc</strong> | Financial results for year ending 31 December 2012 Page 5
<strong>GPG</strong> <strong>Group</strong>Results Highlights
<strong>GPG</strong> <strong>Group</strong> results highlights<strong>GPG</strong> total group highlights• Shareholders’ funds £434m (31 December 2011: £602m); reduction driven primarily by:– Shareholder returns of £25m (31 December 2011: £92m)– £76m charge in respect of the <strong>Coats</strong> EC Fine– IAS19 <strong>Group</strong> pension (<strong>Coats</strong> <strong>and</strong> <strong>GPG</strong>) actuarial losses £40m (31 December 2011: £215m)• Net asset backing per share 27.7p (NZ$0.54) (31 December 2011: 37.1p (NZ$0.724))• Parent <strong>Group</strong> cash balance £243m (31 December 2011: net debt £14m)– Unaudited cash balance as at 22 February 2013 - £275m (NZ$540m)• Further progress on value realisation – non-<strong>Coats</strong> investment portfolio cash generation in 2012 of £314m(NZ$616m) <strong>and</strong> cumulative net cash generated since 1 January 2011 of £495m (NZ$971m)• Net attributable loss £3m (including <strong>Coats</strong> EC Fine charge) (year ended 31 December 2011: £1m profit)© <strong>GPG</strong> <strong>Group</strong> <strong>and</strong> <strong>Coats</strong> <strong>plc</strong> | Financial results for year ending 31 December 2012 Page 7
G P G G R O U P ELEMENTS OF REPORTED LOSS<strong>GPG</strong> <strong>Group</strong> – elementsF O RofT Hreported E P E R I O Dloss for the period£m £mContinuing activity<strong>Coats</strong>- Profit after tax before exceptionals 34- EC fine <strong>and</strong> interest (76)- Other exceptional items (28)(70)Parent <strong>Group</strong>- Overheads (21)- Foreign exchange losses (2)- Other income 1- Net interest expense (8)(30)Net loss from continuing activity (100)Discontinued operations<strong>Coats</strong> (2)Parent <strong>Group</strong> subsidiary <strong>and</strong> associated undertakings <strong>and</strong>joint ventures 61InvestmentsGains realised in the period (recycled from the unrealisedgains reserve) 39Dividend income 6Impairments (3)42Other income 1Parent <strong>Group</strong> tax (Note 1) (5)Net profit from discontinued activities 97Net loss for the period attributable to <strong>GPG</strong> shareholders (3)Note 1: consists principally of non-cash deferred tax© <strong>GPG</strong> <strong>Group</strong> <strong>and</strong> <strong>Coats</strong> <strong>plc</strong> | Financial results for year ending 31 December 2012 Page 8
<strong>GPG</strong> G P G – Ssimplified I M P L I F I E D B Abalance L A N C E S HsheetE E T31 Dec 2012 31 Dec 2011£m £m £m £mOperating subsidiaries (book value) - 50Associated undertakings <strong>and</strong> joint ventures (bookvalue) - 212Fixed asset investments available for sale - 202Held for sale assets 222 66Current assets investments 9 10Total investments 231 540Cash (see note below) 243 200<strong>GPG</strong> assets excluding <strong>Coats</strong> 474 740Capital notes - (214)<strong>GPG</strong> pension schemes (74) (64)Other net creditors (14) (10)386 452<strong>Coats</strong>Other net assets 481 504Net debt (226) (153)Employee benefit obligations (207) (201)48 150Shareholders' funds 434 602NAV / share (NZ₵) 54.4 73.9Note: Cash at 31 December 2012consisted of the following currencies:GBPNZDAUD£m11410326243© <strong>GPG</strong> <strong>Group</strong> <strong>and</strong> <strong>Coats</strong> <strong>plc</strong> | Financial results for year ending 31 December 2012 Page 9
G P G – M O V E M E N T S I N S H A R E H O L D E R S ’ F U N D S<strong>GPG</strong> <strong>Group</strong> movements in shareholders’ funds£m £mOpening shareholders' funds 602Shareholder returns – Share buyback (25)Loss for the periodEC Fine, including related interest (76)Other profits 73(3)Movements in unrealised gains reserveNet gains realised in the period (recycled through the Income Statement) (39)Net unrealised movements on AFS investments (14)Deferred tax movement 3(50)Pensions - IAS19 adjustments<strong>GPG</strong> schemes (17)<strong>Coats</strong> (23)(40)Foreign currency revaluations<strong>Coats</strong> (8)Other– arising in the period 3Other– re-cycled to the Income Statement (45)(50)Closing shareholders' funds 434NZ$852m© <strong>GPG</strong> <strong>Group</strong> <strong>and</strong> <strong>Coats</strong> <strong>plc</strong> | Financial results for year ending 31 December 2012 Page 10
<strong>Group</strong> G P G P E Nemployee S I O N S C H E MbenefitsE A N A LY S I S• Movement in the IAS19 deficits since the 2011 year end includesthe impact of changes in the discount rate applied to the schemeliabilities (based on AA rated corporate bond interest rates) <strong>and</strong> therate of inflation applicable to those liabilities• It is anticipated, when the <strong>Coats</strong> 2012 valuation is finalised, thatcontributions in respect of past service will increase byapproximately £7m per annum to some £14m per annum• Current support provisions provide the Trustees of the Brunel <strong>and</strong>Staveley Schemes with a contingent claim over the assets of <strong>GPG</strong>of some £124m (NZ$243m)• Will likely mean at least £124m (NZ$243m) of asset realisationproceeds will be required to be retained by the <strong>GPG</strong> group• During 2012 the Staveley April 2011 triennial valuation was agreedwith the Trustee, concluding with a deficit of £20.3m. This alsoresulted in:‒ a one-off payment of £5m <strong>and</strong> monthly contributions over aneight year period of £0.11m commencing in July 2012(£1.3m per annum); <strong>and</strong>‒ A formal mechanism to protect the net assets of the sponsorcompany• No past service employer contributions are being made to theBrunel pension scheme, however, the Trustee <strong>and</strong> <strong>GPG</strong> arediscussing the continuing form of support for that scheme.IAS19 deficit31 Dec2012£m31 Dec2011£m<strong>Coats</strong> UK (161) (161)<strong>Coats</strong> Other (46) (40)<strong>Coats</strong> Total (207) (201)Brunel (38) (31)Staveley (36) (34)Total £m (281) (266)Total NZ$m (551) (522)• Next triennial valuations:‒ <strong>Coats</strong>: to be completed by June 2013‒ Brunel: to be completed by June 2014‒ Staveley: to be completed by July 2015• The accounting st<strong>and</strong>ard dealing with employeebenefits (IAS19) has been revised <strong>and</strong> will beadopted from 1 January 2013. Had the amendedIAS19 been applied in 2012 the estimated full yeareffect would have been :-‒ a reduction in operating profit of £5m‒ an increase in net interest costs of £22m‒ a corresponding improvement of £27m in theactuarial loss arising within reserves• There will be no impact on the <strong>Group</strong>’s net definedbenefit obligation or cash flow© <strong>GPG</strong> <strong>Group</strong> <strong>and</strong> <strong>Coats</strong> <strong>plc</strong> | Financial results for year ending 31 December 2012 Page 11
Overhead analysis <strong>and</strong> progressO V E R H E A D A N A LY S I S & P R O G R E S S• Headcount at 31 December 2012 - 15 executivemanagement <strong>and</strong> administration employees:– 3 dedicated investment professionals– 9 finance, legal <strong>and</strong> administrative staff– 3 support staff• Other staff incentives represent cost of staffretention <strong>and</strong> reward programmes <strong>and</strong> futureredundancies• Costs being spread over period that services areprovided• Certain incentives dependent on outcome of assetrealisation exercise• Following the October 2012 announcement of thetransition to New <strong>Coats</strong>, work streams have beenestablished to ensure the efficient rundown of<strong>GPG</strong>’s corporate offices <strong>and</strong> the migration ofadministration responsibility to the <strong>Coats</strong>management teamOne-off advisors' fees relating to thestrategic review <strong>and</strong> return of capitalCost of redundancies arising in theperiodYear ended31 Dec 2012£mYear ended31 Dec 2011£m- 91 2Other staff incentives 6 6Regular staff costs 5 7NED fees 1 1Legal & professional 3 4Bank facility fees 1 2Property costs 2 2Legacy & other costs 2 2Total £m 21 35Total NZ$m 41 69© <strong>GPG</strong> <strong>Group</strong> <strong>and</strong> <strong>Coats</strong> <strong>plc</strong> | Financial results for year ending 31 December 2012 Page 12
Summary <strong>and</strong>Financial Performance
2012 summary• Trading remained largely as anticipated – despite tough market conditions• Reported full year sales down 3% but up 2% on constant currency basis• H2 2012 saw improvement in revenue (4% 1 ) <strong>and</strong> operating profit (16% 1 )on H2 2011. Operating margins rose from 7.2% to 8.0%• Reorganisation activity on track• Overall net cash outflows on accelerated reorg projects to be largely offset by disposalproceeds (before tax) of approx. $50m• EC fine increased net debt by $175m but was fully funded from existing facilities• Free cash flow (pre-EC fine payment) increase from $18m to $45m1At constant exchange rates© <strong>GPG</strong> <strong>Group</strong> <strong>and</strong> <strong>Coats</strong> <strong>plc</strong> | Financial results for year ending 31 December 2012 Page 14
Full year financial performance$'m2012 2011Beforeexceptional Exceptional TotalBeforeexceptional Exceptional TotalRevenue 1 1653 1653 1702 1702Operating profit / (loss) 127 (132) (5) 144 (12) 132Profit / (loss) before tax 111 (167) (56) 136 (12) 124Profit / (loss) after tax 61 (164) (103) 89 (10) 79Retained profit / (loss) 51 (164) (113) 81 (10) 71Free cash flow 45 18Net debt 368 238NWC % sales 2 17.1% 17.6%ROCE 2 3 19.0% 19.7%1Revenue growth in 2012 was 2% at constant exchange rates2At constant exchange rates3Return on operating assets employed© <strong>GPG</strong> <strong>Group</strong> <strong>and</strong> <strong>Coats</strong> <strong>plc</strong> | Financial results for year ending 31 December 2012 Page 15
Underlying operating performanceTotal revenue 1950850750650550450650YoY9%YoY3%YoY1%YoY4%815 803 819 834H1 2011 H2 2011 H1 2012 H2 2012Industrial revenue 1$'mOperating profit 1Six months endedTwelve months endedDecember YoY% 2 December YoY% 2Industrial 58.3 +14% 110.8 (6)%Crafts 8.8 +35% 16.2 (10)%Total 67.1 +16% 127.0 (7)%600550500450YoY12%YoY3%YoY(1)%YoY2%598 570 592 583H1 2011 H2 2011 H1 2012 H2 2012Operating profitmargin 1 %Industrial 10.0% +100 bps 9.4% (70)bpsCrafts revenue 1300250200YoY YoY YoY YoY3% 2% 5% 8%150217 233 228 251H1 2011 H2 2011 H1 2012 H2 2012Crafts 3.5% +70 bps 3.4% (60)bpsTotal 8.0% +80 bps 7.7% (70)bps1At constant exchange rates2Underlying operating profit excluding reorganisation <strong>and</strong> other exceptional items© <strong>GPG</strong> <strong>Group</strong> <strong>and</strong> <strong>Coats</strong> <strong>plc</strong> | Financial results for year ending 31 December 2012 Page 16
Industrial performanceAsia & Australasia• Strong sales growth in second half• Continuing inflationary pressures• Impacted by EMEA end-user marketsEMEA• Tight inventory control by retailers• Reduced central EU opportunity asimports fully made <strong>and</strong> not cut-<strong>and</strong>-makeAmericasIndustrial performance by region 1$'mRevenue2012 2011 2 YoY% YoY%H2Asia & Australasia 625 609 3% 6%EMEA 254 255 0% 1%Americas 296 304 (3)% (3)%Total 1175 1168 1% 2%Operating profit 3 110.8 117.9 (6)%• Significant drop in defence sector dem<strong>and</strong>• Increased levels of imports intoLatin America markets• Lower consumer dem<strong>and</strong> in Latin America1In line with changes in 2012 to the internal management structure, Asia & AustralasiaCrafts results are now reported in the Industrial Division <strong>and</strong> comparative 2011 figureshave been restated accordingly. Sales <strong>and</strong> operating profit 3 for this business in 2012were $79m <strong>and</strong> $5m respectively2At constant exchange rates3Underlying operating profit excluding reorganisation <strong>and</strong> other exceptional itemsOperating profit % 9.4% 10.1%296254625Asia & AustralasiaEMEAAmericas© <strong>GPG</strong> <strong>Group</strong> <strong>and</strong> <strong>Coats</strong> <strong>plc</strong> | Financial results for year ending 31 December 2012 Page 17
Crafts performanceEMEA• H<strong>and</strong>knitting key growth driver• Reorganisation activity on schedule• Remains loss making – but $4m lowerthan 2011. 2013 restructuring to facilitatefurther improvement, but will adverselyimpact top line sales growth as non-coreproduct ranges are exitedAmericasCrafts performance by region$'mRevenue2012 2011 1 YoY% YoY%H2EMEA 168 160 5% 9%Americas 311 291 7% 7%Total 479 451 6% 8%Operating profit 2 16.2 18.1 (10)% 35%Operating profit % 3.4% 4.0%• Key shelf space wins in North America• Unwinding of customer overstocking inLatin America311168EMEAAmericas1At constant exchange rates2Underlying operating profit excluding reorganisation <strong>and</strong> other exceptional items© <strong>GPG</strong> <strong>Group</strong> <strong>and</strong> <strong>Coats</strong> <strong>plc</strong> | Financial results for year ending 31 December 2012 Page 18
Income statement• Exceptional items in PBT– EC fine $120m– Reorganisation costs $39m– US Environmental $8m• IAS 19 pension finance credit(will be a net charge from 2013)• Finance costs – one offinvestment income in 2011driving increase in 2012• Tax rate impacted by EC fine<strong>and</strong> other exceptionals –underlying rate up from 35% to46% due principally to weakerLatin America trading$'mBeforeexceptional Exceptional2012 2011TotalBeforeexceptional ExceptionalRevenue 1653 1653 1702 1702Operating profit/(loss) 127 (132) (5) 144 (12) 132Share of profit of JVs 1 1 2 2Pensions credit 15 15 17 17Finance costs (32) (35) (67) (27) (27)Profit/(loss) before tax 111 (167) (56) 136 (12) 124Tax (50) 3 (47) (47) 2 (45)Profit/(loss) fromcontinuing operations 61 (164) (103) 89 (10) 79Loss from discontinuedoperations (3) (3) (2) (2)Profit/(loss) for the year 58 (164) (106) 87 (10) 77Minority interest (7) (7) (6) (6)Retained profit/(loss) 51 (164) (113) 81 (10) 71Total© <strong>GPG</strong> <strong>Group</strong> <strong>and</strong> <strong>Coats</strong> <strong>plc</strong> | Financial results for year ending 31 December 2012 Page 19
ReorganisationReorganisation activity• Reorganisation activity on track –within the $75m outlined in November2012• Announced the restructuring of EMEACrafts to drive margin improvement.Expect adverse top-line impact asunprofitable areas of activity eliminated• Rationalisation of EMEA Zipsbusiness in 2012 to enhanceoperational efficiencyReorganisation activity by Division2012 2011$'mIndustrial 12.1 0.9Crafts 27.8 13.7Exceptional reorganisation cost 39.9 14.6Original projects 16.0 14.6Accelerated projects 23.9Cash outflow in year 21 .4 13.7• Accelerated projects to be cashneutral overall when includingdisposal proceeds© <strong>GPG</strong> <strong>Group</strong> <strong>and</strong> <strong>Coats</strong> <strong>plc</strong> | Financial results for year ending 31 December 2012 Page 20
Cash flow <strong>and</strong> leverageCash flow (before EC fine)200• 96% cash conversion 1180711• Net working capital % sales reduced from17.6% to 17.1% 216020• Capex at 0.7x depreciation – expected tobe below 1x in medium term14012039• Free cash flow $45m ($66m pre reorg)Leverage <strong>and</strong> liquidity• Net debt of $368m• Committed bank facilities toOctober 2016$m100806040180273510• Comfortably within covenants2045– Net debt / EBITDA 2.1x vs 4x01Operating cash inflow/ EBITDA – operating cash inflow of $172m isEBITDA, working capital, pension cash top up <strong>and</strong> $4m outflow in Other2At constant exchange rates© <strong>GPG</strong> <strong>Group</strong> <strong>and</strong> <strong>Coats</strong> <strong>plc</strong> | Financial results for year ending 31 December 2012 Page 22
Strategy <strong>and</strong> Outlook
<strong>Group</strong> sales in 2012Three discrete segments <strong>and</strong> a global footprintSales by Division Sales by region *$1.7bn$1.7bnCrafts33%$0.5bnAsia <strong>and</strong>Australasia17%$0.7bnIndustrial:Apparel <strong>and</strong>Footwear67%$1.2bnEMEA$0.4bn21%SpecialityAmericas16%$0.6bnFY 2012* Sales are by origin, not destinationFY 2012© <strong>GPG</strong> <strong>Group</strong> <strong>and</strong> <strong>Coats</strong> <strong>plc</strong> | Financial results for year ending 31 December 2012 Page 24
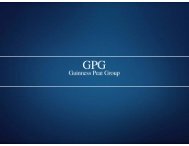
Clothing retail sales <strong>and</strong> GDP linkThere is a strong link between clothing retail sales <strong>and</strong> GDP growth; in the US,clothing retail sales growth is approximately 1.5 times GDP growthSource: GDP: Actual - Consensus forecasts; Projected – IMF / CRS: US - Census Bureau, EU15 - Eurostat, JP – METI / Analysis: Internal© <strong>GPG</strong> <strong>Group</strong> <strong>and</strong> <strong>Coats</strong> <strong>plc</strong> | Financial results for year ending 31 December 2012 Page 25
Speciality overview - ‘GDP+’A highly fragmented GDP+ market with significant share gain potentialMarket characteristics• Speciality universe approx. $30bn in size,driven by consumer <strong>and</strong> governmentdem<strong>and</strong>• <strong>Coats</strong> operates in three broad categories:– Traditional – ‘existing products’e.g. automotive, bedding, sports goods– Emerging – ‘recently developed’products e.g. fibre optics, tyre cord weft,flame retardant performance wear– VAEY – potential new ‘adjacent’products e.g. aramid blends, coatedyarns, mechanical rubber goods,security thread• Current Speciality thread market worthc.$0.6bn <strong>and</strong> adjacent VAEY marketc. $1.2bn; estimated growth 2xGDP<strong>Coats</strong> strategic agenda• Within $1.8bn market space, <strong>Coats</strong> is the leaderin its current speciality market <strong>and</strong> an emergingpresence in VAEY• Exploiting current core competencies(e.g. spinning <strong>and</strong> coating) <strong>and</strong> building newones (e.g. extrusion); also global footprint• Three strategic themes will underpin growth ofthe business– Geographic expansion: rolling out existingproducts– Managing the innovation pipeline:R&D / new technologies in VAEY– Technical sales: specialists <strong>and</strong>specifications• Significant organic <strong>and</strong> inorganic growthpotential© <strong>GPG</strong> <strong>Group</strong> <strong>and</strong> <strong>Coats</strong> <strong>plc</strong> | Financial results for year ending 31 December 2012 Page 26
Innovation pipelineWe are gaining market share throughproduct <strong>and</strong> service innovations• <strong>Coats</strong> Colour Express – world’s fastest, mostaccurate web based colour sampling service• <strong>Coats</strong> Fusion – a fusible yarn that securely attachesseams <strong>and</strong> buttons via stitching <strong>and</strong> bonding• <strong>Coats</strong> Ultrabloc – a water swellable yarn used forprotecting fibre optic cables• <strong>Coats</strong> Protect – the world’s first anti-microbialthread that inhibits the growth of microbes <strong>and</strong>bacteria around seams• <strong>Coats</strong> Insectiban – a naturally occurring treatmentfor threads <strong>and</strong> zips that kills bed bugs but isharmless to pets <strong>and</strong> humans© <strong>GPG</strong> <strong>Group</strong> <strong>and</strong> <strong>Coats</strong> <strong>plc</strong> | Financial results for year ending 31 December 2012 Page 27
Global key accountsWe work with the world’s leading br<strong>and</strong>s across our apparel, footwear <strong>and</strong> speciality businesses© <strong>GPG</strong> <strong>Group</strong> <strong>and</strong> <strong>Coats</strong> <strong>plc</strong> | Financial results for year ending 31 December 2012 Page 28
The leading global player in textile craftsThe crafts offer covers many product types <strong>and</strong> br<strong>and</strong>s – creative <strong>and</strong> hobby, plus care <strong>and</strong> repair. By aggregate,we are already the global leader, but significant growth opportunities exist in individual markets <strong>and</strong> segments.H<strong>and</strong>knitting & Crochet Needlecraft & Accessories Lifestyle Fabrics• H<strong>and</strong>knitting• Crochet• Sewing thread• Embroidery• Zips• Soft haberdashery• Hard haberdashery• Publications• Lifestyle Fabrics- patchwork- craft projects- home sewing / decorating© <strong>GPG</strong> <strong>Group</strong> <strong>and</strong> <strong>Coats</strong> <strong>plc</strong> | Financial results for year ending 31 December 2012 Page 29
Crafts – global leader with opportunitiesSignificant growth opportunities exist in individual markets <strong>and</strong> segmentsMarket characteristics• Multiple categories meeting ‘care <strong>and</strong> repair’<strong>and</strong> creative/ recreational needs; estimatedmarket size $2.8bn• Stable market driven by consumers’discretionary income <strong>and</strong> time• Influenced by fashion/ hobby ‘trends’ <strong>and</strong>need for self-expression/ customisation• Emergence of Asian middle class <strong>and</strong>increase in leisure time should drive growth• Channel l<strong>and</strong>scape <strong>and</strong> customerfragmentation varies by geography:independents important but declining• Alternative distribution channels(e-commerce) emerging as a major factor• Competitor crafts players are largely focusedon one or two key product categories<strong>Coats</strong> strategic agenda• <strong>Coats</strong> is the market leader <strong>and</strong> the only globalplayer across the large range of sub-segmentswithin Crafts• Clear opportunities to drive growth through:– Geographic expansion/ roll out– Optimising channel strategy <strong>and</strong>reorganisations in Europe– Focus on key br<strong>and</strong>s/ products– Building marketing/ sales capability– Well defined <strong>and</strong> effectively delivereddigital strategy– Category management with NorthAmerican chains• Strategy drove 6% like-for-like global salesgrowth in 2012© <strong>GPG</strong> <strong>Group</strong> <strong>and</strong> <strong>Coats</strong> <strong>plc</strong> | Financial results for year ending 31 December 2012 Page 30
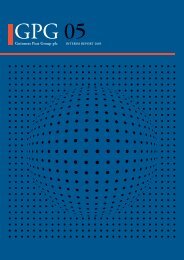
Market share growthMarket share increase in key segments <strong>and</strong> core markets delivered over last three years<strong>Coats</strong> market share 2010-2012 (%)Industrial DivisionCrafts Division25.126.026.520.221.0 21.2 21.2 2219.316.016.018.0ApparelFootwear& AccessoriesSpecialityCraftsSource: Internal market analysis201020112012© <strong>GPG</strong> <strong>Group</strong> <strong>and</strong> <strong>Coats</strong> <strong>plc</strong> | Financial results for year ending 31 December 2012 Page 31
Strategic h<strong>and</strong> of cards1234567Global market leader with robust <strong>and</strong> defendable business modelWell invested asset base with global footprint, reorg programmeconcludingTechnology <strong>and</strong> innovation capability that differentiatesExperienced management team with relevant strength <strong>and</strong> depthSolid cash flow <strong>and</strong> opportunities for profit growthClear growth strategy with margin improvement potential <strong>and</strong>underlying growthOpportunity for selective ‘bolt-on’ strategy© <strong>GPG</strong> <strong>Group</strong> <strong>and</strong> <strong>Coats</strong> <strong>plc</strong> | Financial results for year ending 31 December 2012 Page 32
Our three Market GoalsThe <strong>Coats</strong> of 2015…The leadingglobal player intextile craftsThe leading globalplayer in specialitythreads <strong>and</strong> yarnsThe leading valueadded partner to theglobal apparel <strong>and</strong>footwear industries…based on a core of world class skills <strong>and</strong> infrastructure in the enabling units© <strong>GPG</strong> <strong>Group</strong> <strong>and</strong> <strong>Coats</strong> <strong>plc</strong> | Financial results for year ending 31 December 2012 Page 33
Prospects for 2013• Modest economic growth expected in North America; Asia growth should remainstrong; EMEA likely to be subdued• Year on year improvement expected in Industrial sales, partially driven by growth inSpeciality (non-apparel <strong>and</strong> footwear) markets together with product <strong>and</strong> serviceinnovation in core apparel <strong>and</strong> footwear markets• Raw material costs trending marginally upwards; payroll <strong>and</strong> other inflationarypressures likely to remain high in our markets - offsets include sales price increases<strong>and</strong> benefits of reorgs <strong>and</strong> other cost management measures• <strong>Coats</strong>’ strong position as a global market leader with a robust <strong>and</strong> defendable businessmodel <strong>and</strong> stable margins means we are well placed for growth, even in challengingmarket conditions© <strong>GPG</strong> <strong>Group</strong> <strong>and</strong> <strong>Coats</strong> <strong>plc</strong> | Financial results for year ending 31 December 2012 Page 34
Investment Portfolio(Excluding <strong>Coats</strong>)
Value realisation strategyDisposals £ million NZ$ million2011 DisposalsCSR 43 84Chrysalis 15 29Pertama 13 26Alinta Energy (now Redbank Energy) 11 21Marshalls 6 12Maryborough SF 6 12NIB Holdings 5 999 193Disposals less than £5million, dividendreceipts <strong>and</strong> other investment activity 45 89Total generated in the period 144 2822012 DisposalsClearView Wealth 75 147T&G 72 141Young’s 53 104Greens General Foods 30 59Tourism Asset Holdings 12 24CSR 10 19Gosford Quarry 10 19eServglobal 9 18Metals X 7 14Newbury Racecourse 6 12Thwaites 5 10289 567Disposals less than £5million, dividendreceipts <strong>and</strong> other investment activity 25 49Total generated in the period 314 6162013 DisposalsCapral 27 53AV Jennings 5 1032 63Disposals less than £5million, dividendreceipts <strong>and</strong> other investment activity 5 10Total generated in the period 37 73Generation <strong>and</strong> use of funds to date• Net proceeds from 1 January 2012 to22 February 2013 £351m (NZ$689m)• Further initiatives under way to maximise valueof the remaining portfolio• A £10m on-market buyback programme wasannounced on 3 September 2012 <strong>and</strong> this wasextended on 25 October 2012 with a revisedupper limit of £70m. Shares with a marketvalue of £34m have been bought back asat 22 February 2013• Timing <strong>and</strong> amount of future returns will bedetermined taking account of the appropriatecapital structure for “New <strong>Coats</strong>” <strong>and</strong> the<strong>Group</strong>’s obligation to support the <strong>GPG</strong> pensionschemes© <strong>GPG</strong> <strong>Group</strong> <strong>and</strong> <strong>Coats</strong> <strong>plc</strong> | Financial results for year ending 31 December 2012 Page 36
Remaining investment portfolioTOWER• Tower has confirmed it has obtained High Court orders in relation to itsproposed return of approximately NZ$120m of capital to shareholders• <strong>GPG</strong>’s share of that return is NZ$40m – vote to approve the proposedscheme is due to be held on 21 March 2013• Tower’s stated ambition to become a more focused insurance businesshas <strong>GPG</strong>’s full support• Another step towards achieving this strategy occurred on 26 February2013, wherein Tower announced the conditional sale of its investmentsbusiness for NZ$79mRIDLEY• Ridley is expected to complete the sale of its Salt division at the end ofFebruary 2013• <strong>GPG</strong> believes this transaction will more effectively position thecompany as a focused agri-business within the Australian marketINVESTMENT PORTFOLIO (22 February 2013)Investments (excluding <strong>Coats</strong>)Listed Investments *ShareholdingMarketValue£mTower Limited 33.6% 93Ridley Corporation Limited 22.1% 49CIC Australia Limited 72.8% 37PrimeAg Australia Limited 11.6% 25T<strong>and</strong>ou Limited ** 28.4% 9Non-listed Investments ** 3Total 216*Listed investments at market value translated at exchange rate ruling on 22 February 2013**T<strong>and</strong>ou <strong>and</strong> the non-listed investments are valued at book value.PRIMEAG• PrimeAg has agreed to sell approximately 60% of its portfolio of l<strong>and</strong><strong>and</strong> water entitlements for some A$125m in cash• Additionally, <strong>and</strong> separate from the recent sale, the PrimeAg board hasresolved to distribute available excess cash (market expectation is thatthis may be in the order of A$125m)TANDOU• <strong>GPG</strong> has agreed to sell its entire shareholding in T<strong>and</strong>ou– proceeds are expected to be A$15m© <strong>GPG</strong> <strong>Group</strong> <strong>and</strong> <strong>Coats</strong> <strong>plc</strong> | Financial results for year ending 31 December 2012 Page 37
Appendices<strong>GPG</strong> background
ADetailed p p e n d i x 2 pensions : D e t a i l e d Pensions analysis A n a l ys i sSummary of <strong>GPG</strong> defined benefit pension schemes under IAS19<strong>Coats</strong><strong>GPG</strong>UK US Other Total Staveley Brunel <strong>Group</strong>£m £m £m £m £m £m £mFunded schemesAssets- Equities 568.9 43.3 8.3 620.5 84.4 65.9 770.8- Bonds 711.1 105.1 11.0 827.2 92.2 46.9 966.3- Other 142.2 - 4.3 146.5 5.6 3.5 155.6- Total 1422.2 148.4 23.6 1594.2 182.2 116.3 1892.7Liabilities (1583.3) (100.4) (24.8) (1708.5) (218.6) (154.0) (2081.1)(161.1) 48.0 (1.2) (114.3) (36.4) (37.7) (188.4)Impact of surplus cap - (25.0) (1.3) (26.3) - - (26.3)Net funded surplus / (deficit) (161.1) 23.0 (2.5) (140.6) (36.4) (37.7) (214.7)Unfunded liabilities - - (66.7) (66.7) - - (66.7)Total net surplus / (deficit) (161.1) 23.0 (69.2) (207.3) (36.4) (37.7) (281.4)Presentation in <strong>GPG</strong> Balance Sheet<strong>Coats</strong><strong>GPG</strong>UK US Other Total Staveley Brunel <strong>Group</strong>£m £m £m £m £m £m £mCurrent assets - 3.3 0.1 3.4 - - 3.4Non- current assets - 19.7 1.6 21.3 - - 21.3Current liabilities (14.0) - (5.7) (19.7) (1.3) - (21.0)Non-current liabilities- funded (147.1) - (4.1) (151.2) (35.1) (37.7) (224.0)- unfunded - - (61.1) (61.1) - - (61.1)(161.1) 23.0 (69.2) (207.3) (36.4) (37.7) (281.4)© <strong>GPG</strong> <strong>Group</strong> <strong>and</strong> <strong>Coats</strong> <strong>plc</strong> | Financial results for year ending 31 December 2012 Page 39
Detailed pensions analysisIAS 19 roll forward - 2012<strong>Coats</strong><strong>GPG</strong>UK US Other Total Staveley Brunel <strong>Group</strong>£m £m £m £m £m £m £mOpening position 1 January 2012 (161.5) 21.7 (61.8) (201.6) (33.5) (30.7) (265.8)Included in <strong>Coats</strong>’EBITDA currentservice cost£7.5mSurplus in <strong>Coats</strong>’funded US schemeutilised in fundingmedical costs for“Other” US schemeIncome Statement (pre tax)Current service cost (1.9) (2.0) (3.6) (7.5) - - (7.5)Net finance income / (expense) on pension scheme net assets 7.8 3.5 (1.9) 9.4 0.5 0.2 10.1Net income / (expense) 5.9 1.5 (5.5) 1.9 0.5 0.2 2.6ReservesNet actuarial gain / (loss) (14.3) 2.8 (11.3) (22.8) (9.1) (7.2) (39.1)Impact of surplus cap - (0.3) 0.5 0.2 - - 0.2Use of surplus - (1.6) 1.6 - - - -FX - (1.1) 1.8 0.7 - - 0.7Net reserve movement (14.3) (0.2) (7.4) (21.9) (9.1) (7.2) (38.2)Cash flowEmployer contributions 8.8 - 4.1 12.9 5.7 - 18.6Unfunded benefits paid by employer - 1.4 1.4 - - 1.4Total cash outflow 8.8 - 5.5 14.3 5.7 - 20.0Currentcontributions paidto <strong>Coats</strong>’ “Other”schemes £4.1m.Benefits paiddirectly by <strong>Coats</strong>in respect ofunfunded liabilities£1.4mClosing position 31 December 2012 (161.1) 23.0 (69.2) (207.3) (36.4) (37.7) (281.4)Actuarial loss:<strong>Coats</strong> UK Staveley Brunel£m £m £mLoss due to change in discount rate assumption (from 4.6% to 4.1%) (106.8) (13.4) (9.2)Gain due to change in inflation assumption (from RPI 2.75% to 2.60%, <strong>and</strong>CPI 2.00% to 2.10%) 19.7 1.5 0.1Gain due to higher asset return than expected 90.8 5.1 1.9(Loss)/gain due to change in other (non-financial) assumptions (12.3) 1.0 -Experience loss on liabilities (5.7) (3.3) -Total actuarial loss (14.3) (9.1) (7.2)Actual cashpayments to theschemes £20.0mThe UK recoveryplan is based onthe 2009 triennialvaluation, <strong>and</strong>£7m of thisamount is inrespect of deficitcontributions. Thepayment profilewill be revised oncompletion of the2012 valuation© <strong>GPG</strong> <strong>Group</strong> <strong>and</strong> <strong>Coats</strong> <strong>plc</strong> | Financial results for year ending 31 December 2012 Page 40
Appendices<strong>Coats</strong> background
<strong>Coats</strong> <strong>plc</strong> – introduction• No. 1 in sewing thread – largest globalmanufacturer with +20% market share• No. 1 in textile crafts – largest globalplayer in the market• No. 2 in global zips – second largestsupplier to global br<strong>and</strong>s• Only truly global supplier of thread <strong>and</strong>speciality yarns<strong>Coats</strong> is the world’s leading industrial <strong>and</strong> textilecrafts business <strong>and</strong> number two in global zips© <strong>GPG</strong> <strong>Group</strong> <strong>and</strong> <strong>Coats</strong> <strong>plc</strong> | Financial results for year ending 31 December 2012 Page 42
<strong>Coats</strong> facts• 1 in 5 garments around the world areheld together using <strong>Coats</strong>’ thread• 75 million car airbags are made using<strong>Coats</strong>’ thread every year• <strong>Coats</strong> produces enough yarn to knit 65million scarves a year• <strong>Coats</strong> produces enough thread to reacharound the Equator every 11 minutes• 300 million pairs of shoes are madeevery year using <strong>Coats</strong>’ thread• 1 million teabags using <strong>Coats</strong>’ thread arebrewed every 10 minutes• Thomas Edison used <strong>Coats</strong>’ thread in1879 to invent the light bulb© <strong>GPG</strong> <strong>Group</strong> <strong>and</strong> <strong>Coats</strong> <strong>plc</strong> | Financial results for year ending 31 December 2012 Page 43
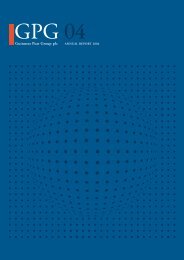
Geographical reach<strong>Coats</strong> is ‘at home’ in most countries across the world, with more than 20,000 employeesacross six continents <strong>and</strong> 70+ factories <strong>and</strong> 80 other facilities around the worldCountries in which<strong>Coats</strong> operatesManufacturing sites© <strong>GPG</strong> <strong>Group</strong> <strong>and</strong> <strong>Coats</strong> <strong>plc</strong> | Financial results for year ending 31 December 2012 Page 44
Heritage<strong>Coats</strong> is a company with more than 250 years of history1750s 1812 1826 1896 1986 1990s2000 2004James &PatrickClark beginwork inPaisley,Scotl<strong>and</strong>Clark’ssewingthreadplaced onthe marketJames<strong>Coats</strong>establishesFerguslieMills inPaisley,employing20 peopleMerged withClark familybusiness:J. & P. <strong>Coats</strong>,LtdAcquired byVantona Viyella:<strong>Coats</strong> Viyella <strong>plc</strong>M&A to strengthenthread position <strong>and</strong>diversify1991 – Tootal1999 - HickingPentecost (‘Barbour’)2001 - DMC IndustrialStrategic review:non-corebusinesses Jaeger<strong>and</strong> Viyella exited.<strong>Coats</strong> to focus onglobal threadbusinessAcquisitionby <strong>GPG</strong>Ferguslie Mills, PaisleyPioneered in Paisley, 6 cord, soft finish,cotton thread, became the leadingsewing thread used around the world,Peter <strong>Coats</strong>© <strong>GPG</strong> <strong>Group</strong> <strong>and</strong> <strong>Coats</strong> <strong>plc</strong> | Financial results for year ending 31 December 2012 Page 45
Vision, goals <strong>and</strong> principles<strong>Coats</strong> visionWe will be the world leaderin value added engineeredyarns <strong>and</strong> threads forindustrial <strong>and</strong> consumer use.We will develop <strong>and</strong> supplyhighly complementaryproducts <strong>and</strong> services,where they add significantvalue to customers.We will achieve successthrough customer-focusedinnovation <strong>and</strong> winningpropositions driven bymotivated people <strong>and</strong> globalteamwork.Goals that will help usachieve our visionPrinciples – the way webehave <strong>and</strong> work todeliver our three goals2015 Market goals toguide us to achievingour vision by 2020.By 2015 we will be:• Profitable sales growth• Increased productivity• Positive teamwork• Freedom to operate• Delivery – keep our promises• Openness <strong>and</strong> honesty• Customer led innovation• Energy for change• The leading global player in textile crafts• The leading global player in speciality threads <strong>and</strong> yarns• The leading value added partners to the apparel <strong>and</strong>footwear industries© <strong>GPG</strong> <strong>Group</strong> <strong>and</strong> <strong>Coats</strong> <strong>plc</strong> | Financial results for year ending 31 December 2012 Page 46
10 Key Segments<strong>Coats</strong> Industrial<strong>Coats</strong> Industrial Division provides thread, yarn <strong>and</strong> zips for industrial customers in apparel,footwear <strong>and</strong> speciality marketsIndustrial 2012 sales: $1.2bn• Apparel• Footwear• Speciality- Automotive- Bedding <strong>and</strong> furniture- Wire <strong>and</strong> cable- Flame retardant performance wear- Outdoor goods- Tyre cord weft- Sports goods- Feminine hygiene/medical- Filtration- Tea bags• Zips• Other- Embroidery- TrimsGlobal br<strong>and</strong> customers include:© <strong>GPG</strong> <strong>Group</strong> <strong>and</strong> <strong>Coats</strong> <strong>plc</strong> | Financial results for year ending 31 December 2012 Page 47
<strong>Coats</strong> Crafts<strong>Coats</strong> provides consumer textile crafts <strong>and</strong> reaches end-consumers via retailers in anumber of Crafts segmentsCrafts 2012 sales: $0.5bn• H<strong>and</strong>knitting• Consumer sewing• Embroidery• Haberdashery• Crochet• Lifestyle fabrics• Kits• Zips• Other- Kite flying thread- Needlework fabrics <strong>and</strong> canvas- Publications/ magazines- Felting yarnsCrafts br<strong>and</strong>s include:© <strong>GPG</strong> <strong>Group</strong> <strong>and</strong> <strong>Coats</strong> <strong>plc</strong> | Financial results for year ending 31 December 2012 Page 48
<strong>Coats</strong> is a responsible company‘<strong>Coats</strong> is proud to be a responsible company. But what doesresponsible mean?To be successful now <strong>and</strong> in the future, we need not only to bemindful of our financial <strong>and</strong> operational performance, but also torecognise the role our business plays within society, as part oflocal communities around the world, <strong>and</strong> the impact we have onthe environment.’Paul Forman,<strong>Group</strong> ChiefExecutive© <strong>GPG</strong> <strong>Group</strong> <strong>and</strong> <strong>Coats</strong> <strong>plc</strong> | Financial results for year ending 31 December 2012 Page 49
Managing responsiblyWe operate to thehighest ethical <strong>and</strong>employmentst<strong>and</strong>ards acrossall our globaloperations• Employing around20,000 people in safeworking conditions inover 70 countriesworldwide• Our global accidentrate is 83% lower thanthe industry average• Reducing ourgreenhouse gasemissions by over40% since 2000• Minimising the use ofraw materials, makingour operations evermore efficient• Supplying highquality, safeproducts for themanufacture of over10 billion garments<strong>and</strong> enough yarn toknit 65 millionscarves – everyyear• Building long-st<strong>and</strong>ingrelationships withcustomers <strong>and</strong>consumers for over250 years• Using the skills,time, energy <strong>and</strong>experience of ouremployees tosupport our localcommunities© <strong>GPG</strong> <strong>Group</strong> <strong>and</strong> <strong>Coats</strong> <strong>plc</strong> | Financial results for year ending 31 December 2012 Page 50
Behaving responsibly across our businessesOur products are manufactured with theutmost focus on quality, reliability <strong>and</strong> valuefor moneySeven strategic CRthemesWe strive to minimise our impact on theglobal <strong>and</strong> local environment• Our product safety st<strong>and</strong>ards are themost dem<strong>and</strong>ing in the industry• We use innovative design to minimiseresource use. For example, in Indiare-engineering one of our industrialthread cones led to a 30% reductionin plastic needed, without affectingstrength or performance• Employing technology to allow morechoice for our customers, theEcoVerde <strong>and</strong> Rowan br<strong>and</strong>s offerproducts made from recycled material• Since 2000 we have reduced ourannual energy consumption by nearly580 million kWh of electricity• In our continuing efforts to improve ourwaste water quality, we will exp<strong>and</strong>our use of reverse osmosis technology• We used over 140,000 tonnes of rawmaterials last year, but the wastegenerated only represented 3% ofthis totalCreating the best possible workingenvironment allows us to attract <strong>and</strong> retain atalented workforce to underpin ourworldwide operation• More than 95% of our employees in70 countries completed our thirdemployee engagement survey, wellabove the industry average of 79%• Our global accident rate is 83% lowerthan the industry average• Three Centres of Excellence developlocal programmes from our globalHR policesWe are proud to be part of thecommunities where we operate<strong>and</strong> we work to develop closerelationships with local people,business partners <strong>and</strong>community groups.By underst<strong>and</strong>ing the needs of ourcustomers <strong>and</strong> the br<strong>and</strong>s they supply, weare better placed to help them achieve theirgoals• <strong>Coats</strong> Sewing Solutions Servicesdevelops product lines directly withglobal br<strong>and</strong>ed customers <strong>and</strong>suppliers to meet strict performancecriteria• We are committed to working withothers in the industry to improveethical trade st<strong>and</strong>ards. In 2011 wejoined GAFTI, the Global Apparel,Footwear <strong>and</strong> Textile Initiative© <strong>GPG</strong> <strong>Group</strong> <strong>and</strong> <strong>Coats</strong> <strong>plc</strong> | Financial results for year ending 31 December 2012 Page 51
Our people<strong>Coats</strong>’ strength <strong>and</strong> marketleadership is based on thequality <strong>and</strong> commitment ofour peopleThe way we work to achieve our vision is guided byfive principles• Freedom to operate• Delivery (keep our promises)• Openness <strong>and</strong> honesty• Customer led innovation• Energy for changeOur overall Employee Engagement score in 2011 was 72%(industry norm of 69%), rising to 77% in 2012© <strong>GPG</strong> <strong>Group</strong> <strong>and</strong> <strong>Coats</strong> <strong>plc</strong> | Financial results for year ending 31 December 2012 Page 52
Health <strong>and</strong> safetyWe insist on the highest st<strong>and</strong>ards of health <strong>and</strong> safety across all of our operations. In2012 we had 0.51 recordable accidents per 100 full time employees, compared with theUSA Textile Mills average of 3.5 (OSHA, 2011).© <strong>GPG</strong> <strong>Group</strong> <strong>and</strong> <strong>Coats</strong> <strong>plc</strong> | Financial results for year ending 31 December 2012 Page 53
Further informationFor moreinformation:<strong>Coats</strong> <strong>plc</strong>www.coats.com<strong>Coats</strong> Industrialwww.coatsindustrial.com<strong>Coats</strong> Craftswww.coatscrafts.com© <strong>GPG</strong> <strong>Group</strong> <strong>and</strong> <strong>Coats</strong> <strong>plc</strong> | Financial results for year ending 31 December 2012 Page 54