GPG Group and Coats plc
Download Full Year Results Presentation PDF - Coats plc
Download Full Year Results Presentation PDF - Coats plc
- No tags were found...

You also want an ePaper? Increase the reach of your titles
YUMPU automatically turns print PDFs into web optimized ePapers that Google loves.
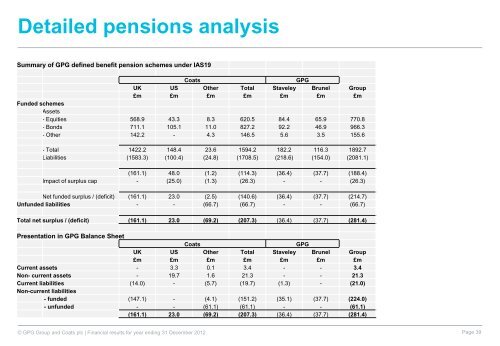
ADetailed p p e n d i x 2 pensions : D e t a i l e d Pensions analysis A n a l ys i sSummary of <strong>GPG</strong> defined benefit pension schemes under IAS19<strong>Coats</strong><strong>GPG</strong>UK US Other Total Staveley Brunel <strong>Group</strong>£m £m £m £m £m £m £mFunded schemesAssets- Equities 568.9 43.3 8.3 620.5 84.4 65.9 770.8- Bonds 711.1 105.1 11.0 827.2 92.2 46.9 966.3- Other 142.2 - 4.3 146.5 5.6 3.5 155.6- Total 1422.2 148.4 23.6 1594.2 182.2 116.3 1892.7Liabilities (1583.3) (100.4) (24.8) (1708.5) (218.6) (154.0) (2081.1)(161.1) 48.0 (1.2) (114.3) (36.4) (37.7) (188.4)Impact of surplus cap - (25.0) (1.3) (26.3) - - (26.3)Net funded surplus / (deficit) (161.1) 23.0 (2.5) (140.6) (36.4) (37.7) (214.7)Unfunded liabilities - - (66.7) (66.7) - - (66.7)Total net surplus / (deficit) (161.1) 23.0 (69.2) (207.3) (36.4) (37.7) (281.4)Presentation in <strong>GPG</strong> Balance Sheet<strong>Coats</strong><strong>GPG</strong>UK US Other Total Staveley Brunel <strong>Group</strong>£m £m £m £m £m £m £mCurrent assets - 3.3 0.1 3.4 - - 3.4Non- current assets - 19.7 1.6 21.3 - - 21.3Current liabilities (14.0) - (5.7) (19.7) (1.3) - (21.0)Non-current liabilities- funded (147.1) - (4.1) (151.2) (35.1) (37.7) (224.0)- unfunded - - (61.1) (61.1) - - (61.1)(161.1) 23.0 (69.2) (207.3) (36.4) (37.7) (281.4)© <strong>GPG</strong> <strong>Group</strong> <strong>and</strong> <strong>Coats</strong> <strong>plc</strong> | Financial results for year ending 31 December 2012 Page 39