analyses
Студије и анализе - Републички завод за статистику
Студије и анализе - Републички завод за статистику

You also want an ePaper? Increase the reach of your titles
YUMPU automatically turns print PDFs into web optimized ePapers that Google loves.
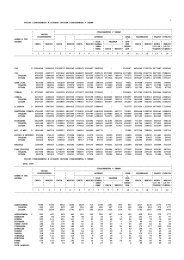
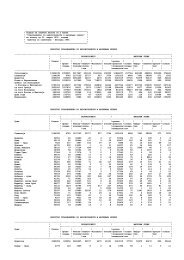
Studies and <strong>analyses</strong>Republic of Serbia2. SYSTEM OF NATIONAL ACCOUNTS FOR THE TOTAL ECONOMYACCOUNT 0: GOODS AND SERVICES ACCOUNTmill. RSDResources 1997 1998 1999 2000 2001 2002 2003 2004 2005 2006P.1 Output 249136,0 332589,3 408488,6 836358,0 1527428,9 1920365,3 2123731,8 2664390,0 3180723,9 4007747,9P.11 Market output 196411,8 266790,1 325327,3 671622,3 1208539,0 1524320,2 1676499,0 2161131,5 2636909,9 3389660,2P.12 Output for own final use 23595,4 30367,0 43102,7 84339,9 151334,1 163788,0 179193,9 215551,0 227413,4 255746,0P.13 Other non-market output 29128,8 35432,2 40058,6 80395,8 167555,8 232257,1 268038,9 287707,5 316400,6 362341,7D.21 Taxes on products 11512,8 17128,0 19388,2 36753,3 111363,7 181952,8 218180,4 264629,9 329485,3 361612,2D.31 Subsidies on products ( - ) 1399,5 1880,2 1992,6 3610,9 22563,5 34214,5 30973,7 34466,9 39401,5 35211,3P.7 Imports of goods and services 1) 30680,3 48993,6 37388,8 64730,6 323640,1 415772,0 495609,4 726426,3 834498,7 1036867,9P.71 Imports of goods 27150,9 43037,5 33745,3 57906,8 289448,8 367633,6 438597,3 640501,6 712966,2 879261,9P.72 Imports of services 3529,4 5956,1 3643,5 6823,8 34191,3 48138,4 57012,1 85924,7 121532,5 157606,0Disposable resources 289929,6 396830,7 463273,0 934231,0 1939869,2 2483875,6 2806547,9 3620979,3 4305306,4 5371016,7Uses 1997 1998 1999 2000 2001 2002 2003 2004 2005 2006P.2 Intermediate consumption 137536,5 184681,5 219290,7 482590,1 847652,7 1084272,9 1173331,1 1506454,2 1778867,2 2346383,9P.3 Final consumption expenditure 115196,4 160629,2 198887,1 376162,0 799136,6 1040482,5 1146500,3 1340600,1 1599682,5 1859530,8P.31 Individual consumption expenditure 99737,4 141062,2 176086,0 335086,7 709292,1 925871,5 1015500,0 1222023,8 1492528,6 1744465,0P.32 Collective consumptionexpenditure 15459,0 19567,0 22801,1 41075,3 89844,5 114611,0 131000,3 118576,3 107153,9 115065,8P.51 Gross fixed capital formation 12583,7 16604,1 22650,7 48842,2 81292,8 120502,0 188874,8 265714,2 319858,9 412752,1P.52 Changes in inventories 2) 2748,6 -1065,2 -1008,9 -15100,7 24489,5 16187,6 38511,2 167020,0 122660,3 125378,4P.6 Exports of goods and services 1) 21864,4 35981,1 23453,4 41737,4 187297,6 222430,6 259330,5 341190,8 484237,5 626971,5P.61 Exports of goods 17308,8 28317,8 18673,5 33008,3 126282,3 150496,6 177722,0 227925,2 339806,1 446080,0P.62 Exports of services 4555,6 7663,3 4779,9 8729,1 61015,3 71934,0 81608,5 113265,6 144431,4 180891,5Used resources 289929,6 396830,7 463273,0 934231,0 1939869,2 2483875,6 2806547,9 3620979,3 4305306,4 5371016,7Republic of SerbiaACCOUNT 1: PRODUCTION ACCOUNTmill. RSDResources 1997 1998 1999 2000 2001 2002 2003 2004 2005 2006P.1 Output 249136,0 332589,3 408488,6 836358,0 1527428,9 1920365,3 2123731,8 2664390,0 3180723,9 4007747,9P.11 Market output 196411,8 266790,1 325327,3 671622,3 1208539,0 1524320,2 1676499,0 2161131,5 2636909,9 3389660,2P.12 Output for own final use 23595,4 30367,0 43102,7 84339,9 151334,1 163788,0 179193,9 215551,0 227413,4 255746,0P.13 Other non-market output 29128,8 35432,2 40058,6 80395,8 167555,8 232257,1 268038,9 287707,5 316400,6 362341,7D.21 Taxes on products 11512,8 17128,0 19388,2 36753,3 111363,7 181952,8 218180,4 264629,9 329485,3 361612,2D.31 Subsidies on products ( - ) 1399,5 1880,2 1992,6 3610,9 22563,5 34214,5 30973,7 34466,9 39401,5 35211,3UsesP.2 Intermediate consumption 137536,5 184681,5 219290,7 482590,1 847652,7 1084272,9 1173331,1 1506454,2 1778867,2 2346383,9B.1g Gross domestic product 121712,8 163155,6 206593,5 386910,3 768576,4 983830,7 1137607,4 1388098,8 1691940,5 1987764,9K.1 Consumption of fixed capital ( - ) 23962,7 29175,2 41166,9 69605,6 167172,2 200958,7 222321,4 231311,2 259117,9 294343,8B.1n Net domestic product 97750,1 133980,4 165426,6 317304,7 601404,2 782872,0 915286,0 1156787,6 1432822,6 1693421,11) The trade of goods and services with Montenegro included.2) From 2004 the item “changes in inventories” contains statistical discrepancy.Statistical Office of the Republic of Serbia 153