P&G 2009 Annual Report – AnnualReports.com - Procter & Gamble
P&G 2009 Annual Report – AnnualReports.com - Procter & Gamble
P&G 2009 Annual Report – AnnualReports.com - Procter & Gamble

You also want an ePaper? Increase the reach of your titles
YUMPU automatically turns print PDFs into web optimized ePapers that Google loves.
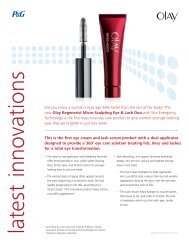
Designed to Lead<br />
<strong>2009</strong> <strong>Annual</strong> <strong>Report</strong>
Contents<br />
A.G. Lafley Letter to Shareholders<br />
Bob McDonald Letter to Shareholders<br />
Touching Lives<br />
P&G Brands —Designed to Be Leaders<br />
Billion- and Half-Billion Dollar Brands<br />
Improving Life<br />
P&G Leaders —Built from Within<br />
Corporate Officers<br />
Board of Directors<br />
P&G at a Glance<br />
Financial Contents<br />
Shareholder Information<br />
11-Year Financial Summary<br />
Financial Highlights<br />
FINANCIAL SUMMARY (UNAUDITED)<br />
1<br />
5<br />
8<br />
10<br />
12<br />
16<br />
18<br />
24<br />
25<br />
26<br />
27<br />
72<br />
73<br />
Amounts in millions, except per share amounts <strong>2009</strong> 2008 2007 2006 2005<br />
Net Sales $79,029 $81,748 $74,832 $66,724 $55,292<br />
Operating In<strong>com</strong>e 16,123 16,637 15,003 12,916 10,026<br />
Net Earnings 13,436 12,075 10,340 8,684 6,923<br />
Net Earnings Margin from Continuing Operations 14.3% 14.4% 13.4% 12.7% 12.0%<br />
Diluted Net Earnings per Common Share from Continuing Operations $ 3.58 $ 3.56 $ 2.96 $ 2.58 $ 2.43<br />
Diluted Net Earnings per Common Share<br />
Dividends per Common Share<br />
NET SALES<br />
(in billions of dollars)<br />
05<br />
06<br />
07<br />
08<br />
09<br />
OPERATING CASH FLOW<br />
(in billions of dollars)<br />
05<br />
06<br />
07<br />
08<br />
09<br />
$8.6<br />
$55.3<br />
$11.4<br />
$66.7<br />
$74.8<br />
$13.4<br />
$81.7<br />
$79.0<br />
Note: Previous period results have been amended to exclude the results of the Folgers coffee<br />
business from continuing operations. For more information refer to Note 12 on page 71.<br />
$15.0<br />
$14.9<br />
4.26 3.64 3.04 2.64 2.53<br />
1.64 1.45 1.28 1.15 1.03<br />
DILUTED NET EARNINGS<br />
(per <strong>com</strong>mon share)<br />
05<br />
06<br />
07<br />
08<br />
09<br />
$2.53<br />
$2.64<br />
$3.04<br />
$3.64<br />
$4.26
A.G. Lafley<br />
Chairman of the Board<br />
We faced even greater challenges in fiscal <strong>2009</strong> as we<br />
encountered one of the most difficult economic environments<br />
in decades. Shortly after we began the fiscal year, oil reached<br />
an all-time high of $147 per barrel. In September, following<br />
the Lehman Brothers bankruptcy, credit markets stopped<br />
functioning normally. This impacted suppliers, retailers and<br />
distributors, some of whom went out of business and many of<br />
whom significantly reduced inventory levels to conserve cash.<br />
The credit crisis, <strong>com</strong>bined with falling housing prices and<br />
equity markets, led to a severe economic contraction in the U.S.<br />
and most other developed countries. Nearly 30 million people<br />
lost their jobs worldwide and consumer behavior changed<br />
dramatically. Consumers pulled back on discretionary purchases<br />
and pushed relentlessly for the best value in nondiscretionary<br />
categories. Global economic growth stopped —GDP declined<br />
from +4% during the first quarter of calendar 2008 to -6% in<br />
the fourth quarter, a ten-point swing.<br />
Economies also slowed in developing markets —in China, Central<br />
and Eastern Europe and the Middle East. These markets, which<br />
had been growing GDP about +6%, slowed to an average -1%<br />
during the fourth quarter of 2008 —a seven-point swing.<br />
Global anxiety and risk aversion drove a flight to the safety<br />
of U.S. dollars, resulting in the swiftest, broadest and deepest<br />
foreign exchange move in modern times.<br />
Commodity cost and currency exchange rate volatility placed<br />
tremendous pressure on our business. We incurred roughly<br />
$2 billion in net <strong>com</strong>modity and energy costs this year, on top<br />
of about $1 billion in the prior year. Foreign exchange reduced<br />
P&G’s fiscal <strong>2009</strong> sales by about four percentage points,<br />
or approximately $4 billion, and profit by more than $1 billion.<br />
Consumer spending declined and volume growth in the broad<br />
majority of categories in which we <strong>com</strong>pete slowed to an average<br />
of 1–2%, versus 3–4% in the prior year.<br />
The <strong>Procter</strong> & <strong>Gamble</strong> Company 1<br />
When I became CEO in 2000, P&G faced some of the most demanding<br />
challenges in the Company’s long history. We made the strategic choices<br />
necessary to get P&G back on track to sustainable growth. Over<strong>com</strong>ing the<br />
challenges in 2000 made us a better and more focused <strong>com</strong>pany, and in<br />
the years since, we have designed P&G to grow consistently and reliably.<br />
BALANCING NEAR-TERM RESULTS<br />
AND LONG-TERM GROWTH<br />
We made two critical choices to deal with this macroeconomic<br />
environment: (1) to focus on disciplined cash and cost<br />
management and (2) to invest in capacity, innovation and<br />
consumer value this year to ensure P&G is leading and<br />
growing market share when we <strong>com</strong>e out of the recession.<br />
We focused first on cash and costs to protect the financial<br />
foundation of our businesses. We increased prices to recover<br />
higher <strong>com</strong>modity costs and foreign exchange transaction<br />
impacts. Despite $4 billion in price increases, we’ve held<br />
global value shares across the majority of categories, which<br />
is a reflection of P&G brands’ strength with consumers and<br />
retail customers. We knew that increased pricing would lead<br />
to market share volatility, and even some short-term share loss.<br />
We also knew higher prices might affect consumption in some<br />
more-discretionary categories. We were willing to accept these<br />
short-term consequences, however, to maintain investmentgrade<br />
financial health.<br />
We made the cash utilization choices necessary to maintain<br />
our strong AA- credit rating, including temporarily suspending<br />
share repurchases. Still, we repurchased over $6 billion in stock,<br />
retired another $2.5 billion as part of the Folgers divestiture,<br />
and returned over 100% of net earnings to shareholders<br />
through a <strong>com</strong>bination of dividends and share count reduction.<br />
With our financial house in order, we focused next on<br />
innovation and brand-building. We identified and funded<br />
product innovation and marketing initiatives across the business,<br />
with an emphasis on growing profitable value share in P&G’s<br />
core categories. We also maintained our <strong>com</strong>mitment to<br />
research and development investments and we delivered strong<br />
consumer <strong>com</strong>munication programs that emphasized the<br />
powerful performance-based value our products provide.
2 The <strong>Procter</strong> & <strong>Gamble</strong> Company<br />
We’ve continued to make strategic investments to generate<br />
strong growth in future years. We are investing 4% of sales<br />
in capital spending, including funding for new manufacturing<br />
capacity to support future growth. Over the next five years,<br />
we will add 20 new manufacturing facilities —13 of which have<br />
already been announced. Almost all of these facilities are in<br />
developing markets, and almost all will be multi-productcategory<br />
facilities. By migrating our manufacturing base closer<br />
to the consumers we’ll be serving, P&G will lower costs and<br />
enable better value for more consumers.<br />
We delivered results in fiscal <strong>2009</strong> that reflect these choices.<br />
We delivered organic sales and EPS growth and maintained<br />
operating margin while delivering strong free cash flow —the<br />
financial lifeblood of the business.<br />
Overall, our choices balanced short-term returns and long-term<br />
investments.<br />
��Organic sales increased 2%. Net sales declined 3%,<br />
to $79 billion.<br />
��Core earnings per share increased 8%. Excluding the negative<br />
foreign exchange impact, core earnings per share would have<br />
increased strong double digits. Diluted net earnings per share<br />
increased 17% for the fiscal year.<br />
��We delivered strong free cash flow productivity at more<br />
than 100% of earnings, excluding the gain from the Folgers<br />
divestiture.<br />
And, we increased our quarterly dividend 10% in a year<br />
when many large <strong>com</strong>panies reduced or eliminated dividends.<br />
Fiscal <strong>2009</strong> marked the 53 rd consecutive year in which P&G<br />
increased dividends.<br />
DESIGNED TO LEAD<br />
It’s too early to tell what the economic future holds. We must<br />
deal with what’s in front of us. We must be agile and flexible.<br />
We must stay financially strong so we can respond and continue<br />
to lead. If the recession continues longer than expected, we must<br />
be prepared to deal with that reality. If economies recover faster<br />
than anticipated, we must be equally prepared to take advantage<br />
of new growth opportunities.<br />
P&G is well-positioned to do this. We’ve designed P&G to<br />
lead with:<br />
��Clear strategies<br />
��The core strengths required to win in our industry<br />
��Rigorous cash and cost discipline<br />
��The most diverse and experienced leadership team in<br />
the Company’s history<br />
STRATEGY FOR GROWTH<br />
Three strategic choices drove virtually all of P&G’s top-line,<br />
bottom-line, and shareholder growth this decade.<br />
Our first choice was to focus on P&G’s core businesses and<br />
leading billion-dollar brands, to win with the biggest and<br />
strongest retail customers, and to win in the most important<br />
countries. We’ve done that.<br />
Nearly 80% of P&G’s sales and profit growth this decade has<br />
<strong>com</strong>e from 10 businesses, including Baby Care, Blades and<br />
Razors, Fabric Care, Family Care, Feminine Care, Home Care,<br />
Oral Care, Prestige Fragrances, Retail Hair Care and Skin Care.<br />
About 75% of sales and profit growth has <strong>com</strong>e from P&G’s<br />
leading billion-dollar brands.<br />
We chose to shift our business portfolio to more Beauty and<br />
Personal Care businesses. We’ve done that. The percentage of<br />
P&G sales in more capital-intensive Paper and Food businesses<br />
went from 42% at the beginning of the decade to 25%. At the<br />
same time, the percentage of sales in more asset-efficient,<br />
faster-growing, higher-margin businesses has increased from<br />
18% to 33% over the same period.<br />
Beauty, Personal Care and Health Care have accounted for more<br />
than 60% of sales and profit growth in the past eight years.<br />
Our third strategic choice was to extend the availability and<br />
affordability of P&G brands to more low-in<strong>com</strong>e consumers,<br />
particularly in developing markets. We’ve done that. Developing<br />
markets represent 32% of sales, up from about 20% at the<br />
beginning of the decade, and have contributed 42% of sales<br />
growth and 29% of profit growth.<br />
On an aggregate basis, P&G has a 19% share in developing<br />
markets and is growing steadily by about half a share point a<br />
year. We now have a developing-market business which, at<br />
about $25 billion in annual sales, is over five times the average<br />
developing-market sales of our major <strong>com</strong>petitors.<br />
With these three strategies, P&G has delivered strong growth<br />
over the past decade. We’ve more than doubled sales, from<br />
$38 billion to $79 billion. We’ve delivered core earnings-per-share<br />
growth of 12%, on average, since 2001. And we’ve generated<br />
about $70 billion in free cash flow.<br />
CORE STRENGTHS TO WIN<br />
In addition to clear where-to-play strategies, we have chosen<br />
to focus on five core strengths that are required to win in the<br />
consumer products industry: consumer understanding, brandbuilding,<br />
innovation, go-to-market capability, and scale.<br />
P&G is designed to lead in each of these areas.<br />
Note: An explanation and reconciliation of organic sales and free cash flow for <strong>2009</strong> are<br />
provided on page 48. Explanations of core earnings per share and free cash flow productivity<br />
are provided in footnotes (2), (3) and (4) of the P&G <strong>Report</strong> Card on page 3.
��No <strong>com</strong>pany in the world has invested more in consumer<br />
and market research than P&G. We interact with more<br />
than five million consumers each year in nearly 60 countries<br />
around the world. We conduct over 15,000 research studies<br />
every year. We invest more than $350 million a year in<br />
consumer understanding. This results in insights that tell us<br />
where the innovation opportunities are and how to serve and<br />
<strong>com</strong>municate with consumers.<br />
��P&G is the innovation leader in our industry. Virtually all<br />
the organic sales growth we’ve delivered in the past nine<br />
years has <strong>com</strong>e from new brands and new or improved<br />
product innovation. We continually strengthen our innovation<br />
capability and pipeline by investing two times more, on average,<br />
than our major <strong>com</strong>petitors. In addition, we multiply our<br />
internal innovation capability with a global network of<br />
innovation partners outside P&G. More than half of all product<br />
innovation <strong>com</strong>ing from P&G today includes at least one major<br />
<strong>com</strong>ponent from an external partner. The IRI New Product<br />
Pacesetter <strong>Report</strong> ranks the best-selling new products in<br />
our industry in the U.S. every year. Over the past 14 years,<br />
P&G has had 114 top 25 Pacesetters —more than our six<br />
largest <strong>com</strong>petitors <strong>com</strong>bined. In the last year alone, P&G<br />
had five of the top 10 new product launches in the U.S. and<br />
10 of the top 25.<br />
��P&G is the brand-building leader of our industry. We’ve built<br />
the strongest portfolio of brands in the industry with 23 billiondollar<br />
brands and 20 half-billion-dollar brands. These 43 brands<br />
account for 85% of sales and more than 90% of profit.<br />
Twelve of the billion-dollar brands are the #1 global market<br />
share leaders of their categories. The majority of the balance<br />
are #2. As a group, P&G’s billion-dollar brands have grown<br />
sales at an average rate of 11% per year for the entire decade.<br />
��We’ve established industry-leading go-to-market<br />
capabilities. P&G is consistently ranked by leading retailers<br />
in industry surveys as a preferred supplier and as the industry<br />
leader in a wide range of capabilities including clearest<br />
<strong>com</strong>pany strategy, brands most important to retailers, strong<br />
business fundamentals and innovative marketing programs.<br />
��Over the decades, we have also established significant scale<br />
advantages as a total <strong>com</strong>pany and in individual categories,<br />
countries and retail channels. P&G’s scale advantage is<br />
driven as much by knowledge sharing, <strong>com</strong>mon systems<br />
and processes, and best practices as it is by size and scope.<br />
These scale benefits enable us to deliver consistently superior<br />
consumer and shareholder value.<br />
P&G REPORT CARD<br />
Progress Against P&G’s Goals and Strategies<br />
GROWTH RESULTS<br />
Average annual Goals <strong>2009</strong> 2001–<strong>2009</strong><br />
Organic Sales Growth (1) 4–6% 2% 5%<br />
Core Earnings per Share Growth 10% 8% (2) 12% (3)<br />
Free Cash Flow Productivity (4) 90% 102% 112%<br />
GROWTH STRATEGIES (2001 – <strong>2009</strong>)<br />
Grow from the core: Leading Brands, Big Markets,<br />
Top Customers<br />
Volume up 7%,<br />
on average, for<br />
P&G’s 23 billiondollar<br />
brands (5)<br />
Volume up 6%,<br />
on average, for<br />
P&G’s top 16<br />
countries (6)<br />
Volume up 6%,<br />
on average,<br />
for P&G’s top 10<br />
retail customers (6)<br />
Develop faster-growing, higher-margin, more asset-efficient<br />
businesses<br />
Beauty sales<br />
more than<br />
doubled to<br />
$18.8 billion;<br />
profits nearly<br />
tripled to<br />
$2.5 billion<br />
Health Care<br />
sales more than<br />
doubled to<br />
$13.6 billion;<br />
profit increased<br />
fourfold to<br />
$2.4 billion<br />
Home Care<br />
sales more than<br />
doubled; profits<br />
more than tripled<br />
Accelerate growth in developing markets and among<br />
low-in<strong>com</strong>e consumers<br />
Developing<br />
market sales up<br />
15% per year<br />
Over 40% of<br />
total <strong>com</strong>pany<br />
sales growth<br />
from developing<br />
markets<br />
Developing market<br />
profit margins<br />
<strong>com</strong>parable to<br />
developed-market<br />
margins<br />
(1) Organic sales exclude the impacts of acquisitions, divestitures and foreign exchange,<br />
which were 6%, on average, in 2001–<strong>2009</strong>.<br />
(2) Core earnings per share for <strong>2009</strong> excludes a positive $0.14 per share impact from<br />
significant adjustments to tax reserves in 2008, a positive $0.68 per share impact<br />
from discontinued operations in <strong>2009</strong> and a negative $0.09 per share impact<br />
from incremental Folgers-related restructuring charges in <strong>2009</strong>.<br />
(3) Core earnings per share for 2001–<strong>2009</strong> excludes a negative $0.61 per share impact<br />
in 2001 from the Organization 2005 restructuring program charges and amortization<br />
of goodwill and intangible assets, positive impacts of $0.06 and $0.68 per share<br />
earnings from discontinued operations in 2001 and <strong>2009</strong>, respectively and a<br />
negative $0.09 per share impact from incremental Folgers-related restructuring<br />
charges in <strong>2009</strong>.<br />
(4) Free cash flow productivity is the ratio of operating cash flow less capital spending<br />
to net earnings. For <strong>2009</strong>, we have excluded $2,011 million from net earnings due<br />
to the gain on the sale of the Folgers business. Free cash flow productivity in <strong>2009</strong><br />
equals $14,919 million of operating cash flow less $3,238 million in capital spending<br />
divided by net earnings of $11,425 million which excludes the Folgers gain.<br />
Reconciliations of free cash flow and free cash flow productivity for 2001–<strong>2009</strong><br />
are provided on page 48.<br />
(5) Excludes the impact of adding newly acquired billion-dollar brands to the portfolio.<br />
(6) Excludes the impact of adding Gillette.<br />
The <strong>Procter</strong> & <strong>Gamble</strong> Company 3
4 The <strong>Procter</strong> & <strong>Gamble</strong> Company<br />
CASH AND COST MANAGEMENT<br />
P&G’s cash productivity —the percentage of earnings we convert<br />
into cash —has averaged over 100% since the beginning of<br />
the decade, consistently among the very best in the industry.<br />
This cash productivity allows us to maintain the Company’s<br />
excellent credit rating, to pay a strong dividend every year,<br />
and to have the flexibility to investin the business organically<br />
or through mergers and acquisitions.<br />
Our cash position is consistently strong because we are<br />
relentlessly focused on working-capital management.<br />
For example, P&G is the receivables leader of the industry,<br />
operating more efficiently with fewer days of receivables<br />
outstanding than any consumer products <strong>com</strong>petitor.<br />
We’re equally rigorous about managing costs. We have reduced<br />
overhead costs as a percentage of sales by more than 300 basis<br />
points since 2001, and we continue to focus on reducing<br />
overhead costs consistently and steadily year after year.<br />
In addition to reducing costs, we’ve also focused on increasing<br />
productivity in everything we do. Sales per employee has grown<br />
from $363,000 in 2000 to $585,000 in <strong>2009</strong>, and profit per<br />
employee has increased from $32,000 to $84,000. We have<br />
doubled the productivity of our R&D organization since 2000<br />
even as we’ve be<strong>com</strong>e more innovative. This means that P&G<br />
can now support an additional $44 billion in sales with virtually<br />
the same number of R&D employees we had nearly a decade<br />
ago. We’ve be<strong>com</strong>e so much more productive because we<br />
continually innovate how we innovate and because we are<br />
working with such a large and diverse global network of<br />
external innovation partners.<br />
This productivity discipline ensures that P&G has the flexibility<br />
and the resources to invest in growth even in the most<br />
challenging environments.<br />
LEADERSHIP FOR THE NEXT DECADE<br />
P&G has earned a reputation as one of the world’s best<br />
<strong>com</strong>panies for leaders. We work hard at leadership development<br />
because, as a build-from-within <strong>com</strong>pany, our future success is<br />
entirely dependent on the ongoing strength of our talent pipeline.<br />
Succession planning is an important element of this focus on<br />
leadership. We are methodical about identifying multiple<br />
succession candidates for every senior executive leadership<br />
position and then ensuring each individual gets the experience<br />
to be ready for the job.<br />
We began planning for my successor as CEO several years ago.<br />
Bob McDonald emerged as the right choice to lead P&G in the<br />
decade ahead. Bob has nearly 30 years of brand-building, market<br />
development, global business unit and global operations<br />
leadership experience across the Company and around the world.<br />
I’ve worked with him for most of my career at P&G. We’ve worked<br />
side-by-side over the past decade.<br />
I am equally confident in the leadership team that we’ve put<br />
in place to lead P&G in the decade ahead. This executive team<br />
has more than 1000 years of collective industry experience —<br />
in every part of P&G’s business, in developed and developing<br />
markets, in good times and through business and economic<br />
crises. This is a team you can count on.<br />
I will continue to be engaged: I will chair the Board; I will<br />
continue to provide advice and counsel to Bob and will join<br />
him at business strategy, innovation program and talent<br />
development reviews. I will continue to be involved in coaching<br />
senior managers.<br />
The breadth, depth and quality of management —and of the<br />
organization as a whole —is another way we design P&G to<br />
lead. I could not be more confident in the new leadership team<br />
or in the 135,000 P&Gers who lead our business every day.<br />
DESIGNED TO CREATE VALUE THROUGH LEADERSHIP<br />
In the end, P&G’s <strong>com</strong>mitment is to create value for its<br />
shareholders (including employees and retirees, who hold about<br />
10% of P&G shares). This decade, we’ve fulfilled that <strong>com</strong>mitment.<br />
When I became CEO on June 8, 2000, P&G was the 31 st largest<br />
<strong>com</strong>pany in sales and the 22 nd largest <strong>com</strong>pany in profit among<br />
the Fortune 500. In the nine years since, P&G has moved to 20 th<br />
in sales and to 9 th in profit.<br />
The Company’s market capitalization in June 2000 was<br />
$74 billion —35th highest among the Fortune 500. Since then,<br />
P&G’s stock has appreciated by about 80% while the S&P 500<br />
Index has declined approximately 30%. P&G’s market capitalization<br />
is now roughly $150 billion, making P&G one of the 10<br />
most valuable <strong>com</strong>panies in the United States.<br />
Our business and financial performance is the result of clear<br />
choices and extraordinary <strong>com</strong>mitment and capability at every<br />
level of our Company. I’ve never been prouder of this Company<br />
and its people than I am today. We have designed P&G to lead<br />
through virtually any economic environment —and as a result,<br />
P&G remains a <strong>com</strong>pany you can count on to improve<br />
consumers’ lives and to create superior shareholder value.<br />
A.G. Lafley<br />
Chairman of the Board<br />
August 7, <strong>2009</strong>
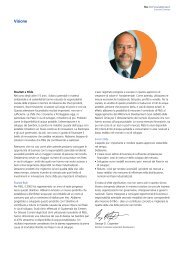
Bob McDonald<br />
President and Chief Executive Officer<br />
THE POWER OF PURPOSE<br />
In fact, leading change on a foundation of continuity has been at<br />
the heart of P&G’s success throughout its history. P&G will be<br />
172 years old this October. We have grown through multiple economic<br />
cycles: boom years, recessions, the Great Depression. We’ve<br />
also grown in the face of unrelenting change: two world wars,<br />
economic crises, massive technological change, significant demographic<br />
shifts and continuously changing consumer expectations.<br />
Despite all this, P&G’s total shareholder return has outperformed<br />
the industry and broader markets over the long term. Why?<br />
I believe it <strong>com</strong>es down to one simple and remarkably constant<br />
factor: the clarity and constancy of P&G’s Purpose. Since the<br />
Company was founded, we’ve been in the business of providing<br />
daily essentials that improve the quality of people’s lives. We<br />
help people care for their babies, pets and homes. We make<br />
everyday chores easier to do. We help people look and feel<br />
better. We’ve stayed true to the inspiring Purpose of touching<br />
and improving people’s lives in meaningful ways.<br />
It’s at times like we’re living in today —when change is volatile<br />
and unsettling, when norms we’re accustomed to no longer<br />
seem certain —that clarity of Purpose matters more than ever.<br />
More than a year ago, A.G. and I, along with the vice chairs and<br />
other senior leaders, began the effort to renew P&G’s strategies.<br />
We began this work with P&G’s Purpose in mind. We have now<br />
updated the Company’s growth strategies and identified a few<br />
critical interventions needed to strengthen our businesses —fully<br />
acknowledging the economic crisis in front of us but equally<br />
focused on the longer-term growth of our Company. I want to<br />
use this, my first letter to shareholders as CEO, to explain our<br />
choices and decisions. This will help you to clearly see P&G’s<br />
vision for growth in the decade ahead.<br />
The <strong>Procter</strong> & <strong>Gamble</strong> Company 5<br />
P&G has a solid foundation for growth. Our strategies are working.<br />
Our billion-dollar and half-billion-dollar brands are among the strongest<br />
in the world. P&G’s core strengths are those that matter most to winning<br />
in our industry. Our relationships with retailers, suppliers and innovation<br />
partners are enormous sources of <strong>com</strong>petitive advantage. And the leadership<br />
team now in place has been carefully groomed through experience and<br />
coaching to lead P&G in the decade ahead. We are building on a rock-solid<br />
foundation of continuity. This is one of P&G’s greatest advantages.<br />
PURPOSE-INSPIRED GROWTH STRATEGY:<br />
“WHERE TO PLAY” CHOICES<br />
Our single, unifying growth strategy is tightly linked to our<br />
Purpose: “We will grow by touching and improving the lives of<br />
more consumers in more parts of the world…more <strong>com</strong>pletely.”<br />
Specifically, we will:<br />
��Grow our leading global brands and core categories —<br />
with an unrelenting focus on innovation<br />
��Build business with underserved and unserved consumers<br />
��Continue to grow and develop faster-growing, structurally<br />
attractive businesses with global leadership potential.<br />
We will create abundant growth opportunities in each of<br />
these areas.<br />
1) Growing our Core<br />
Our billion-dollar brands and aspiring billion-dollar brands —<br />
43 brands in total —represent 85% of P&G’s sales and more<br />
than 90% of profit.<br />
We will continue to focus sharply on our core businesses and<br />
brands because this is the primary way we touch and improve<br />
lives —and there is plenty of room to keep growing our core<br />
brands and categories.<br />
��Global Household Care is a $200 billion market —and P&G’s<br />
global share is about 20%.<br />
��Consumer Health Care is a $240 billion market; P&G is a<br />
market leader with just a 5% share.<br />
��Beauty & Grooming is a $300 billion market and P&G is<br />
leading, but with only a 13% share.
6 The <strong>Procter</strong> & <strong>Gamble</strong> Company<br />
P&G Growth Strategy: Touching and improving more consumers’ lives in more parts of the world more <strong>com</strong>pletely<br />
WHERE TO PLAY:<br />
1. Grow leading, global brands and core categories<br />
2. Build business with underserved and unserved consumers<br />
3. Continue to grow and develop faster-growing, structurally<br />
attractive businesses with global leadership potential<br />
We will focus on growing market share profitably across all<br />
these businesses. As economies recover, I am confident we will<br />
be positioned to extend our leading market share positions.<br />
2) Winning with underserved and unserved consumers<br />
The second growth strategy is new —to build our business with<br />
underserved and unserved consumers. We’ll do this in three ways.<br />
We are increasing our presence in developing markets.<br />
The opportunities here are boundless. Eighty-six percent of the<br />
world’s population is in developing markets and we have<br />
strong share positions in the most important of these markets.<br />
In Blades and Razors, we’re #1 in the Central & Eastern Europe,<br />
Middle East and Africa region, Latin America, Greater China<br />
and developing Asia. In Shampoo and Diapers, we’re #1 or #2.<br />
And in Laundry, Feminine Care and Oral Care, we are ranked<br />
#1, #2 or #3 in market share.<br />
We will continue to increase the percentage of total <strong>com</strong>pany<br />
sales from these markets by building consumers’ awareness of<br />
the performance, quality and value of our brands and making<br />
our products more accessible and affordable for consumers.<br />
We are extending our distribution systems to reach<br />
more consumers through underserved retail channels.<br />
We’re pursuing opportunities in four priority areas:<br />
Drug, Pharmacy and Perfumery: This is a significant opportunity<br />
across many parts of our business, and a strategic focus for<br />
Beauty & Grooming.<br />
High Frequency Stores: Already, high frequency stores would be<br />
our single largest customer if they were a single retailer. They<br />
are growing at rates equal to the modern retail trade and are<br />
the main source of our products for the majority of developingmarket<br />
consumers.<br />
Export Operations: This is another underdeveloped channel<br />
with meaningful potential. It’s the primary way P&G reaches<br />
consumers in newly emerging markets where P&G does not yet<br />
have on-the-ground operations. This channel sets the stage for<br />
more aggressive portfolio expansion as new economies develop.<br />
HOW TO WIN:<br />
1. Drive Core P&G Strengths in consumer understanding,<br />
brand building, innovation and go to market<br />
2. Simplify, Scale and Execute for <strong>com</strong>petitive advantage<br />
3. Lead change to win with consumers and customers<br />
E-<strong>com</strong>merce: Our “Consumer is boss” focus means we must be<br />
available to consumers when and where they seek to research<br />
or purchase P&G products. Increasingly, that’s online. We do<br />
less than a billion dollars in online sales today, and we believe<br />
we can increase that substantially over the next few years.<br />
We see e-<strong>com</strong>merce as part of a broader effort to establish<br />
online connections with consumers that build our brands and<br />
our business with retail partners.<br />
We are expanding brand and product portfolios.<br />
A third action we are taking to serve more consumers is to<br />
create broader and deeper product portfolios.<br />
To do this, we will expand our categories vertically into the<br />
premium end of our markets as we have done successfully<br />
with Tide Total Care, Clairol Perfect 10, Gillette Fusion, Venus<br />
Embrace, Olay Pro-X, Dawn Hand Renewal, Secret Clinical<br />
Strength and Cascade Action Pacs. By bringing betterperforming,<br />
specially targeted products to market, we will<br />
increase consumer value and drive category sales for retailers.<br />
We will simultaneously expand our portfolio into the valuepriced<br />
segment. The successful launches of Mach3 disposable<br />
razors in the U.S., Pampers Simply Dry diapers in Germany and<br />
Naturella feminine care pads into the Arabian Peninsula are<br />
three recent examples.<br />
We will also expand our core brands horizontally into adjacent<br />
product segments. Febreze Candles, Bounce Dryer Bar and Tide<br />
Stain Release are recent examples of how we have done this.<br />
As we stretch our portfolio vertically and horizontally, we will<br />
touch more consumers’ lives and offer more opportunities to<br />
improve each consumer’s life.<br />
3) Develop faster-growing, structurally attractive<br />
businesses with global leadership potential<br />
Our third growth strategy for the decade ahead is to continue<br />
to grow and develop faster-growing, structurally attractive<br />
businesses. We’re concentrating on opportunity areas in the<br />
beauty and health market segments and several household care<br />
categories. With this strategy, we will continue to shift P&G’s<br />
business portfolio toward these advantaged categories.
PURPOSE-FOCUSED EXECUTION:<br />
“HOW-TO-WIN” STRATEGIES<br />
We have made three strategic “how-to-win” choices to capture<br />
these growth opportunities.<br />
First, we will leverage our core strengths —consumer understanding,<br />
brand-building, innovation, go-to-market capability<br />
and scale — to execute the Company’s growth strategies.<br />
These strengths create significant <strong>com</strong>petitive advantage<br />
for P&G, particularly when we leverage them together as<br />
interdependent capabilities to win. We see opportunities<br />
to apply P&G’s strengths in several areas — from expanding<br />
category, country and channel portfolios globally to extending<br />
distribution and store coverage in developing markets. This will<br />
continue to be a primary how-to-win focus area for P&G.<br />
Second, we are elevating Simplification, Scale and Execution<br />
to how-to-win strategies. These are key improvement areas<br />
where we believe we can create the greatest value and<br />
<strong>com</strong>petitive advantage.<br />
Our simplification efforts have one goal: to make it easier for<br />
each P&G employee and business partner to improve more lives<br />
in more parts of the world more <strong>com</strong>pletely. As P&G has grown<br />
larger, we’ve naturally be<strong>com</strong>e more <strong>com</strong>plex. We are removing<br />
<strong>com</strong>plexity so our brands are more affordable and to make the<br />
Company more innovative and agile. We’re reducing senior<br />
management positions and layers, and improving decision<br />
making, by simplifying our organization structure. We’re also<br />
making other important interventions to simplify business<br />
processes such as business planning, product launch, and<br />
product formulation. We want to be<strong>com</strong>e a $100 billion<br />
<strong>com</strong>pany with the speed and agility of a $10 billion <strong>com</strong>pany.<br />
We consider scale to be a tremendous growth opportunity.<br />
We’re leveraging scale efficiencies to deliver best-in-class<br />
cost structures throughout our business. We’re using our<br />
R&D and supply chain scale to create alternative materials<br />
that minimize exposure to volatile <strong>com</strong>modity markets.<br />
We’re creating the technology infrastructure to rapidly transfer<br />
best-in-class knowledge across our global organization.<br />
And more. I’m confident this focus will yield dramatic benefits<br />
for the Company over time.<br />
Execution is, of course, the only strategy our customers and<br />
consumers ever see, so we must do it with excellence, always.<br />
We are placing even sharper emphasis on consistent, quality<br />
execution in every part of our business.<br />
Third, we are leading change to win with consumers and customers.<br />
We are be<strong>com</strong>ing an even more collaborative organization,<br />
inside and outside our Company. We’re getting flatter, faster<br />
and simpler. We’re changing how we <strong>com</strong>pensate people to<br />
reinforce and reward behaviors that allow us to meet our<br />
simplification, scale and disciplined execution objectives. We’re<br />
making the investments to be networked globally and digitized<br />
from end to end. And we’re building the capability to operate<br />
on a demand-driven, real-time, future-focused basis every day.<br />
In today’s economic environment, many <strong>com</strong>panies are cutting<br />
back on investments in their people. P&G is increasing its<br />
investment. We know without doubt that P&G people are our<br />
most important asset, and we will continue to invest in their<br />
growth, capability, and productivity.<br />
PURPOSE-INSPIRED CULTURE<br />
I believe to my core that by renewing our <strong>com</strong>mitment to P&G’s<br />
Purpose…by establishing a unifying growth strategy and a<br />
Company culture that are tightly linked to our Purpose…we<br />
can inspire and motivate P&G people around the world to new<br />
levels of innovation, productivity, executional excellence and<br />
business results.<br />
A.G. and I both believe the decade ahead has the potential to be<br />
one of the strongest decades of growth in the Company’s history.<br />
We’re serving about four billion people in the world today.<br />
That’s a billion and a half more people than we were reaching<br />
at the beginning of the decade, and at least a billion less than<br />
the number I’m <strong>com</strong>mitted to serving in the decade ahead.<br />
We know that P&G products touch and improve people’s lives<br />
in meaningful ways. People tell us and show us —when we visit<br />
them in their homes, when we shop with them in stores, when<br />
we listen to their calls and read their e-mails. When we spend<br />
time with the people who trust and use our brands, we <strong>com</strong>e<br />
away inspired. Every time.<br />
The opportunities are there. We have the right strategies,<br />
capabilities and plans. We have the best people —the strongest<br />
global organization that I believe you’ll find in any <strong>com</strong>pany.<br />
If we can inspire the performance that our people are capable<br />
of delivering —day in and day out —I have no doubt that we can<br />
fulfill our Purpose more thoroughly and deliver the superior<br />
shareholder value we all expect from P&G.<br />
Bob McDonald<br />
President and Chief Executive Officer<br />
August 7, <strong>2009</strong><br />
The <strong>Procter</strong> & <strong>Gamble</strong> Company 7
8 The <strong>Procter</strong> & <strong>Gamble</strong> Company<br />
Touching Lives.<br />
P&G’s well-known, trusted<br />
brands touch the lives of<br />
consumers in more than<br />
180 countries.
10 The <strong>Procter</strong> & <strong>Gamble</strong> Company<br />
P&G Brands —Designed to Be Leaders<br />
“P&G’s billion-dollar brands are platforms for innovation. They are<br />
global leaders. Consumers want them in their homes. Retailers<br />
want them in their stores. They enable us to bring innovation to<br />
consumers around the world effectively, efficiently and profitably.<br />
They make consumers’ lives a little better, every day.”<br />
–A.G. Lafley<br />
A Company of Leading Brands<br />
For nearly 172 years, P&G has been providing trusted<br />
brands that make every day a little better for the world’s<br />
consumers. P&G has the largest lineup of leading brands in<br />
its industry, with 23 brands with over $1 billion in annual<br />
sales, and another 20 brands generating about $500 million<br />
or more in annual sales. These 43 brands have delivered a<br />
9-year <strong>com</strong>pound average sales growth rate of approximately<br />
10% —double the growth rate of the balance of P&G’s<br />
brand portfolio.<br />
Highly Valued Assets<br />
P&G’s market capitalization of roughly $150 billion far<br />
exceeds the $46 billion book value of the Company’s<br />
tangible assets, such as cash, machinery, buildings, etc.<br />
The difference is the value P&G shareholders place on the<br />
Company’s brands, the earnings and cash these brands<br />
generate today, and the confidence that these leading<br />
brands will continue to grow in the future.<br />
Capabilities Designed to Grow Brands<br />
for Decades<br />
We have built these valuable assets with the industry-leading<br />
levels of investment and capabilities necessary to build<br />
brands that live and grow for decades.<br />
Consumer Understanding —Over the last decade, we have<br />
invested more than $2 billion in consumer research to better<br />
understand, anticipate and respond to consumer needs and<br />
wants. Deep consumer understanding is a key enabler for<br />
product innovation, packaging development and marketing<br />
<strong>com</strong>munication that create sustainable <strong>com</strong>petitive advantages<br />
for P&G brands and create superior value for consumers.<br />
P&G’s top 43 brands<br />
account for 85%<br />
of sales and more<br />
than 90% of profit.<br />
Innovation —Each year, we invest more than $2 billion in<br />
innovation. We <strong>com</strong>plement this in-house capability with<br />
our Connect and Develop program, which creates external<br />
partnerships that enhance and accelerate innovation. This is<br />
important because innovation improves consumer value and<br />
leads to profitable market<br />
share growth for our brands.<br />
Each year IRI, a leading market<br />
research firm, publishes its<br />
New Product Pacesetter<br />
<strong>Report</strong>. This U.S.-based study<br />
ranks the most successful<br />
new consumer packaged<br />
85%<br />
sales<br />
90%<br />
profit<br />
P&G brands are<br />
market leaders in<br />
15 of the 21 major<br />
global product<br />
categories in which<br />
we <strong>com</strong>pete.<br />
goods (CPG) products, as measured by sales, over the past<br />
year. In 2008, P&G had five of the top 10 new non-food<br />
product launches in the U.S. and 10 of the top 25. Over<br />
the past 14 years, P&G has had 114 top-25 IRI non-food<br />
Pacesetters—more than our six largest <strong>com</strong>petitors <strong>com</strong>bined.<br />
Brand Building —We invest more than $7 billion in<br />
advertising annually, consistently making P&G one of the<br />
world’s largest advertisers. While the scale of our marketing<br />
investment is significant, the messages we convey to<br />
consumers are truly most important. These messages build<br />
confidence that our brands will deliver on their promises<br />
and build leading brand equities that last for generations.
We regularly assess the strength and attractiveness of our<br />
brands with consumers by using proprietary testing tools.<br />
�������������������������������������������������������<br />
of product, concept and price in a <strong>com</strong>petitive context.<br />
�������������������������������������������������������<br />
most important to consumers and measures differences<br />
between brands.<br />
Growing from a Strong Core<br />
Having a strong core of leading brands allows P&G to efficiently<br />
and effectively extend our portfolio both vertically—to serve more<br />
consumers at more price points —��������������������������������<br />
categories to touch more parts of more consumers’ lives.<br />
Here are a few examples:<br />
Tide Stain Release<br />
Tide is the clear leader in<br />
���������������������������<br />
market with approximately<br />
��������������������������<br />
the leading detergent in<br />
��������������������������<br />
������������������������<br />
expanding both of these<br />
�����������������������������<br />
laundry additives segment<br />
with the introduction of<br />
�����������������������������<br />
Professional. These new<br />
items are launching early<br />
���������������<br />
Pampers Simply Dry<br />
We recently introduced a new line of diapers in Germany<br />
��������������������������������������������������<br />
����������������������������������������������������������<br />
Dry in the value tier enabled us to raise the price of the<br />
���������������������������������������������������<br />
���������������������������������������������������������<br />
�������������������������������������������������������<br />
���������������������������������������������������������<br />
prior-year levels. Based on the success in Germany, Pampers<br />
����������������������������������������������������������<br />
��������������������������������������������<br />
The <strong>Procter</strong> & <strong>Gamble</strong> Company 11<br />
�������������������������������������������������������������<br />
power of a package, along with the ability to convey a<br />
���������������������������������������������������<br />
By constantly adding value with innovation, testing the<br />
strength of our brands with consumers and delivering on<br />
marketing promises, our brands build consumer trust and<br />
loyalty that keep them growing for decades.<br />
Oral-B Toothpaste<br />
We are building on Crest<br />
Pro-Health’s leading product<br />
technology and Oral-B’s<br />
������������������������<br />
toothbrush market share<br />
������������������������<br />
touch more parts of more<br />
���������������������������<br />
�������������������������<br />
toothpaste into the pharmacy<br />
������������������������������<br />
credentialing support of oral<br />
health professionals. The early<br />
����������������������������<br />
encouraging, with Oral-B<br />
toothpaste establishing a<br />
solid market share position<br />
in the pharmacy channel.
12 The <strong>Procter</strong> & <strong>Gamble</strong> Company<br />
Billion-Dollar Brands<br />
P&G is a <strong>com</strong>pany of leading brands. At the beginning of<br />
the decade, P&G had ten billion-dollar brands in its portfolio —<br />
brands that generate more than one billion dollars in sales<br />
each year. Today, we have 23 of these billion-dollar brands.
Half-Billion-Dollar Brands<br />
P&G also has 20 brands generating about $500 million or more in<br />
annual sales. When these are <strong>com</strong>bined with the billion-dollar brands,<br />
P&G’s top 43 brands account for 85% of sales and more than<br />
90% of profit. Together, these 43 brands have delivered a 9-year<br />
<strong>com</strong>pound average sales growth rate of approximately 10% —<br />
double the growth rate of the balance of P&G’s brand portfolio.
The <strong>Procter</strong> & <strong>Gamble</strong> Company 15
16 The <strong>Procter</strong> & <strong>Gamble</strong> Company<br />
Improving Life.<br />
P&G develops leaders<br />
whose purpose is<br />
centered on improving<br />
more consumers’ lives<br />
in more parts of the<br />
world more <strong>com</strong>pletely.
18 The <strong>Procter</strong> & <strong>Gamble</strong> Company<br />
P&G Leaders —Built from Within<br />
P&G people are the Company’s most important asset and<br />
source of <strong>com</strong>petitive advantage. Our success depends entirely<br />
on the strength of our talent pipeline, which we build from<br />
within and manage with a disciplined process led by the CEO<br />
and the senior leadership team. This is an essential element of<br />
how P&G is designed to lead.<br />
A Team Designed to Lead<br />
The P&G leadership team in place today is an ideal<br />
example of how P&G develops leaders. This team is the<br />
most experienced and diverse leadership team in Company<br />
history. The majority of these executives have experience<br />
leading businesses in both developed and developing<br />
countries. They know how to <strong>com</strong>pete in markets where<br />
P&G brands are established leaders and where P&G is a<br />
new player. They have the experience and skills to lead<br />
P&G in today’s fast-changing global economy.<br />
These women and men have been preparing for the<br />
responsibilities they have today since they joined P&G<br />
two or even three decades ago. They were identified<br />
as top development candidates early in their careers.<br />
They were given a diverse mix of assignments to broaden<br />
their experience. They received coaching from senior<br />
managers and proprietary training at each critical step<br />
of their career. Their contributions and capabilities were<br />
reviewed with P&G’s Board of Directors. When it was<br />
time for them to move into the Company’s most-senior<br />
management positions, they were ready to step up.<br />
This is how P&G develops each new generation of leaders.<br />
Making People a Competitive Advantage<br />
Our approach to developing leaders at P&G is elegantly simple.<br />
We take the same rigorous and disciplined approach to<br />
developing leaders at P&G around the world in every business,<br />
in every region and at every level.<br />
We Share P&G’s Purpose and Values. Our Purpose, Values<br />
and Principles are the foundation on which we develop leaders<br />
at P&G. Our shared Purpose —improving the lives of the<br />
world’s consumers—in addition to our Values—trust, integrity,<br />
ownership, leadership and passion for winning—unify us as we<br />
collaborate as a team internally and <strong>com</strong>pete to win externally.<br />
P&G is recognized<br />
as a top <strong>com</strong>pany<br />
for leaders.<br />
Ranked among the<br />
National Association<br />
for Female Executives’<br />
Top 10 Companies<br />
for Executive Women<br />
Named to Chief<br />
Executive magazine’s<br />
worldwide survey of the<br />
Top 20 Best Companies<br />
for Leaders<br />
Named to<br />
the DiversityInc<br />
Top 50 Companies<br />
for Diversity ® list
P&G leaders at the Vice President level<br />
and above <strong>com</strong>e from 35 different<br />
countries, with more than half of them<br />
originating from outside the United States.<br />
Argentina<br />
Australia<br />
Austria<br />
Belgium<br />
Brazil<br />
Canada<br />
China<br />
Colombia<br />
Czech<br />
Republic<br />
Egypt<br />
Finland<br />
France<br />
Germany<br />
Great<br />
Britain<br />
Greece<br />
India<br />
Ireland<br />
Italy<br />
Japan<br />
Lebanon<br />
Mexico<br />
Morocco<br />
Netherlands<br />
Norway<br />
Panama<br />
Peru<br />
Philippines<br />
Poland<br />
Portugal<br />
Spain<br />
Sweden<br />
Switzerland<br />
Turkey<br />
USA<br />
Venezuela<br />
We Hire the Best. Nearly a half-million people apply for<br />
P&G jobs every year. We hire less than 1%. We attract top<br />
talent because of P&G’s reputation as a great <strong>com</strong>pany for<br />
leaders, and we identify the best applicants by using a proven<br />
recruiting process that measures intelligence, assesses<br />
character and leadership, and predicts success at P&G.<br />
We Challenge P&G People from Day One. We believe<br />
there’s no substitute for hands-on experience when it<br />
<strong>com</strong>es to leadership development. That’s why we create<br />
early, meaningful responsibilities for every employee.<br />
Typical assignments demand collaboration inside and<br />
outside the Company, disciplined project management and<br />
the need to be in touch with consumers, retail customers<br />
and other external stakeholders.<br />
Business and Functional Leaders Actively Recruit, Teach<br />
and Coach. Line business leaders are accountable and<br />
involved at every step of the process. This starts at the top.<br />
Our Chief Executive Officer, Vice Chairs, Presidents and<br />
Functional Officers recruit on college campuses and teach in<br />
our executive education programs. These senior executives<br />
also act as mentors and coaches for younger managers,<br />
helping them develop the skills necessary to lead large<br />
businesses and organizations.<br />
We Plan Careers. We create opportunities for careers at<br />
P&G, not just jobs. One way we do this is by managing P&G<br />
talent globally —starting at mid-levels of management and<br />
higher —to enable career development and growth across<br />
businesses and geographies. We identify talent early and<br />
groom people through a series of varied and enriching<br />
assignments that will prepare them for future roles.<br />
The CEO and Vice Chairs meet monthly to plan senior<br />
management assignments. Business presidents meet as a<br />
talent-development team once per quarter. And the Board<br />
of Directors reviews P&G’s talent pipeline once a year.<br />
Eighty-five percent of P&G’s<br />
leadership team has had<br />
one or more international<br />
assignments.<br />
The <strong>Procter</strong> & <strong>Gamble</strong> Company 19<br />
85%<br />
We Never Stop Learning. In addition to on-the-job<br />
experience, we provide a wealth of technical, functional<br />
and leadership skills training. Some programs are offered at<br />
career milestones, such as when an employee first takes on<br />
responsibility for managing others or leading an organization.<br />
Other programs take managers out of the classroom and<br />
into retail stores or even into consumers’ homes. This process<br />
not only helps P&G people develop business skills but also<br />
deepens their <strong>com</strong>mitment to touching and improving<br />
consumers’ lives —P&G’s enduring Purpose.
20 The <strong>Procter</strong> & <strong>Gamble</strong> Company<br />
Standing, left to right<br />
Bob McDonald<br />
President and<br />
Chief Executive Officer<br />
A.G. Lafley<br />
Chairman of the Board<br />
Front Row, left to right<br />
Jon Moeller<br />
Chief Financial Officer<br />
Daniela Riccardi<br />
President —<br />
Greater China<br />
Steve Jemison<br />
Chief Legal Officer<br />
and Secretary<br />
Charlie Pierce<br />
Group President —<br />
Global Oral Care<br />
Jorge Mesquita<br />
Group President —<br />
Global Fabric Care<br />
Bob Fregolle<br />
Global Customer<br />
Business Development<br />
Officer
Joan Lewis<br />
Global Consumer and<br />
Market Knowledge<br />
Officer<br />
Laurent Philippe<br />
Group President —<br />
Central & Eastern Europe,<br />
Middle East and Africa<br />
Deb Henretta<br />
Group President —<br />
Asia<br />
Jorge Uribe<br />
President —<br />
Latin America<br />
Mark Bertolami<br />
President —Duracell<br />
Melanie Healey<br />
Group President —<br />
Global Feminine &<br />
Health Care<br />
Second Row, left to right<br />
Chip Bergh<br />
Group President —<br />
Global Male Grooming,<br />
Beauty & Grooming<br />
Moheet Nagrath<br />
Global Human<br />
Resources Officer<br />
Chris de Lapuente<br />
Group President —<br />
Global Hair Care,<br />
Beauty & Grooming<br />
Bruce Brown<br />
Chief Technology<br />
Officer<br />
Nancy Swanson<br />
Vice President —<br />
Corporate<br />
Keith Harrison<br />
Global Product Supply<br />
Officer<br />
Steve Bishop<br />
President —<br />
North America<br />
Gina Drosos<br />
President —<br />
Global Female Beauty,<br />
Beauty & Grooming<br />
Filippo Passerini<br />
President —<br />
Global Business<br />
Services and Chief<br />
Information Officer<br />
Martin Riant<br />
Group President —<br />
Global Baby Care
David Taylor<br />
Group President —<br />
Global Home Care<br />
Marc Pritchard<br />
Global Brand Building<br />
Officer<br />
Mary Lynn<br />
Ferguson-McHugh<br />
President —<br />
Family Care<br />
Back Row, left to right<br />
Chris Hassall<br />
Global External<br />
Relations Officer<br />
Jeff Schomburger<br />
President —Global<br />
Wal-Mart Team<br />
Valarie Sheppard<br />
Senior Vice President &<br />
Comptroller<br />
Phil Duncan<br />
Global Design Officer<br />
Patrice Louvet<br />
President —<br />
Global Prestige<br />
Charlotte Otto<br />
Retiring Global External<br />
Relations Officer<br />
Giovanni Ciserani<br />
President —<br />
Western Europe<br />
Robert Jongstra<br />
President —<br />
Global Professional<br />
Salon, Beauty &<br />
Grooming<br />
Clayt Daley, Jr.<br />
Retiring Vice Chairman<br />
and Chief Financial<br />
Officer<br />
Tom Finn<br />
President —<br />
Global Health Care<br />
John Goodwin<br />
President —<br />
Global Snacks<br />
and Pet Care<br />
Teri List<br />
Senior Vice President<br />
& Treasurer
Standing, left to right<br />
Rob Steele<br />
Vice Chairman —<br />
Global Health and<br />
Well-Being<br />
Werner Geissler<br />
Vice Chairman —<br />
Global Operations<br />
Ed Shirley<br />
Vice Chairman —<br />
Global Beauty &<br />
Grooming<br />
Dimitri<br />
Panayotopoulos<br />
Vice Chairman —<br />
Global Household Care<br />
(Not pictured)<br />
Susan Arnold<br />
Retiring President —<br />
Global Business Units<br />
Juan Pedro Hernandez<br />
President—<br />
Global Braun,<br />
Beauty & Grooming<br />
Hartwig Langer<br />
Retiring President —<br />
Global Prestige Products<br />
The <strong>Procter</strong> & <strong>Gamble</strong> Company 23
24 The <strong>Procter</strong> & <strong>Gamble</strong> Company<br />
Corporate Officers<br />
CORPORATE &<br />
COMPANY OPERATIONS<br />
Robert A. McDonald<br />
President and<br />
Chief Executive Officer<br />
A.G. Lafley<br />
Chairman of the Board<br />
Bruce Brown<br />
Chief Technology Officer<br />
Robert L. Fregolle, Jr.<br />
Global Customer Business<br />
Development Officer<br />
R. Keith Harrison, Jr.<br />
Global Product Supply<br />
Officer<br />
Christopher D. Hassall<br />
Global External Relations<br />
Officer<br />
Steven W. Jemison<br />
Chief Legal Officer and<br />
Secretary<br />
Teri L. List<br />
Senior Vice President<br />
& Treasurer<br />
Jon R. Moeller<br />
Chief Financial Officer<br />
Moheet Nagrath<br />
Global Human Resources<br />
Officer<br />
Filippo Passerini<br />
President —<br />
Global Business Services and<br />
Chief Information Officer<br />
Marc S. Pritchard<br />
Global Brand Building<br />
Officer<br />
Valarie L. Sheppard<br />
Senior Vice President &<br />
Comptroller<br />
GLOBAL<br />
OPERATIONS<br />
Werner Geissler<br />
Vice Chairman —<br />
Global Operations<br />
Deborah A. Henretta<br />
Group President —<br />
Asia<br />
Laurent L. Philippe<br />
Group President —<br />
Central & Eastern<br />
Europe, Middle East<br />
and Africa<br />
Steven D. Bishop<br />
President —<br />
North America<br />
Giovanni Ciserani<br />
President —<br />
Western Europe<br />
Daniela Riccardi<br />
President —<br />
Greater China<br />
Jeffrey K. Schomburger<br />
President —<br />
Global Wal-Mart Team<br />
Jorge A. Uribe<br />
President —<br />
Latin America<br />
GLOBAL BEAUTY<br />
& GROOMING<br />
Edward D. Shirley<br />
Vice Chairman —<br />
Global Beauty &<br />
Grooming<br />
Charles V. Bergh<br />
Group President —<br />
Global Male Grooming,<br />
Beauty & Grooming<br />
Christopher de<br />
Lapuente<br />
Group President —<br />
Global Hair Care,<br />
Beauty & Grooming<br />
Virginia Drosos<br />
President —<br />
Global Female Beauty,<br />
Beauty & Grooming<br />
Juan Pedro Hernandez<br />
President —<br />
Global Braun,<br />
Beauty & Grooming<br />
Robert Jongstra<br />
President —<br />
Global Professional Salon,<br />
Beauty & Grooming<br />
Patrice Louvet<br />
President —<br />
Global Prestige<br />
GLOBAL HEALTH<br />
AND WELL-BEING<br />
Robert A. Steele<br />
Vice Chairman —<br />
Global Health and<br />
Well-Being<br />
Melanie Healey<br />
Group President —<br />
Global Feminine &<br />
Health Care<br />
Charles E. Pierce<br />
Group President —<br />
Global Oral Care<br />
John P. Goodwin<br />
President —<br />
Global Snacks<br />
and Pet Care<br />
Thomas M. Finn<br />
President —<br />
Global Health Care<br />
GLOBAL<br />
HOUSEHOLD CARE<br />
Dimitri<br />
Panayotopoulos<br />
Vice Chairman —<br />
Global Household Care<br />
Jorge S. Mesquita<br />
Group President —<br />
Global Fabric Care<br />
Martin Riant<br />
Group President —<br />
Global Baby Care<br />
David S. Taylor<br />
Group President —<br />
Global Home Care<br />
Mark Bertolami<br />
President —<br />
Duracell<br />
Mary Lynn<br />
Ferguson-McHugh<br />
President —<br />
Family Care<br />
The following <strong>com</strong>pany officers<br />
have announced their intention to<br />
retire during the <strong>2009</strong>/10 fiscal year:<br />
Susan E. Arnold<br />
Retiring President —Global Business Units<br />
Clayton C. Daley, Jr.<br />
Retiring Vice Chairman and Chief Financial Officer<br />
Charlotte R. Otto<br />
Retiring Global External Relations Officer<br />
Hartwig Langer<br />
Retiring President —Global Prestige Products
Board of Directors<br />
Kenneth I. Chenault<br />
Chairman and Chief Executive Officer of the American Express<br />
Company (financial services). Director since 2008. Also a Director of<br />
International Business Machines Corporation. Age 58. Member of the<br />
Audit and Compensation & Leadership Development Committees.<br />
Scott D. Cook<br />
Chairman of the Executive Committee of the Board of Intuit Inc.<br />
(software and web services). Director since 2000. Also a Director<br />
of eBay Inc. Age 57. Member of the Compensation & Leadership<br />
Development and Innovation & Technology Committees.<br />
Rajat K. Gupta<br />
Senior Partner Emeritus at McKinsey & Company (international<br />
consulting). Director since 2007. Also a Director of American<br />
Airlines, Genpact, Ltd., The Goldman Sachs Group, Inc., Harman<br />
International Industries, Inc. and Sberbank. Age 60. Member of the<br />
Audit and Innovation & Technology Committees.<br />
A.G. Lafley<br />
Chairman of the Board and former Chief Executive Officer of the<br />
Company. Director since 2000. Also a Director of General Electric<br />
Company. Age 62.<br />
Charles R. Lee<br />
Retired Chairman of the Board and Co-Chief Executive Officer of<br />
Verizon Communications Inc. (tele<strong>com</strong>munication services). Director<br />
since 1994. Also a Director of The DIRECTV Group, Inc., Marathon<br />
Oil Corporation, United Technologies Corporation and U.S. Steel<br />
Corporation. Age 69. Chair of the Audit Committee and member of<br />
the Compensation & Leadership Development Committee.<br />
Lynn M. Martin<br />
Former Professor at the J.L. Kellogg Graduate School of<br />
Management, Northwestern University and former Chair of the<br />
Council for the Advancement of Women and Advisor to the firm of<br />
Deloitte & Touche LLP for Deloitte’s internal human resources and<br />
minority advancement matters. Director since 1994. Also a Director<br />
of AT&T Inc., Ryder System, Inc., Dreyfus Funds and Constellation<br />
Energy Group, Inc. Age 69. Member of the Governance & Public<br />
Responsibility and Innovation & Technology Committees.<br />
Robert A. McDonald<br />
President and Chief Executive Officer of the Company.<br />
Appointed to the Board effective July 1, <strong>2009</strong>. Also a Director<br />
of Xerox Corporation. Age 56.<br />
W. James McNerney, Jr.<br />
Chairman of the Board, President and Chief Executive Officer of<br />
The Boeing Company (aerospace, <strong>com</strong>mercial jetliners and military<br />
defense systems). Director since 2003. Age 60. Presiding Director,<br />
Chair of the Compensation & Leadership Development Committee<br />
and member of the Governance & Public Responsibility Committee.<br />
The <strong>Procter</strong> & <strong>Gamble</strong> Company 25<br />
Johnathan A. Rodgers<br />
President and Chief Executive Officer of TV One, LLC (media and<br />
<strong>com</strong>munications). Director since 2001. Also a Director of Nike, Inc.<br />
Age 63. Member of the Innovation & Technology Committee.<br />
Ralph Snyderman, M.D.<br />
Chancellor Emeritus, James B. Duke Professor of Medicine at Duke<br />
University. Director since 1995. Also a Director of Targacept, Inc.<br />
and a Venture Partner of New Enterprise Associates. Age 69.<br />
Chair of the Innovation & Technology Committee and member of<br />
the Audit Committee.<br />
Mary Agnes Wilderotter<br />
Chairman of the Board, President and Chief Executive Officer of<br />
Frontier Communications Corporation, a <strong>com</strong>munications <strong>com</strong>pany<br />
specializing in providing services to rural areas and small and<br />
medium-sized towns and cities. Appointed to the Board on<br />
August 11, <strong>2009</strong>. Also a Director of Xerox Corporation and<br />
Yahoo! Inc. Age 54. Member of the Compensation & Leadership<br />
Development and Governance & Public Responsibility Committees.<br />
Patricia A. Woertz<br />
Chairman, Chief Executive Officer and President of Archer Daniels<br />
Midland Company (agricultural processors of oilseeds, corn, wheat<br />
and cocoa). Director since 2008. Age 56. Member of the Audit and<br />
Governance & Public Responsibility Committees.<br />
Ernesto Zedillo<br />
Former President of Mexico, Director of the Center for the Study of<br />
Globalization and Professor in the field of International Economics<br />
and Politics at Yale University. Director since 2001. Also a Director of<br />
Alcoa Inc. Age 57. Chair of the Governance & Public Responsibility<br />
Committee and member of the Innovation & Technology<br />
Committee.<br />
Margaret C. Whitman<br />
Former President and Chief Executive Officer of eBay Inc. (a global<br />
Internet <strong>com</strong>pany that includes online marketplaces, payments<br />
and <strong>com</strong>munications). Director, Chair of the Governance & Public<br />
Responsibility Committee and member of the Compensation &<br />
Leadership Development Committee until her resignation from the<br />
Board on December 31, 2008.<br />
THE BOARD OF DIRECTORS HAS FOUR COMMITTEES:<br />
Audit Committee<br />
Compensation & Leadership Development Committee<br />
Governance & Public Responsibility Committee<br />
Innovation & Technology Committee
26 The <strong>Procter</strong> & <strong>Gamble</strong> Company<br />
P&G at a Glance<br />
GBU <strong>Report</strong>able Segment Key Products Billion-Dollar Brands<br />
BEAUTY Beauty Cosmetics, Deodorants, Hair Care, Personal<br />
Cleansing, Prestige Fragrances, Skin Care<br />
Grooming Blades and Razors, Electric Hair Removal Devices,<br />
Face and Shave Products, Home Appliances<br />
HEALTH AND WELL-BEING Health Care Feminine Care, Oral Care, Personal Health Care,<br />
Pharmaceuticals<br />
Snacks and<br />
Pet Care<br />
HOUSEHOLD CARE Fabric Care and<br />
Home Care<br />
Baby Care and<br />
Family Care<br />
Pet Food, Snacks Iams, Pringles<br />
Air Care, Batteries, Dish Care, Fabric Care,<br />
Surface Care<br />
Baby Wipes, Bath Tissue, Diapers, Facial Tissue,<br />
Paper Towels<br />
(1) Partially offset by net sales in corporate to eliminate the sales of unconsolidated entities included in business unit results.<br />
<strong>2009</strong> NET SALES<br />
(% of total business segments)<br />
Beauty<br />
Health and Well-Being<br />
Household Care<br />
46%<br />
21%<br />
33%<br />
Head & Shoulders, Olay, Pantene,<br />
Wella<br />
Braun, Fusion, Gillette, Mach3<br />
Net Sales<br />
by GBU(1)<br />
(in billions)<br />
$26.3<br />
Actonel, Always, Crest, Oral-B $16.7<br />
Ariel, Dawn, Downy, Duracell,<br />
Gain, Tide<br />
Bounty, Charmin, Pampers<br />
$37.3<br />
RECOGNITION<br />
P&G is recognized as a leading global <strong>com</strong>pany, including a #6 ranking<br />
on Fortune’s “World’s Most Admired Companies,” the #2 ranking on<br />
Fortune’s “Top Companies for Leaders” survey, the #3 ranking on<br />
Barron’s “World’s Most Respected Companies List,” a #12 ranking on<br />
Business Week’s list of “World’s Most Innovative Companies,” named to<br />
Chief Executive magazine’s worldwide survey of the Top 20 Best<br />
Companies for Leaders, top rankings on the Dow Jones Sustainability<br />
Index from 2000 to <strong>2009</strong>, being named to the list of the Global 100<br />
Most Sustainable Corporations in the World, and a consistent #1<br />
ranking within our industry on Fortune’s Most Admired list for 24 of<br />
25 total years and for 12 years in a row.<br />
P&G’s <strong>com</strong>mitment to creating a diverse workplace has been recognized<br />
by the National Association for Female Executives (Top 10<br />
Companies for Executive Women), Working Mother magazine<br />
(100 Best Companies for Working Mothers and Top 20 Best<br />
Companies for Multicultural Women), Black Enterprise magazine<br />
(40 Best Companies for Diversity), and Diversity Inc. (Top 50<br />
Companies for Diversity and #3 ranking on the Top 10 Companies for<br />
Global Diversity).<br />
Supplier diversity is a fundamental business strategy at P&G. In <strong>2009</strong>,<br />
P&G spent more than $2 billion with minority- and women-owned<br />
businesses. Since 2005, P&G has been a member of the Billion Dollar<br />
Roundtable, a forum of 16 corporations that spend more than<br />
$1 billion annually with diverse suppliers.
Financial Contents<br />
Management’s Responsibility for Financial <strong>Report</strong>ing 28<br />
Management’s <strong>Report</strong> on Internal Control over Financial <strong>Report</strong>ing 29<br />
<strong>Report</strong>s of Independent Registered Public Accounting Firm 29<br />
Management’s Discussion and Analysis<br />
Overview 31<br />
Summary of <strong>2009</strong> Results 34<br />
Forward-Looking Statements 34<br />
Results of Operations 35<br />
Segment Results 37<br />
Financial Condition 42<br />
Significant Accounting Policies and Estimates 44<br />
Other Information 47<br />
Audited Consolidated Financial Statements<br />
Consolidated Statements of Earnings 49<br />
Consolidated Balance Sheets 50<br />
Consolidated Statements of Shareholders’ Equity 52<br />
Consolidated Statements of Cash Flows 53<br />
Notes to Consolidated Financial Statements 54<br />
The <strong>Procter</strong> & <strong>Gamble</strong> Company 27
28 The <strong>Procter</strong> & <strong>Gamble</strong> Company<br />
Management’s Responsibility for Financial <strong>Report</strong>ing<br />
At The <strong>Procter</strong> & <strong>Gamble</strong> Company, we take great pride in our long<br />
history of doing what’s right. If you analyze what’s made our <strong>com</strong>pany<br />
successful over the years, you may focus on our brands, our marketing<br />
strategies, our organization design and our ability to innovate. But if<br />
you really want to get at what drives our <strong>com</strong>pany’s success, the place<br />
to look is our people. Our people are deeply <strong>com</strong>mitted to our Purpose,<br />
Values and Principles. It is this <strong>com</strong>mitment to doing what’s right that<br />
unites us.<br />
This <strong>com</strong>mitment to doing what’s right is embodied in our financial<br />
reporting. High-quality financial reporting is our responsibility—one we<br />
execute with integrity, and within both the letter and spirit of the law.<br />
High-quality financial reporting is characterized by accuracy, objectivity<br />
and transparency. Management is responsible for maintaining an<br />
effective system of internal controls over financial reporting to deliver<br />
those characteristics in all material respects. The Board of Directors,<br />
through its Audit Committee, provides oversight. We have engaged<br />
Deloitte & Touche LLP to audit our Consolidated Financial Statements,<br />
on which they have issued an unqualified opinion.<br />
Our <strong>com</strong>mitment to providing timely, accurate and understandable<br />
information to investors en<strong>com</strong>passes:<br />
Communicating expectations to employees. Every employee—<br />
from senior management on down—is required to be trained on the<br />
Company’s Worldwide Business Conduct Manual, which sets forth<br />
the Company’s <strong>com</strong>mitment to conduct its business affairs with high<br />
ethical standards. Every employee is held personally accountable for<br />
<strong>com</strong>pliance and is provided several means of reporting any concerns<br />
about violations of the Worldwide Business Conduct Manual, which<br />
is available on our website at www.pg.<strong>com</strong>.<br />
Maintaining a strong internal control environment. Our system of<br />
internal controls includes written policies and procedures, segregation<br />
of duties and the careful selection and development of employees. The<br />
system is designed to provide reasonable assurance that transactions<br />
are executed as authorized and appropriately recorded, that assets<br />
are safeguarded and that accounting records are sufficiently reliable<br />
to permit the preparation of financial statements conforming in all<br />
material respects with accounting principles generally accepted in the<br />
United States of America. We monitor these internal controls through<br />
control self-assessments conducted by business unit management.<br />
In addition to performing financial and <strong>com</strong>pliance audits around the<br />
world, including unannounced audits, our Global Internal Audit<br />
organization provides training and continuously improves internal<br />
control processes. Appropriate actions are taken by management to<br />
correct any identified control deficiencies.<br />
Executing financial stewardship. We maintain specific programs<br />
and activities to ensure that employees understand their fiduciary<br />
responsibilities to shareholders. This ongoing effort en<strong>com</strong>passes<br />
financial discipline in strategic and daily business decisions and brings<br />
particular focus to maintaining accurate financial reporting and<br />
effective controls through process improvement, skill development<br />
and oversight.<br />
Exerting rigorous oversight of the business. We continuously review<br />
business results and strategic choices. Our Global Leadership Council<br />
is actively involved–from understanding strategies to reviewing key<br />
initiatives, financial performance and control assessments. The intent<br />
is to ensure we remain objective, identify potential issues, continuously<br />
challenge each other and ensure recognition and rewards are<br />
appropriately aligned with results.<br />
Engaging our Disclosure Committee. We maintain disclosure controls<br />
and procedures designed to ensure that information required to be<br />
disclosed is recorded, processed, summarized and reported timely<br />
and accurately. Our Disclosure Committee is a group of senior-level<br />
executives responsible for evaluating disclosure implications of significant<br />
business activities and events. The Committee reports its findings<br />
to the CEO and CFO, providing an effective process to evaluate our<br />
external disclosure obligations.<br />
Encouraging strong and effective corporate governance from our<br />
Board of Directors. We have an active, capable and diligent Board<br />
that meets the required standards for independence, and we wel<strong>com</strong>e<br />
the Board’s oversight. Our Audit Committee <strong>com</strong>prises independent<br />
directors with significant financial knowledge and experience. We<br />
review significant accounting policies, financial reporting and internal<br />
control matters with them and encourage their independent discussions<br />
with external auditors. Our corporate governance guidelines, as well<br />
as the charter of the Audit Committee and certain other <strong>com</strong>mittees<br />
of our Board, are available on our website at www.pg.<strong>com</strong>.<br />
P&G has a strong history of doing what’s right. Our employees embrace<br />
our Purpose, Values and Principles. We take responsibility for the quality<br />
and accuracy of our financial reporting. We present this information<br />
proudly, with the expectation that those who use it will understand<br />
our <strong>com</strong>pany, recognize our <strong>com</strong>mitment to performance with integrity<br />
and share our confidence in P&G’s future.<br />
R.A. McDonald<br />
President and Chief Executive Officer<br />
J.R. Moeller<br />
Chief Financial Officer
Management’s <strong>Report</strong> on Internal Control over Financial <strong>Report</strong>ing<br />
Management is responsible for establishing and maintaining adequate<br />
internal control over financial reporting of The <strong>Procter</strong> & <strong>Gamble</strong><br />
Company (as defined in Rule 13a-15(f) under the Securities Exchange<br />
Act of 1934, as amended). Our internal control over financial reporting<br />
is designed to provide reasonable assurance regarding the reliability<br />
of financial reporting and the preparation of financial statements for<br />
external purposes in accordance with generally accepted accounting<br />
principles in the United States of America.<br />
Strong internal controls is an objective that is reinforced through our<br />
Worldwide Business Conduct Manual, which sets forth our <strong>com</strong>mitment<br />
to conduct business with integrity, and within both the letter<br />
and the spirit of the law. The Company’s internal control over financial<br />
reporting includes a Control Self-Assessment Program that is conducted<br />
annually by substantially all areas of the Company and is audited by<br />
the internal audit function. Management takes the appropriate action<br />
to correct any identified control deficiencies. Because of its inherent<br />
limitations, any system of internal control over financial reporting, no<br />
matter how well designed, may not prevent or detect misstatements<br />
due to the possibility that a control can be circumvented or overridden<br />
or that misstatements due to error or fraud may occur that are not<br />
detected. Also, because of changes in conditions, internal control<br />
effectiveness may vary over time.<br />
<strong>Report</strong> of Independent Registered Public Accounting Firm<br />
To the Board of Directors and Stockholders of<br />
The <strong>Procter</strong> & <strong>Gamble</strong> Company<br />
We have audited the ac<strong>com</strong>panying Consolidated Balance Sheets of<br />
The <strong>Procter</strong> & <strong>Gamble</strong> Company and subsidiaries (the “Company”) as<br />
of June 30, <strong>2009</strong> and 2008, and the related Consolidated Statements<br />
of Earnings, Shareholders’ Equity, and Cash Flows for each of the three<br />
years in the period ended June 30, <strong>2009</strong>. These financial statements are<br />
the responsibility of the Company’s management. Our responsibility is to<br />
express an opinion on these financial statements based on our audits.<br />
We conducted our audits in accordance with the standards of the<br />
Public Company Accounting Oversight Board (United States). Those<br />
standards require that we plan and perform the audit to obtain<br />
reasonable assurance about whether the financial statements are free<br />
of material misstatement. An audit includes examining, on a test basis,<br />
evidence supporting the amounts and disclosures in the financial<br />
statements. An audit also includes assessing the accounting principles<br />
used and significant estimates made by management, as well as<br />
evaluating the overall financial statement presentation. We believe<br />
that our audits provide a reasonable basis for our opinion.<br />
In our opinion, such Consolidated Financial Statements present fairly,<br />
in all material respects, the financial position of the Company at<br />
The <strong>Procter</strong> & <strong>Gamble</strong> Company 29<br />
Management assessed the effectiveness of the Company’s internal<br />
control over financial reporting as of June 30, <strong>2009</strong>, using criteria<br />
established in Internal Control–Integrated Framework issued by the<br />
Committee of Sponsoring Organizations of the Treadway Commission<br />
(COSO) and concluded that the Company maintained effective internal<br />
control over financial reporting as of June 30, <strong>2009</strong>, based on these<br />
criteria.<br />
Deloitte & Touche LLP, an independent registered public accounting<br />
firm, has audited the effectiveness of the Company’s internal control<br />
over financial reporting as of June 30, <strong>2009</strong>, as stated in their report<br />
which is included herein.<br />
R.A. McDonald<br />
President and Chief Executive Officer<br />
J.R. Moeller<br />
Chief Financial Officer<br />
August 14, <strong>2009</strong><br />
June 30, <strong>2009</strong> and 2008, and the results of its operations and cash<br />
flows for each of the three years in the period ended June 30, <strong>2009</strong>,<br />
in conformity with accounting principles generally accepted in the<br />
United States of America.<br />
As discussed in Note 9 to the Consolidated Financial Statements, the<br />
Company adopted new accounting guidance on the accounting for<br />
uncertainty in in<strong>com</strong>e taxes, effective July 1, 2007.<br />
We have also audited, in accordance with the standards of the Public<br />
Company Accounting Oversight Board (United States), the Company’s<br />
internal control over financial reporting as of June 30, <strong>2009</strong>, based on<br />
the criteria established in Internal Control—Integrated Framework<br />
issued by the Committee of Sponsoring Organizations of the Treadway<br />
Commission and our report dated August 14, <strong>2009</strong> expressed an<br />
unqualified opinion on the Company’s internal control over financial<br />
reporting.<br />
Cincinnati, Ohio<br />
August 14, <strong>2009</strong>
30 The <strong>Procter</strong> & <strong>Gamble</strong> Company<br />
<strong>Report</strong> of Independent Registered Public Accounting Firm<br />
To the Board of Directors and Stockholders of<br />
The <strong>Procter</strong> & <strong>Gamble</strong> Company<br />
We have audited the internal control over financial reporting of<br />
The <strong>Procter</strong> & <strong>Gamble</strong> Company and subsidiaries (the “Company”) as<br />
of June 30, <strong>2009</strong>, based on criteria established in Internal Control—<br />
Integrated Framework issued by the Committee of Sponsoring<br />
Organizations of the Treadway Commission. The Company’s management<br />
is responsible for maintaining effective internal control over<br />
financial reporting and for its assessment of the effectiveness of internal<br />
control over financial reporting, included in Management’s <strong>Report</strong><br />
on Internal Control Over Financial <strong>Report</strong>ing. Our responsibility is to<br />
express an opinion on the Company’s internal control over financial<br />
reporting based on our audit.<br />
We conducted our audit in accordance with the standards of the<br />
Public Company Accounting Oversight Board (United States). Those<br />
standards require that we plan and perform the audit to obtain reasonable<br />
assurance about whether effective internal control over financial<br />
reporting was maintained in all material respects. Our audit included<br />
obtaining an understanding of internal control over financial reporting,<br />
assessing the risk that a material weakness exists, testing and evaluating<br />
the design and operating effectiveness of internal control based<br />
on the assessed risk, and performing such other procedures as we<br />
considered necessary in the circumstances. We believe that our audit<br />
provides a reasonable basis for our opinion.<br />
A <strong>com</strong>pany’s internal control over financial reporting is a process<br />
designed by, or under the supervision of, the <strong>com</strong>pany’s principal<br />
executive and principal financial officers, or persons performing similar<br />
functions, and effected by the <strong>com</strong>pany’s board of directors, management,<br />
and other personnel to provide reasonable assurance regarding<br />
the reliability of financial reporting and the preparation of financial<br />
statements for external purposes in accordance with generally accepted<br />
accounting principles. A <strong>com</strong>pany’s internal control over financial<br />
reporting includes those policies and procedures that (1) pertain to the<br />
maintenance of records that, in reasonable detail, accurately and fairly<br />
reflect the transactions and dispositions of the assets of the <strong>com</strong>pany;<br />
(2) provide reasonable assurance that transactions are recorded as<br />
necessary to permit preparation of financial statements in accordance<br />
with generally accepted accounting principles, and that receipts and<br />
expenditures of the <strong>com</strong>pany are being made only in accordance<br />
with authorizations of management and directors of the <strong>com</strong>pany;<br />
and (3) provide reasonable assurance regarding prevention or timely<br />
detection of unauthorized acquisition, use, or disposition of the<br />
<strong>com</strong>pany’s assets that could have a material effect on the financial<br />
statements.<br />
Because of the inherent limitations of internal control over financial<br />
reporting, including the possibility of collusion or improper management<br />
override of controls, material misstatements due to error or fraud may<br />
not be prevented or detected on a timely basis. Also, projections of<br />
any evaluation of the effectiveness of the internal control over financial<br />
reporting to future periods are subject to the risk that the controls may<br />
be<strong>com</strong>e inadequate because of changes in conditions, or that the<br />
degree of <strong>com</strong>pliance with the policies or procedures may deteriorate.<br />
In our opinion, the Company maintained, in all material respects,<br />
effective internal control over financial reporting as of June 30, <strong>2009</strong>,<br />
based on the criteria established in Internal Control — Integrated<br />
Framework issued by the Committee of Sponsoring Organizations of<br />
the Treadway Commission.<br />
We have also audited, in accordance with the standards of the Public<br />
Company Accounting Oversight Board (United States), the Consolidated<br />
Financial Statements of the Company as of and for the year ended<br />
June 30, <strong>2009</strong> and our report dated August 14, <strong>2009</strong> expressed an<br />
unqualified opinion on those financial statements and included an<br />
explanatory paragraph regarding the Company’s adoption of new<br />
accounting guidance on the accounting for uncertainty in in<strong>com</strong>e taxes,<br />
effective July 1, 2007.<br />
Cincinnati, Ohio<br />
August 14, <strong>2009</strong>
Management’s Discussion and Analysis The <strong>Procter</strong> & <strong>Gamble</strong> Company 31<br />
Management’s Discussion and Analysis<br />
The purpose of this discussion is to provide an understanding of<br />
P&G’s financial results and condition by focusing on changes in<br />
certain key measures from year to year. Management’s Discussion<br />
and Analysis (MD&A) is organized in the following sections:<br />
��Overview<br />
��Summary of <strong>2009</strong> Results<br />
��Forward-Looking Statements<br />
��Results of Operations<br />
��Segment Results<br />
��Financial Condition<br />
��Significant Accounting Policies and Estimates<br />
��Other Information<br />
Throughout MD&A, we refer to measures used by management to<br />
evaluate performance, including unit volume growth, net outside sales<br />
and net earnings. We also refer to a number of financial measures<br />
that are not defined under accounting principles generally accepted<br />
in the United States of America (U.S. GAAP), including organic sales<br />
growth, free cash flow and free cash flow productivity. We believe<br />
these measures provide investors with important information that is<br />
useful in understanding our business results and trends. The explanation<br />
at the end of MD&A provides more details on the use and the<br />
derivation of these measures. Management also uses certain market<br />
share and market consumption estimates to evaluate performance<br />
relative to <strong>com</strong>petition despite some limitations on the availability and<br />
<strong>com</strong>parability of share information. References to market share and<br />
market consumption in MD&A are based on a <strong>com</strong>bination of vendorreported<br />
consumption and market size data, as well as internal estimates.<br />
In November 2008, we <strong>com</strong>pleted the divestiture of our Coffee<br />
business through the merger of our Folgers coffee subsidiary into<br />
The J.M. Smucker Company (Smucker) in an all-stock reverse Morris<br />
Trust transaction. In connection with the merger, 38.7 million shares<br />
of P&G <strong>com</strong>mon stock were tendered by our shareholders and<br />
exchanged for all shares of Folgers <strong>com</strong>mon stock. Pursuant to the<br />
merger, a Smucker subsidiary merged with and into Folgers and<br />
Folgers became a wholly owned subsidiary of Smucker. The Company<br />
recognized an after-tax gain on the disposition of $2.0 billion, which<br />
is included as part of net earnings from discontinued operations.<br />
The Coffee business had historically been part of the Company’s<br />
Snacks, Coffee and Pet Care reportable segment, as well as the<br />
Coffee portion of the away-from-home business which is included in<br />
the Fabric Care and Home Care reportable segment. In accordance<br />
with the applicable accounting guidance for the impairment or<br />
disposal of long-lived assets, the results of our Coffee business are<br />
presented as discontinued operations and, as such, have been<br />
excluded from continuing operations and from segment results for<br />
all periods presented. The Snacks, Coffee and Pet Care reportable<br />
segment was renamed Snacks and Pet Care to reflect this change.<br />
OVERVIEW<br />
P&G’s business is focused on providing branded consumer packaged<br />
goods. Our goal is to provide products of superior quality and value to<br />
improve the lives of the world’s consumers. We believe this will result<br />
in leadership sales, earnings and value creation, allowing employees,<br />
shareholders and the <strong>com</strong>munities in which we operate to prosper.<br />
Our products are sold in more than 180 countries primarily through<br />
mass merchandisers, grocery stores, membership club stores, drug<br />
stores and “high frequency stores,” the neighborhood stores which<br />
serve many consumers in developing markets. We continue to<br />
expand our presence in other channels including department stores,<br />
perfumeries, pharmacies, salons and e-<strong>com</strong>merce. We have on-theground<br />
operations in approximately 80 countries.<br />
Our market environment is highly <strong>com</strong>petitive, with global, regional<br />
and local <strong>com</strong>petitors. In many of the markets and industry segments<br />
in which we sell our products, we <strong>com</strong>pete against other branded<br />
products as well as retailers’ private-label brands. Additionally, many<br />
of the product segments in which we <strong>com</strong>pete are differentiated by<br />
price (referred to as super-premium, premium, mid-tier value and<br />
low-tier economy products). Generally speaking, we <strong>com</strong>pete with<br />
super-premium, premium and mid-tier value products and are well<br />
positioned in the industry segments and markets in which we operate —<br />
often holding a leadership or significant market share position.<br />
Organizational Structure<br />
Our organizational structure is <strong>com</strong>prised of three Global Business<br />
Units (GBUs), Global Operations, Global Business Services (GBS) and<br />
Corporate Functions (CF).<br />
GLOBAL BUSINESS UNITS<br />
In fiscal year <strong>2009</strong>, our three GBUs were Beauty, Health and Well-<br />
Being and Household Care. The primary responsibility of the GBUs is<br />
to develop the overall strategy for our brands. They identify <strong>com</strong>mon<br />
consumer needs, develop new product innovations and upgrades<br />
and build our brands through effective <strong>com</strong>mercial innovations and<br />
marketing plans.<br />
Under U.S. GAAP, the business units <strong>com</strong>prising the GBUs were<br />
aggregated into six reportable segments: Beauty; Grooming; Health<br />
Care; Snacks and Pet Care; Fabric Care and Home Care; and Baby<br />
Care and Family Care. The following provides additional detail on<br />
our GBUs and reportable segments and the key product and brand<br />
<strong>com</strong>position within each.
32 The <strong>Procter</strong> & <strong>Gamble</strong> Company Management’s Discussion and Analysis<br />
GBU <strong>Report</strong>able Segment<br />
% of<br />
Net Sales*<br />
% of Net<br />
Earnings* Key Products Billion Dollar Brands<br />
BEAUTY Beauty 23% 22% Cosmetics, Deodorants, Hair Care, Personal<br />
Cleansing, Prestige Fragrances, Skin Care<br />
Grooming 9% 13% Blades and Razors, Electric Hair Removal<br />
Devices, Face and Shave Products, Home<br />
Appliances<br />
HEALTH AND WELL-BEING Health Care 17% 21% Feminine Care, Oral Care, Personal Health<br />
Care, Pharmaceuticals<br />
HOUSEHOLD CARE Fabric Care and<br />
Home Care<br />
Baby Care and<br />
Family Care<br />
Head & Shoulders, Olay,<br />
Pantene, Wella<br />
Braun, Fusion, Gillette,<br />
Mach3<br />
Actonel, Always, Crest,<br />
Oral-B<br />
Snacks and Pet Care 4% 2% Pet Food, Snacks Iams, Pringles<br />
29% 26% Air Care, Batteries, Dish Care, Fabric Care,<br />
Surface Care<br />
18% 16% Baby Wipes, Bath Tissue, Diapers, Facial<br />
Tissue, Paper Towels<br />
* Percent of net sales and net earnings from continuing operations for the year ended June 30, <strong>2009</strong> (excluding results held in Corporate).<br />
Beauty<br />
Beauty: We are a global market leader in the beauty category. Most<br />
of the beauty markets in which we <strong>com</strong>pete are highly fragmented<br />
with a large number of global and local <strong>com</strong>petitors. We are the<br />
global market leader in hair care with over 20% of the global market<br />
share. In skin care, our primary brand is Olay, which is the top facial<br />
skin care retail brand in the world. We are also one of the global<br />
market leaders in prestige fragrances, primarily behind the Gucci,<br />
Hugo Boss and Dolce & Gabbana fragrance brands.<br />
Grooming: This segment consists of blades and razors, face and<br />
shave preparation products (such as shaving cream), electric hair<br />
removal devices and small household appliances. We hold leadership<br />
market share in the manual blades and razors market on a global<br />
basis and in almost all of the geographies in which we <strong>com</strong>pete. Our<br />
global manual blades and razors market share is approximately 70%,<br />
primarily behind the Gillette franchise including Mach3, Fusion and<br />
Venus. Our electric hair removal devices and small home appliances<br />
are sold under the Braun brand in a number of markets around the<br />
world, where we <strong>com</strong>pete against both global and regional <strong>com</strong>petitors.<br />
Our primary focus in this area is electric hair removal devices, such as<br />
electric razors and epilators, where we hold approximately 30% and<br />
50% of the male and female markets, respectively.<br />
Health and Well-Being<br />
Health Care: We <strong>com</strong>pete in oral care, feminine care, pharmaceuticals<br />
and personal health. In oral care, there are several global <strong>com</strong>petitors<br />
in the market, and we have the number two market share position<br />
with approximately 20% of the global market. We are the global<br />
market leader in the feminine care category with over 35% of the<br />
global market share. We have approximately 40% of the global<br />
bisphosphonates market for the treatment of osteoporosis under the<br />
Actonel pharmaceuticals brand. In personal health, we are the market<br />
leader in nonprescription heartburn medications and in respiratory<br />
treatments with Prilosec OTC and Vicks, respectively.<br />
Ariel, Dawn, Downy,<br />
Duracell, Gain, Tide<br />
Bounty, Charmin,<br />
Pampers<br />
Snacks and Pet Care: In snacks, we <strong>com</strong>pete against both global and<br />
local <strong>com</strong>petitors and have a global market share of approximately 10%<br />
in the potato chips market behind our Pringles brand. In pet care, we<br />
<strong>com</strong>pete in several markets around the globe in the premium pet care<br />
segment, with the Iams and Eukanuba brands. The vast majority of our<br />
pet care business is in North America, where we have approximately<br />
a 10% share of the market.<br />
Household Care<br />
Fabric Care and Home Care: This segment is <strong>com</strong>prised of a variety<br />
of fabric care products, including laundry cleaning products and fabric<br />
conditioners; home care products, including dishwashing liquids<br />
and detergents, surface cleaners and air fresheners; and batteries.<br />
In fabric care, we generally have the number one or number two share<br />
position in the markets in which we <strong>com</strong>pete and are the global<br />
market leader, with over 30% of the global market share. Our global<br />
home care market share is over 15% across the categories in which<br />
we <strong>com</strong>pete. In batteries, we <strong>com</strong>pete primarily behind the Duracell<br />
brand and have over 25% of the global general purpose battery<br />
market share.<br />
Baby Care and Family Care: In baby care, we <strong>com</strong>pete primarily in<br />
diapers, training pants and baby wipes, with approximately 35% of<br />
the global market share. We are the number one or number two baby<br />
care <strong>com</strong>petitor in most of the key markets in which we <strong>com</strong>pete,<br />
primarily behind Pampers, the Company’s largest brand, with annual<br />
net sales of approximately $8 billion. Our family care business is<br />
predominantly a North American business <strong>com</strong>prised primarily of the<br />
Bounty paper towel and Charmin toilet tissue brands, with U.S. market<br />
shares of over 45% and 25%, respectively.
Management’s Discussion and Analysis The <strong>Procter</strong> & <strong>Gamble</strong> Company 33<br />
Fiscal year 2010 changes to Global Business Unit structure<br />
We recently announced a number of changes to our organization<br />
structure for the Beauty GBU, which resulted in changes to the<br />
<strong>com</strong>ponents of its segment structure. Effective July 1, <strong>2009</strong>, the<br />
Beauty GBU will be<strong>com</strong>e the Beauty and Grooming GBU and<br />
reportable segments under the GBU will move to a new consumeroriented<br />
alignment. The reportable segment formally known as<br />
Beauty will be<strong>com</strong>e Female Beauty and the Grooming reportable<br />
segment will change to Male Grooming. As a result, Female blades<br />
and razors will transition from Male Grooming to Female Beauty. In<br />
addition, certain male-focused brands and businesses, such as Old<br />
Spice and Gillette personal care, will move from Female Beauty to<br />
Male Grooming.<br />
These changes will be reflected in our segment reporting beginning<br />
in fiscal year 2010, at which time our historical segment reporting will<br />
also be restated to reflect the new structure. The GBU and segment<br />
discussions in the MD&A and ac<strong>com</strong>panying Consolidated Financial<br />
Statements reflect the organizational structure that existed through<br />
June 30, <strong>2009</strong>.<br />
GLOBAL OPERATIONS<br />
Global Operations is <strong>com</strong>prised of our Market Development<br />
Organization (MDO), which is responsible for developing go-to-market<br />
plans at the local level. The MDO includes dedicated retail customer,<br />
trade channel and country-specific teams. It is organized along five<br />
geographic units: North America, Western Europe, Central & Eastern<br />
Europe/Middle East/Africa (CEEMEA), Latin America and Asia, which<br />
is <strong>com</strong>prised of Japan, Greater China and ASEAN/Australia/India/<br />
Korea (AAIK). Throughout MD&A, we reference business results in<br />
developing markets, which we define as the aggregate of CEEMEA,<br />
Latin America, AAIK and Greater China, and developed markets,<br />
which are <strong>com</strong>prised of North America, Western Europe and Japan.<br />
GLOBAL BUSINESS SERVICES<br />
GBS provides technology, processes and standard data tools to enable<br />
the GBUs and the MDO to better understand the business and better<br />
serve consumers and customers. The GBS organization is responsible<br />
for providing world-class solutions at a low cost and with minimal<br />
capital investment.<br />
CORPORATE FUNCTIONS<br />
CF provides the Company-level strategy and portfolio analysis, corporate<br />
accounting, treasury, external relations, governance, human resources<br />
and legal, as well as other centralized functional support.<br />
Strategic Focus<br />
P&G is focused on strategies that we believe are right for the long-term<br />
health of the Company and will increase returns for our shareholders.<br />
The Company’s long-term financial targets are:<br />
��Organic sales growth of 4% to 6%. This is <strong>com</strong>prised of:<br />
– 3% to 4% of market growth, plus<br />
– 1% to 2% of share growth<br />
º 0% to 1% of mix enhancement and whitespace expansion, plus<br />
º 1% of growth acceleration behind revenue synergies associated<br />
with the Gillette acquisition.<br />
��Operating margin expansion of 50 to 75 basis points.<br />
��Diluted net earnings per share (EPS) growth of 10%.<br />
��Free cash flow productivity of 90% or greater (defined as the ratio<br />
of operating cash flow less capital expenditures to net earnings).<br />
– Capital spending at or below 4% of net sales annually.<br />
As a result of the recent global economic downturn, market growth<br />
rates have slowed and for 2010 are expected to be below the<br />
range that underpins our long-term financial growth targets. We are<br />
continuing to monitor market growth and may reassess our longterm<br />
targets in the future.<br />
In order to achieve these targets, we will focus on three primary areas:<br />
��Grow our leading, global brands and core categories. Our<br />
portfolio includes 23 brands that generate over $1 billion in annual<br />
sales and 20 brands that generate approximately $500 million or<br />
more in annual sales. Combined, these 43 brands account for 85% or<br />
more of our sales and profits. These brands are platforms for future<br />
innovations that will drive sales growth, expand categories for<br />
retail customers and differentiate brands in the minds of consumers.<br />
Our core categories, Baby Care, Blades and Razors, Fabric Care, Family<br />
Care, Feminine Care, Home Care, Oral Care, Prestige Fragrances,<br />
Retail Hair Care and Skin Care, have opportunities for continued<br />
growth. We will focus on profitable share growth across all of our<br />
businesses by leveraging our core strengths in innovation and<br />
brand-building.<br />
��Build business with underserved and unserved consumers. We<br />
are increasing our presence in developing markets, where 86% of<br />
the world’s population lives. We will increase the amount of sales<br />
from these markets by focusing on affordability, accessibility and<br />
awareness of our brands. We are extending our distribution systems<br />
to reach more consumers through underserved retail channels such<br />
as e-<strong>com</strong>merce and high frequency stores. And, we are creating a<br />
broader and deeper product portfolio. Our initiative pipeline has new<br />
and improved products that extend and strengthen our category<br />
and brand portfolios vertically and horizontally.
34 The <strong>Procter</strong> & <strong>Gamble</strong> Company Management’s Discussion and Analysis<br />
��Continue to grow and develop faster-growing, structurally<br />
attractive businesses with global leadership potential. We are<br />
continually optimizing our portfolio of brands and businesses with<br />
an emphasis on opportunities in Beauty, Health Care and selective<br />
portfolio and geographic acquisitions in Household Care. We will<br />
also identify growth opportunities in services, particularly businesses<br />
that can be franchised and expanded rapidly.<br />
To achieve our targets, we will also leverage core strengths that create<br />
<strong>com</strong>petitive advantages and are critical to winning in the consumer<br />
products industry: consumer knowledge, innovation, brand-building,<br />
go-to-market capabilities and scale. We are placing particular<br />
emphasis on execution, simplification and scale as key improvement<br />
areas that will enable P&G to create the greatest value and <strong>com</strong>petitive<br />
advantage. Finally, we are strengthening the depth, breadth and<br />
quality of leadership at all levels of the Company to make P&G a more<br />
demand-driven, real-time, future-focused organization.<br />
SUMMARY OF <strong>2009</strong> RESULTS<br />
��Net sales decreased 3% to $79.0 billion.<br />
– Organic sales, which exclude the impacts of acquisitions,<br />
divestitures and foreign exchange, increased 2%, which is<br />
below our organic sales growth target range.<br />
��Net earnings increased 11% to $13.4 billion.<br />
– Net earnings from continuing operations decreased 4% to<br />
$11.3 billion primarily due to lower net sales and a higher<br />
effective tax rate.<br />
– Operating margins were consistent with the prior year, as a<br />
<strong>com</strong>modity-driven reduction in gross margins was offset by<br />
reduced selling, general and administrative expenses (SG&A).<br />
– Net earnings from discontinued operations increased $1.9 billion<br />
to $2.1 billion due to the impact of the Folgers coffee divestiture.<br />
��Diluted net earnings per share increased 17% to $4.26.<br />
– Earnings per share included $0.68 from discontinued operations.<br />
– Earnings per share from continuing operations increased 1%<br />
to $3.58.<br />
– Earnings per share grew ahead of net earnings due to the impact<br />
of share repurchases and the shares tendered in the Folgers coffee<br />
transaction.<br />
��Cash flow from operating activities was $14.9 billion.<br />
– Free cash flow, which is operating cash flow less capital spending,<br />
was $11.7 billion.<br />
– Free cash flow productivity, which is the ratio of free cash flow<br />
to net earnings, was 87% and included a negative 15% impact<br />
resulting from the non-cash gain on the Folgers coffee transaction.<br />
FORWARD-LOOKING STATEMENTS<br />
We discuss expectations regarding future performance, events and<br />
out<strong>com</strong>es, such as our business outlook and objectives, in annual<br />
and quarterly reports, press releases and other written and oral<br />
<strong>com</strong>munications. All such statements, except for historical and present<br />
factual information, are “forward-looking statements,” and are<br />
based on financial data and our business plans available only as of<br />
the time the statements are made, which may be<strong>com</strong>e out-of-date or<br />
in<strong>com</strong>plete. We assume no obligation to update any forward-looking<br />
statements as a result of new information, future events or other<br />
factors. Forward-looking statements are inherently uncertain and<br />
investors must recognize that events could be significantly different<br />
from our expectations. For more information on risks that could<br />
impact our results, refer to Item 1A Risk Factors in our most recent<br />
10-Q, 10-K and 8-K filings.<br />
Ability to Achieve Business Plans. We are a consumer products<br />
<strong>com</strong>pany and rely on continued demand for our brands and products.<br />
To achieve business goals, we must develop and sell products that<br />
appeal to consumers and retail trade customers. Our continued<br />
success is dependent on leading-edge innovation with respect to both<br />
products and operations and on the continued positive reputations of<br />
our brands. This means we must be able to obtain patents and respond<br />
to technological advances and patents granted to <strong>com</strong>petition. Our<br />
success is also dependent on effective sales, advertising and marketing<br />
programs in an increasingly fragmented media environment. Our<br />
ability to innovate and execute in these areas will determine the extent<br />
to which we are able to grow existing sales and volume profitably,<br />
especially with respect to the product categories and geographic<br />
markets (including developing markets) in which we have chosen to<br />
focus. There are high levels of <strong>com</strong>petitive activity in the environments<br />
in which we operate. To address these challenges, we must respond<br />
to <strong>com</strong>petitive factors, including pricing, promotional incentives, trade<br />
terms and product initiatives. We must manage each of these factors,<br />
as well as maintain mutually beneficial relationships with our key<br />
customers, in order to effectively <strong>com</strong>pete and achieve our business<br />
plans. As a <strong>com</strong>pany that manages a portfolio of consumer brands, our<br />
ongoing business model involves a certain level of ongoing acquisition<br />
and divestiture activities. We must be able to successfully manage the<br />
impacts of these activities, while at the same time delivering against<br />
base business objectives. Our success will also depend on our ability<br />
to maintain key information technology systems.<br />
Cost Pressures. Our costs are subject to fluctuations, particularly due to<br />
changes in <strong>com</strong>modity prices, raw materials, cost of labor, foreign<br />
exchange and interest rates. Therefore, our success is dependent,<br />
in part, on our continued ability to manage these fluctuations<br />
through pricing actions, cost savings projects, sourcing decisions and<br />
certain hedging transactions. We also must manage our debt and<br />
currency exposure, especially in certain countries, such as Venezuela,<br />
China and India. We need to maintain key manufacturing and supply<br />
arrangements, including sole supplier and sole manufacturing plant<br />
arrangements. We must implement, achieve and sustain cost<br />
improvement plans, including our outsourcing projects and those
Management’s Discussion and Analysis The <strong>Procter</strong> & <strong>Gamble</strong> Company 35<br />
related to general overhead and workforce optimization. Successfully<br />
managing these changes, including identifying, developing and<br />
retaining key employees, is critical to our success.<br />
Global Economic Conditions. Economic changes, terrorist activity and<br />
political unrest may result in business interruption, inflation, deflation<br />
or decreased demand for our products. Our success will depend, in<br />
part, on our ability to manage continued global political and/or<br />
economic uncertainty, especially in our significant geographic markets,<br />
as well as any political or economic disruption due to terrorist and<br />
other hostile activities.<br />
Regulatory Environment. Changes in laws, regulations and the related<br />
interpretations may alter the environment in which we do business.<br />
This includes changes in environmental, <strong>com</strong>petitive and productrelated<br />
laws, as well as changes in accounting standards and taxation<br />
requirements. Our ability to manage regulatory, tax and legal matters<br />
(including product liability, patent, intellectual property, <strong>com</strong>petition<br />
law matters and tax policy) and to resolve pending legal matters<br />
within current estimates may impact our results.<br />
RESULTS OF OPERATIONS<br />
Net Sales<br />
Net sales decreased 3% in <strong>2009</strong> to $79.0 billion behind a 3% decline<br />
in unit volume. Unfavorable foreign exchange reduced net sales by<br />
4% as many foreign currencies weakened versus the U.S. dollar.<br />
Price increases, taken across all segments, primarily to offset higher<br />
<strong>com</strong>modity costs and foreign exchange impacts, added 5% to net<br />
sales. Negative product mix reduced net sales by 1% mainly due to<br />
disproportionate volume declines in our more discretionary categories<br />
(primarily Prestige Fragrances, Professional Hair Care and Braun<br />
appliances), along with Pharmaceuticals and Personal Health Care,<br />
all of which have higher than Company average selling prices. Every<br />
reportable segment except Baby Care and Family Care reported volume<br />
declines led by mid-single-digit declines in Grooming and Snacks and<br />
Pet Care. Volume in both developed and developing regions was below<br />
previous year levels. Organic volume, which excludes the impact of<br />
acquisitions and divestitures, declined 2%. Organic sales increased<br />
2% behind the net benefit of pricing and mix. The global economic<br />
downturn, credit crisis and price increases have contributed to market<br />
contractions, trade inventory reductions and share declines in certain<br />
businesses, resulting in organic sales below the Company’s long-term<br />
financial target range. These impacts were more pronounced in our<br />
more discretionary categories and may continue to negatively impact<br />
results of operations into fiscal 2010.<br />
NET SALES<br />
($ billions)<br />
07<br />
08<br />
09<br />
DEVELOPING MARKETS<br />
(% of net sales)<br />
07<br />
08<br />
09<br />
$74.8<br />
29%<br />
$81.7<br />
$79.0<br />
31%<br />
32%<br />
Net sales increased 9% in 2008 to $81.7 billion behind 4% unit volume<br />
growth, a favorable 5% foreign exchange impact and a positive 1%<br />
pricing impact. Favorable foreign exchange resulted primarily from the<br />
strengthening of European and other currencies relative to the U.S.<br />
dollar. Price increases were taken across a number of our businesses<br />
primarily to offset higher <strong>com</strong>modity costs. Mix had a negative 1%<br />
impact on net sales primarily due to disproportionate growth in<br />
developing regions, where selling prices are below the Company<br />
average. Each reportable segment posted year-on-year volume growth,<br />
with mid-single-digit growth in Fabric Care and Home Care, Baby<br />
Care and Family Care, Grooming and Health Care and low single-digit<br />
growth in Beauty and Snacks and Pet Care. Each geographic region<br />
posted year-on-year volume growth except Western Europe, which<br />
was down low single digits due to the impact of divestitures. Volume<br />
grew primarily behind initiative activity on key brands and continued<br />
double-digit growth in developing regions. Organic sales increased<br />
5% behind organic volume growth of 5%. Each reportable segment<br />
posted year-on-year organic sales and organic volume growth.
36 The <strong>Procter</strong> & <strong>Gamble</strong> Company Management’s Discussion and Analysis<br />
Operating Costs<br />
Comparisons as a percentage of net sales; Years ended June 30 <strong>2009</strong><br />
Gross margin declined 80 basis points to 50.8% of net sales in <strong>2009</strong>.<br />
Higher <strong>com</strong>modity and energy costs, partially offset by savings projects<br />
on raw and packing materials, negatively impacted gross margin by<br />
about 250 basis points. Unfavorable foreign exchange and incremental<br />
restructuring charges also negatively impacted gross margin. These<br />
impacts were partially offset by price increases and manufacturing and<br />
logistics cost savings.<br />
Gross margin was down 70 basis points in 2008 to 51.6% of net sales.<br />
Commodity and energy cost increases had a negative impact on gross<br />
margin of about 200 basis points. These were largely offset by the<br />
benefits of scale leverage from volume growth and cost savings projects<br />
resulting from manufacturing efficiency improvements and product<br />
reformulations.<br />
GROSS MARGIN<br />
(% of net sales)<br />
07<br />
08<br />
09<br />
50.8%<br />
51.6%<br />
52.3%<br />
Total selling, general and administrative expenses (SG&A) decreased 6%<br />
to $24.0 billion in <strong>2009</strong> driven primarily by foreign currency impacts<br />
and cost reduction efforts. SG&A as a percentage of net sales was<br />
down 80 basis points due to lower marketing expenses and the impact<br />
of foreign currency transaction gains on working capital balances<br />
caused by strengthening of the U.S. dollar. Marketing expenses were<br />
down as a percentage of net sales for the total Company and for each<br />
reportable segment mainly due to media rate reductions, foreign<br />
exchange and reductions in the amount of media purchased primarily<br />
in the fourth fiscal quarter. Overhead spending as a percentage of<br />
net sales was up 10 basis points versus the prior year as productivity<br />
improvements were mostly offset by the negative impacts of sales<br />
deleverage and incremental restructuring charges.<br />
SG&A increased 6% to $25.6 billion in 2008 driven by higher overhead<br />
and marketing spending to support business growth. SG&A as<br />
a percentage of net sales was down 110 basis points. Overhead<br />
spending was down as a percentage of net sales for the total<br />
Company and for each reportable segment primarily due to volume<br />
scale leverage, a focus on overhead productivity and incremental<br />
synergy savings from the Gillette acquisition. Marketing spending as<br />
a percentage of net sales was in line with previous year levels.<br />
07<br />
08<br />
09<br />
Basis Point<br />
Change 2008<br />
SELLING, GENERAL AND ADMINISTRATIVE EXPENSE<br />
(% of net sales)<br />
Basis Point<br />
Change 2007<br />
Gross margin 50.8% (80) 51.6% (70) 52.3%<br />
Selling, general and administrative 30.4% (80) 31.2% (110) 32.3%<br />
Operating margin 20.4% 0 20.4% 40 20.0%<br />
Earnings from continuing operations before in<strong>com</strong>e taxes 19.4% 30 19.1% 0 19.1%<br />
Net earnings from continuing operations 14.3% (10) 14.4% 100 13.4%<br />
30.4%<br />
32.3%<br />
31.2%<br />
We fund a number of restructuring-type activities primarily related<br />
to manufacturing and workforce optimization efforts to maintain a<br />
<strong>com</strong>petitive cost structure. We have incurred annual charges of<br />
approximately $400 million after tax in recent years. In <strong>2009</strong>, we<br />
implemented additional restructuring-type activities in order to<br />
offset the dilution caused by the disposition of our Coffee business.<br />
These incremental charges, which impacted both gross margin and<br />
SG&A as a percentage of net sales, reduced operating margin by<br />
about 50 basis points in <strong>2009</strong>.<br />
Non-Operating Items<br />
Non-operating items primarily include interest expense, divestiture<br />
gains and interest and investment in<strong>com</strong>e. Interest expense decreased<br />
7% in <strong>2009</strong> to $1.4 billion primarily driven by a reduction in U.S. dollar<br />
interest rates partially offset by a higher debt level primarily to fund the<br />
Company’s previously announced share repurchase program. In July<br />
2007, the Company announced plans to repurchase $24–30 billion<br />
of P&G stock over a three-year period. In 2008, interest expense<br />
increased 13% to $1.5 billion driven by a higher interest rate on our<br />
long-term borrowings and a higher debt level to fund the Company’s<br />
previously announced share repurchase program.<br />
Other non-operating in<strong>com</strong>e increased $98 million in <strong>2009</strong> mainly due<br />
to higher divestiture gains from the current year sales of Thermacare,<br />
Noxzema, Infusium and other minor brands. In 2008, other nonoperating<br />
in<strong>com</strong>e decreased $103 million versus the prior year primarily<br />
due to lower interest in<strong>com</strong>e resulting from lower interest rates and<br />
cash balances. Divestiture gains in 2008 were in line with previous<br />
year levels and included the sale of the Western European tissue and<br />
Japanese adult incontinence businesses as well as other minor brands.<br />
The effective tax rate from continuing operations in <strong>2009</strong> was up<br />
180 basis points to 26.3% primarily due to a lower level of net favorable<br />
adjustments to reserves for previously existing uncertain tax positions<br />
and the utilization of tax credits, partially offset by unfavorable geographic<br />
mix of earnings across all reporting segments resulting from<br />
a weakening of key foreign currencies versus the U.S. dollar. During
Management’s Discussion and Analysis The <strong>Procter</strong> & <strong>Gamble</strong> Company 37<br />
the current year, net adjustments to reserves for uncertain tax positions<br />
benefitted the effective tax rate by 120 basis points, versus a benefit<br />
of 320 basis points in 2008. The effective tax rate from continuing<br />
operations declined from 29.5% in 2007 to 24.5% in 2008.<br />
Approximately 300 basis points of the decline was due to the tax<br />
reserve adjustments for previously existing uncertain tax positions.<br />
The balance of the decline in 2008 was primarily driven by a more<br />
favorable geographic mix of earnings and a reduction in the German<br />
statutory tax rate, which reduced our deferred tax liabilities related to<br />
acquired intangible assets.<br />
Net Earnings<br />
Net earnings from continuing operations decreased 4% to $11.3 billion<br />
in <strong>2009</strong> mainly due to lower net sales and a higher effective tax rate.<br />
Operating margin was consistent with the prior year as lower SG&A<br />
as a percentage of net sales offset a <strong>com</strong>modity-driven decline in<br />
gross margin. Net earnings from continuing operations in 2008<br />
increased 17% to $11.8 billion behind sales growth, a 40-basis point<br />
improvement in operating margin and a lower tax rate. Operating<br />
margin increased in 2008 due to lower SG&A as a percentage of net<br />
sales, which more than offset lower gross margin.<br />
Net earnings from discontinued operations increased $1.9 billion in<br />
<strong>2009</strong> primarily due to a $2.0 billion after tax gain on the sale of the<br />
Coffee business in November 2008. This was partially offset by the loss<br />
of earnings contribution from the Coffee business. Net earnings from<br />
discontinued operations were $277 million in both 2008 and 2007.<br />
Diluted net earnings per share in <strong>2009</strong> increased 17% to $4.26. The<br />
increase was due mainly to the gain on the sale of our Coffee business,<br />
partially offset by lower net earnings from continuing operations and<br />
the loss of earnings contribution from the Coffee business. Diluted<br />
net earnings per share from continuing operations in <strong>2009</strong> increased<br />
1% to $3.58, while diluted net earnings per share from discontinued<br />
operations was $0.68, <strong>com</strong>prised primarily of the gain on the sale<br />
of the Coffee business. Diluted net earnings per share growth<br />
exceeded net earnings due to fewer shares outstanding as a result of<br />
share repurchase activity and shares tendered in the Folgers coffee<br />
transaction. Treasury shares in the amount of $6.4 billion were<br />
repurchased in <strong>2009</strong>, nearly all of which were made under our publicly<br />
announced share repurchase program.<br />
Diluted net earnings per share in 2008 were up 20% versus the prior<br />
year to $3.64 per share, <strong>com</strong>prised of $3.56 per share from continuing<br />
operations and $0.08 per share from discontinued operations. Diluted<br />
net earnings per share growth exceeded net earnings growth due to<br />
share repurchase activity. Treasury shares in the amount of $10.0 billion<br />
were repurchased in 2008, nearly all of which were made under our<br />
publicly announced share repurchase program. Gillette was modestly<br />
accretive to earnings per share results in 2008, <strong>com</strong>pared to dilution<br />
of approximately $0.10–$0.12 per share in 2007. The elimination of<br />
Gillette dilution on earnings per share drove approximately 4 percentage<br />
points of earnings per share growth in 2008.<br />
DILUTED NET EARNINGS<br />
(per <strong>com</strong>mon share)<br />
07<br />
08<br />
09<br />
$3.04<br />
$3.64<br />
$4.26<br />
SEGMENT RESULTS<br />
Results for the segments reflect information on the same basis we<br />
use for internal management reporting and performance evaluation.<br />
Within the Beauty GBU, we provide data for the Beauty and the<br />
Grooming reportable segments. In the Health and Well-Being GBU,<br />
we provide data for the Health Care and the Snacks and Pet Care<br />
reportable segments. In the Household Care GBU, we provide data<br />
for the Fabric Care and Home Care and the Baby Care and Family Care<br />
reportable segments. All references to net earnings throughout the<br />
discussion of segment results refer to net earnings from continuing<br />
operations.<br />
The results of these reportable business segments do not include<br />
certain non-business unit specific costs such as interest expense,<br />
investing activities and certain restructuring costs. These costs are<br />
reported in our Corporate segment and are included as part of our<br />
Corporate segment discussion. Additionally, as described in Note 11<br />
to the Consolidated Financial Statements, we have investments in<br />
certain <strong>com</strong>panies over which we exert significant influence, but do<br />
not control the financial and operating decisions and, therefore,<br />
do not consolidate them for U.S. GAAP purposes (“unconsolidated<br />
entities”). Given that certain of these investments are managed as<br />
integral parts of the Company’s business units, they are accounted<br />
for as if they were consolidated subsidiaries for management and<br />
segment reporting purposes. This means pretax earnings in the<br />
business units include 100% of each pretax in<strong>com</strong>e statement<br />
<strong>com</strong>ponent. In determining after-tax earnings in the business units,<br />
we eliminate the share of earnings applicable to other ownership<br />
interests, in a manner similar to minority interest, and apply the<br />
statutory tax rates. Eliminations to adjust each line item to U.S. GAAP<br />
are included in our Corporate segment.
38 The <strong>Procter</strong> & <strong>Gamble</strong> Company Management’s Discussion and Analysis<br />
Net Sales Change Drivers vs. Year Ago (<strong>2009</strong> vs. 2008)<br />
BEAUTY<br />
Beauty<br />
BEAUTY<br />
($ millions) <strong>2009</strong><br />
Change vs.<br />
Prior Year 2008<br />
Change vs.<br />
Prior Year<br />
Volume n/a -2% n/a +2%<br />
Net sales $18,789 -4% $19,515 +9%<br />
Net earnings $ 2,531 -7% $ 2,730 +5%<br />
Beauty net sales decreased 4% in <strong>2009</strong> to $18.8 billion on a 2%<br />
decline in unit volume. Price increases to offset higher <strong>com</strong>modity costs<br />
added 2% to net sales. Unfavorable foreign exchange reduced net<br />
sales by 4%. Organic sales increased 1% versus the prior year behind<br />
price increases, partially offset by a 1% decline in organic volume.<br />
Volume in developed regions declined mid-single digits, while volume<br />
in developing regions grew low single digits. Retail Hair Care volume<br />
grew low single digits behind growth of Pantene, Head & Shoulders<br />
and Rejoice. Prestige Fragrances volume declined high single digits<br />
and Professional Hair Care volume declined mid-single digits mainly<br />
due to market contractions and trade inventory reductions. Volume<br />
in Skin Care declined mid-single digits primarily due to <strong>com</strong>petitive<br />
activity affecting shipments of Olay and the divestiture of Noxzema.<br />
Personal Cleansing volume was down high single digits behind trade<br />
inventory reductions, market contractions and divestiture activity. Our<br />
market shares in key categories within Beauty were generally consistent<br />
with the prior year.<br />
Net earnings decreased 7% in <strong>2009</strong> to $2.5 billion mainly due to lower<br />
net sales and reduced net earnings margin. Net earnings margin<br />
contracted 50 basis points due to reduced gross margin and a higher<br />
effective tax rate, partially offset by reduced SG&A as a percentage<br />
of net sales. Gross margin declined due to higher <strong>com</strong>modity costs,<br />
which were only partially offset by price increases and manufacturing<br />
cost savings. SG&A was down due to lower marketing spending as a<br />
percentage of net sales.<br />
Volume with<br />
Acquisitions<br />
& Divestitures<br />
Volume<br />
Excluding<br />
Acquisitions<br />
& Divestitures<br />
Foreign<br />
Exchange Price Mix/Other<br />
Net Sales<br />
Growth<br />
Beauty -2% -1% -4% 2% 0% -4%<br />
Grooming -6% -5% -6% 5% -2% -9%<br />
HEALTH AND WELL-BEING<br />
Health Care -4% -3% -5% 4% -2% -7%<br />
Snacks and Pet Care -6% -6% -4% 9% -2% -3%<br />
HOUSEHOLD CARE<br />
Fabric Care and Home Care -3% -3% -5% 6% 0% -2%<br />
Baby Care and Family Care 1% 2% -4% 5% -1% 1%<br />
TOTAL COMPANY -3% -2% -4% 5% -1% -3%<br />
Sales percentage changes are approximations based on quantitative formulas that are consistently applied.<br />
Beauty net sales increased 9% in 2008 to $19.5 billion behind 2%<br />
volume growth and 6% of favorable foreign exchange. Favorable<br />
product mix had a positive 1% impact on net sales primarily due to<br />
stronger growth in Skin Care and Prestige Fragrances, which have<br />
higher than segment average unit selling prices. This more than offset<br />
the impact of disproportionate growth in developing regions, which<br />
have lower selling prices than the segment average. Skin Care volume<br />
was up mid-single digits driven by growth of Olay behind the Definity<br />
and Regenerist initiatives. Our global skin care market share was up<br />
slightly, driven primarily by about a 1 point increase in our U.S. market<br />
share. Prestige Fragrances volume was up low single digits and organic<br />
volume was up high single digits behind new product launches on<br />
Dolce & Gabbana and Hugo Boss. Retail Hair Care volume was up midsingle<br />
digits, led by high single-digit growth in developing markets.<br />
Retail Hair Care volume in developed regions was flat as a double-digit<br />
volume increase of Head & Shoulders was offset by a double-digit<br />
volume decline of Pantene in North America. Professional Hair Care<br />
volume declined mid-single digits as growth from color was more than<br />
offset by declines in care and styling. Overall, global hair care market<br />
share was in line with the prior year level. Net earnings in Beauty<br />
increased 5% to $2.7 billion in 2008 as the impact of higher net sales<br />
was partially offset by a lower net earnings margin. Net earnings margin<br />
was down 60 basis points as lower gross margin and the impact of<br />
base period divestiture gains on minor brands more than offset the<br />
benefit of a lower tax rate due to geographic mix. Gross margin was<br />
down due to higher <strong>com</strong>modity costs, which more than offset the<br />
benefit of increased volume scale leverage and manufacturing cost<br />
savings projects. SG&A increased slightly as higher marketing spending<br />
as a percentage of net sales was partially offset by lower overhead<br />
spending as a percentage of net sales.
Management’s Discussion and Analysis The <strong>Procter</strong> & <strong>Gamble</strong> Company 39<br />
GROOMING<br />
($ millions) <strong>2009</strong><br />
Change vs.<br />
Prior Year 2008<br />
Change vs.<br />
Prior Year<br />
Volume n/a -6% n/a +5%<br />
Net sales $7,543 -9% $8,254 +11%<br />
Net earnings $1,492 -11% $1,679 +21%<br />
Grooming net sales declined 9% in <strong>2009</strong> to $7.5 billion on a 6%<br />
decline in unit volume. Unfavorable foreign exchange reduced net<br />
sales by 6%. Product mix had a negative 2% impact on net sales as<br />
favorable product mix from growth of the premium-priced Gillette<br />
Fusion brand was more than offset by a disproportionate decline of<br />
Braun, both of which have higher than segment average selling<br />
prices. Price increases, taken across most product lines and in part to<br />
offset foreign exchange impacts in developing regions, added 5% to<br />
net sales. Organic sales were down 2% versus the prior year on a 5%<br />
decline in organic volume, mainly due to the sharp decline of the<br />
Braun business. Volume in developed regions declined high single<br />
digits and volume in developing regions declined mid-single digits.<br />
Blades and Razors volume declined low single digits primarily driven<br />
by market contractions in developed regions and trade inventory<br />
reductions. Growth of Gillette Fusion and Venus was more than offset<br />
by declines in legacy shaving systems. Global value share of blades<br />
and razors was up less than half a point versus the prior year. Volume<br />
in Braun was down double digits due to market contractions, trade<br />
inventory reductions and the exits of the U.S. home appliance and<br />
Tassimo coffee appliance businesses. Global value share of the female<br />
dry shaving market was up more than a point, while global value share<br />
of the male dry shaving market was down less than half a point.<br />
Net earnings were down 11% in <strong>2009</strong> to $1.5 billion primarily on the<br />
decline in net sales and a 60-basis point reduction in net earnings<br />
margin. Net earnings margin was down due to a higher effective tax<br />
rate and reduced gross margin, partially offset by lower SG&A as a<br />
percentage of net sales. Gross margin declined due to unfavorable<br />
product mix resulting from disproportionate growth of disposable<br />
razors, higher <strong>com</strong>modity costs and volume scale deleverage which<br />
were partially offset by price increases and manufacturing cost savings.<br />
SG&A as a percentage of net sales was down due to lower overhead<br />
and marketing spending. The economic downturn in fiscal <strong>2009</strong> has<br />
resulted in a disproportionate decline in the Braun business particularly<br />
in developing geographies, given the more discretionary nature of home<br />
and personal grooming appliance purchases. We believe the Braun<br />
business will return to sales and earnings growth rates consistent with<br />
our long-term business plans. Failure to achieve these business plans<br />
or a further deterioration of the macroeconomic conditions could<br />
result in an impairment of the Braun business goodwill and intangibles<br />
recorded in 2005 as part of the Gillette acquisition.<br />
Grooming net sales increased 11% to $8.3 billion in 2008. Net sales<br />
were up behind 5% volume growth, a 7% favorable foreign exchange<br />
impact and a 2% positive pricing impact driven by price increases<br />
on premium shaving systems. Product mix had a negative 3% impact<br />
on net sales as positive product mix from growth on the premiumpriced<br />
Gillette Fusion brand was more than offset by the impact of<br />
disproportionate growth in developing regions, where selling prices<br />
are below the segment average. Blades and Razors volume increased<br />
high single digits behind double-digit growth in developing regions<br />
driven primarily by Gillette Fusion expansion and the Prestobarba3<br />
launch. In developed regions, Blades and Razors volume was down<br />
low single digits as double-digit growth on Fusion was more than<br />
offset by lower shipments of legacy shaving systems. Gillette Fusion<br />
delivered more than $1 billion in net sales for 2008. Braun volume<br />
was down mid-single digits primarily due to supply constraints at a<br />
contract manufacturer, the announced exits of certain appliance<br />
businesses and the divestiture of the thermometer and blood pressure<br />
devices business. Net earnings in Grooming were up 21% in 2008 to<br />
$1.7 billion behind net sales growth and a 170-basis point earnings<br />
margin expansion. Earnings margin improved behind lower SG&A as<br />
a percentage of net sales, partially offset by a reduction in gross<br />
margin. Gross margin declined due to higher costs incurred at a<br />
contract manufacturer on the Braun home appliance business, which<br />
more than offset benefits from higher pricing and volume scale<br />
leverage. SG&A as a percentage of net sales was down primarily due<br />
to lower overhead spending driven largely by synergies from the<br />
integration of Gillette into P&G’s infrastructure.<br />
Health and Well-Being<br />
HEALTH CARE<br />
($ millions) <strong>2009</strong><br />
Change vs.<br />
Prior Year 2008<br />
Change vs.<br />
Prior Year<br />
Volume n/a -4% n/a +4%<br />
Net sales $13,623 -7% $14,578 +9%<br />
Net earnings $ 2,435 -3% $ 2,506 +12%<br />
Health Care net sales were down 7% to $13.6 billion in <strong>2009</strong> on a<br />
4% decline in unit volume. The divestitures of Thermacare and other<br />
minor brands resulted in 1% of the unit volume decline. Unfavorable<br />
foreign exchange reduced net sales by 5%. Negative product mix from<br />
disproportionately higher volume declines of Personal Health Care and<br />
Pharmaceuticals, which have higher than segment average selling<br />
prices, reduced net sales by 2%. These negative impacts were partially<br />
offset by positive pricing impacts of 4%. Organic sales were down<br />
1% versus fiscal 2008. Volume declined mid-single digits in developed<br />
regions and low single digits in developing regions. Personal Health<br />
Care volume was down double digits due to the loss of marketplace<br />
exclusivity of Prilosec in North America, the impact of a mild cold and<br />
flu season on Vicks and the divestiture of Thermacare. All-outlet<br />
value share of the U.S. personal health care market has declined over<br />
2 points, including a double-digit share decline of Prilosec OTC.<br />
Pharmaceuticals volume decreased high single digits mainly due to<br />
minor brand divestitures and the impact of generic <strong>com</strong>petition to our<br />
Actonel brand in the osteoporosis category. The impact from the loss<br />
of Prilosec exclusivity and from generic <strong>com</strong>petition to the Actonel<br />
brand are expected to continue. Oral Care volume declined low single<br />
digits behind trade inventory reductions and market contractions in<br />
North America and CEEMEA. Our global market share of oral care<br />
was in line with the prior year. Feminine Care volume was down low<br />
single digits mainly due to trade inventory reductions and market<br />
contractions in North America and CEEMEA. Our global feminine care<br />
market share was down half a point versus the prior year.
40 The <strong>Procter</strong> & <strong>Gamble</strong> Company Management’s Discussion and Analysis<br />
Net earnings declined 3% to $2.4 billion in <strong>2009</strong> mainly due to lower<br />
net sales. Net earnings margin was up 70 basis points due primarily<br />
to lower SG&A as a percentage of net sales and higher current period<br />
divestiture gains, partially offset by a lower gross margin. The decline<br />
in gross margin was driven by higher <strong>com</strong>modity costs, which were<br />
partially offset by price increases and manufacturing cost savings.<br />
SG&A as a percentage of net sales was down behind reductions in<br />
both marketing and overhead spending as a percentage of net sales.<br />
Health Care net sales increased 9% in 2008 to $14.6 billion behind<br />
a 4% increase in unit volume. Foreign exchange had a positive 5%<br />
impact on net sales and price increases added 1% to net sales.<br />
Disproportionate growth in developing regions, which have selling<br />
prices below the segment average, resulted in a negative 1% mix<br />
impact. Feminine Care volume increased mid-single digits and organic<br />
volume was up high single digits behind double-digit growth on<br />
Naturella and high single-digit growth on Always, which more than<br />
offset a low single-digit decline on Tampax. Our global feminine care<br />
market share increased slightly in 2008. Oral Care volume was up midsingle<br />
digits behind initiative-driven growth on Oral-B toothbrushes and<br />
Crest. Volume in Pharmaceuticals and Personal Health was up low<br />
single digits as the impact of adding the Swiss Precision Diagnostics<br />
business was largely offset by lower shipments of Actonel, Prilosec<br />
OTC and PuR. The PuR decline was from adjustments to a Whirlpool ®<br />
water filters licensing agreement. Prilosec OTC volume began to<br />
decline in the third fiscal quarter of 2008 due to the loss of marketplace<br />
exclusivity and the entry of <strong>com</strong>peting products into the market.<br />
This is expected to continue and to have an adverse effect on the<br />
results of the Health Care segment in future periods. Net earnings in<br />
Health Care were up 12% in 2008 to $2.5 billion due to higher net<br />
sales and a 50-basis point improvement in net earnings margin. Net<br />
earnings margin increased as reduced SG&A as a percentage of net<br />
sales more than offset lower gross margin. Gross margin was down<br />
due to higher <strong>com</strong>modity costs and a less profitable mix driven<br />
primarily by disproportionate growth in developing regions and lower<br />
shipments of Prilosec OTC, which more than offset the benefit of<br />
increased volume scale leverage and manufacturing cost savings. SG&A<br />
improved primarily behind lower overhead spending as a percentage<br />
of net sales due to a focus on productivity improvement and Gillette<br />
synergy benefits.<br />
SNACKS AND PET CARE<br />
($ millions) <strong>2009</strong><br />
Change vs.<br />
Prior Year 2008<br />
Change vs.<br />
Prior Year<br />
Volume n/a -6% n/a +3%<br />
Net sales $3,114 -3% $3,204 +7%<br />
Net earnings $ 234 -10% $ 261 +7%<br />
Snacks and Pet Care net sales decreased 3% to $3.1 billion in <strong>2009</strong><br />
on a 6% decline in unit volume. Price increases to offset higher<br />
<strong>com</strong>modity costs added 9% to net sales. Product mix reduced net<br />
sales by 2% due to lower shipments of Eukanuba and premium snack<br />
products, which have higher than segment average selling prices.<br />
Unfavorable foreign exchange reduced net sales by 4%. Organic sales<br />
increased 1%. Snacks volume decreased high single digits due to<br />
lower merchandising support and trade inventory levels, a high base<br />
period, which included the Rice Infusion, Extreme Flavors and Stix<br />
product launches and market share declines following price increases.<br />
Our global snacks market share declined about 1 point versus the prior<br />
year. Volume in Pet Care declined mid-single digits mainly due to<br />
declines in premium nutrition business following multiple price increases.<br />
Net earnings in <strong>2009</strong> were down 10% to $234 million on lower<br />
net sales and a 60-basis point reduction in net earnings margin.<br />
A reduction in gross margin and a higher effective tax rate each<br />
reduced net earnings margin. These impacts were partially offset by<br />
lower SG&A as a percentage of net sales. Gross margin declined due<br />
to higher <strong>com</strong>modity costs, partially offset by higher selling prices<br />
and manufacturing cost savings. SG&A as a percentage of net sales<br />
declined due to reductions in both marketing and overhead spending.<br />
Snacks and Pet Care net sales increased 7% to $3.2 billion in 2008.<br />
Net sales grew behind a 3% volume increase, a positive 1% price<br />
impact resulting from price increases in Pet Care and a 4% favorable<br />
foreign exchange impact. Product mix had a negative 1% impact on<br />
net sales from an increase in Snacks volume, which has lower selling<br />
prices than the segment average. Snacks volume was up high single<br />
digits behind the launch of Rice Infusion in Western Europe and Extreme<br />
Flavors and Pringles Stix in North America. In Pet Care, volume was<br />
down low single digits due to negative impacts from the voluntary<br />
wet pet food recall in the U.S. in March 2007 that contributed to<br />
approximately a 1% decline in our U.S. market share. Net earnings in<br />
Snacks and Pet Care were up 7% to $261 million in 2008 due to sales<br />
growth. Operating margin was consistent with the prior year as lower<br />
gross margin was offset by improved SG&A as a percentage of net<br />
sales. Gross margin was down as higher <strong>com</strong>modity costs across the<br />
segment more than offset price increases, base period pet food<br />
recall impacts and manufacturing cost savings. SG&A decreased as a<br />
percentage of net sales due to reductions in both overhead and<br />
marketing spending as a percentage of net sales.<br />
Household Care<br />
FABRIC CARE AND HOME CARE<br />
($ millions) <strong>2009</strong><br />
Change vs.<br />
Prior Year 2008<br />
Change vs.<br />
Prior Year<br />
Volume n/a -3% n/a +6%<br />
Net sales $23,186 -2% $23,714 +11%<br />
Net earnings $ 3,032 -11% $ 3,411 +9%<br />
Fabric Care and Home Care net sales were down 2% in <strong>2009</strong> to<br />
$23.2 billion on a 3% decline in unit volume. Price increases, taken<br />
primarily to offset higher <strong>com</strong>modity costs, added 6% to net sales,<br />
while unfavorable foreign exchange reduced net sales by 5%.<br />
Organic sales increased 3%. Fabric Care, Home Care and Batteries<br />
unit volume were each down in both developed and developing<br />
regions. Volume in Fabric Care declined low single digits due to trade<br />
inventory reductions and net market share declines following price<br />
increases. Lower shipments of premium-priced Tide and Ariel were<br />
only partially offset by growth of Gain and Downy. Global value share<br />
of the fabric care market was down less than half a point behind
Management’s Discussion and Analysis The <strong>Procter</strong> & <strong>Gamble</strong> Company 41<br />
declines in U.S. all-outlet shares of Tide and Downy, partially offset by<br />
share growth of Gain. Home Care volume was down low single digits<br />
due to market contractions and trade inventory reductions. Batteries<br />
volume declined high single digits due to market contractions, trade<br />
inventory reductions and <strong>com</strong>petitive activity, which drove a 1-point<br />
market share decline of general purpose batteries.<br />
Net earnings declined 11% to $3.0 billion primarily due to reduced net<br />
earnings margin and lower net sales. Net earnings margin contracted<br />
130 basis points behind lower operating margin. Operating margin<br />
was down primarily due to a <strong>com</strong>modity-driven decline in gross margin,<br />
which was partially offset by price increases and manufacturing<br />
cost savings. Lower marketing spending as a percentage of net sales<br />
was largely offset by higher overhead spending as a percentage of<br />
net sales.<br />
Fabric Care and Home Care net sales in 2008 increased 11% to<br />
$23.7 billion. Volume was up 6%, price increases added 1% and<br />
favorable foreign exchange added 5% to net sales growth. This was<br />
partially offset by a negative 1% mix impact primarily from disproportionate<br />
growth in developing regions and a shift toward larger sizes<br />
in fabric care, both of which have selling prices below the segment<br />
average. Fabric Care volume increased mid-single digits behind high<br />
single-digit growth in developing regions and mid-single-digit<br />
growth in developed regions. Growth was driven by the liquid laundry<br />
detergent <strong>com</strong>paction launch in North America and initiative activity<br />
on Tide, Gain, Ariel and Downy. Home Care volume was up midsingle<br />
digits due to double-digit growth in developing regions and<br />
high-teens growth on Febreze from the launch of Febreze Candles.<br />
Batteries volume was up mid-single digits behind double-digit growth<br />
in developing regions and mid-single-digit growth in developed<br />
regions. Net earnings in Fabric Care and Home Care increased 9% to<br />
$3.4 billion in 2008 primarily behind higher net sales. Net earnings<br />
margin was down 20 basis points primarily due to lower gross margin,<br />
partially offset by a reduction in SG&A as a percentage of net sales.<br />
Gross margin was down due to higher <strong>com</strong>modity costs, which more<br />
than offset benefits from pricing, increased volume scale leverage and<br />
manufacturing cost savings projects. SG&A improved as a percentage<br />
of net sales due to lower overhead spending as a percentage of net<br />
sales resulting from a focus on overhead productivity improvements.<br />
BABY CARE AND FAMILY CARE<br />
($ millions) <strong>2009</strong><br />
Change vs.<br />
Prior Year 2008<br />
Change vs.<br />
Prior Year<br />
Volume n/a +1% n/a +4%<br />
Net sales $14,103 +1% $13,898 +9%<br />
Net earnings $ 1,770 +2% $ 1,728 +20%<br />
Baby Care and Family Care net sales increased 1% to $14.1 billion in<br />
<strong>2009</strong> on 1% volume growth. Pricing to help recover higher <strong>com</strong>modity<br />
and energy costs contributed 5% to net sales growth. Unfavorable<br />
foreign exchange reduced net sales by 4%. Negative product mix from<br />
higher shipments of mid-tier brands, which have lower than segment<br />
average selling prices, reduced net sales by 1%. Organic sales were up<br />
7% on a 2% increase in organic volume. Volume growth was driven<br />
by low single-digit growth in developing regions, while volume in<br />
developed regions was in line with the prior year. Baby Care volume<br />
increased low single digits due to growth of Pampers primarily in<br />
developing regions and double-digit growth of Luvs in North America.<br />
Our global market share of baby care was up nearly half a point.<br />
Family Care volume was down low single digits due to the Western<br />
European family care divestiture. Organic volume for Family Care was<br />
up low single digits behind double-digit growth of Charmin Basic and<br />
Bounty Basic. U.S. market share on Bounty was up nearly 1 point,<br />
while Charmin market share remained consistent with the prior year.<br />
Net earnings were up 2% versus the prior year to $1.8 billion due to<br />
net sales growth and higher net earnings margin. Net earnings margin<br />
increased 10 basis points as higher gross margin was partially offset<br />
by an increase in SG&A as a percentage of net sales and a higher<br />
effective tax rate. Gross margin improved due to the impact of price<br />
increases, manufacturing cost savings and more positive product mix<br />
following the Western European family care divestiture, which more<br />
than offset higher <strong>com</strong>modity and energy costs. SG&A as a percentage<br />
of net sales increased due to the higher current period overhead<br />
spending and base period reimbursements for services related to the<br />
Western European family care divestiture, partially offset by lower<br />
marketing spending.<br />
Baby Care and Family Care net sales increased 9% in 2008 to<br />
$13.9 billion. Volume was up 4%, including the impact of the Western<br />
European family care divestiture. Price increases contributed 1% to<br />
net sales and foreign exchange had a positive 4% impact on net sales.<br />
Organic volume and organic sales, which exclude the impacts of the<br />
Western European family care divestiture and foreign exchange, both<br />
grew 8%. Organic volume growth was balanced across the segment<br />
with high single-digit growth in both Baby Care and Family Care.<br />
Baby Care volume in developed regions was up mid-single digits<br />
behind growth on the Pampers Baby Stages of Development and on<br />
the Baby Dry Caterpillar Flex initiative. In developing regions, Baby<br />
Care volume was up double digits behind continued growth on<br />
Pampers. Family Care volume was down low single digits due to the<br />
divestiture of the Western European family care business but was up<br />
high single digits on an organic basis behind the Bounty and Charmin<br />
product restages. U.S. market share on both Bounty and Charmin<br />
was up over 1 point. Net earnings in Baby Care and Family Care were<br />
up 20% to $1.7 billion in 2008 behind higher net sales and earnings<br />
margin expansion. Net earnings margin improved 110 basis points<br />
primarily behind higher gross margin and lower SG&A as a percentage<br />
of net sales. Gross margin was up due to a more profitable product<br />
mix following the Western Europe family care divestiture, the benefit<br />
of increased volume scale leverage, pricing and manufacturing cost<br />
savings projects, which more than offset higher <strong>com</strong>modity and<br />
energy costs. SG&A improved as a percentage of net sales due to<br />
lower overhead spending as a percentage of net sales, partially offset<br />
by higher marketing expenses as a percentage of net sales.
42 The <strong>Procter</strong> & <strong>Gamble</strong> Company Management’s Discussion and Analysis<br />
Corporate<br />
Corporate includes certain operating and non-operating activities not<br />
allocated to specific business units. These include: the incidental<br />
businesses managed at the corporate level; financing and investing<br />
activities; other general corporate items; the historical results of certain<br />
divested brands and categories; and certain restructuring-type activities<br />
to maintain a <strong>com</strong>petitive cost structure, including manufacturing<br />
and workforce optimization. Corporate also includes reconciling items<br />
to adjust the accounting policies used in the segments to U.S. GAAP.<br />
The most significant reconciling items include in<strong>com</strong>e taxes (to adjust<br />
from statutory rates that are reflected in the segments to the overall<br />
Company effective tax rate), adjustments for unconsolidated entities<br />
(to eliminate sales, cost of products sold and SG&A for entities that<br />
are consolidated in the segments but accounted for using the<br />
equity method for U.S. GAAP) and minority interest adjustments for<br />
subsidiaries where we do not have 100% ownership. Since certain<br />
unconsolidated entities and less than 100%-owned subsidiaries are<br />
managed as integral parts of the Company, they are accounted for<br />
similar to a wholly owned subsidiary for management and segment<br />
purposes. This means our segment results recognize 100% of each<br />
in<strong>com</strong>e statement <strong>com</strong>ponent through before-tax earnings in the<br />
segments, with eliminations for unconsolidated entities in Corporate.<br />
In determining segment after-tax net earnings, we apply the statutory<br />
tax rates (with adjustments to arrive at the Company’s effective tax<br />
rate in Corporate) and eliminate the share of earnings applicable to<br />
other ownership interests, in a manner similar to minority interest.<br />
Corporate net sales primarily reflect the adjustment to eliminate the<br />
sales of unconsolidated entities included in business segment results.<br />
Accordingly, Corporate net sales is generally a negative balance.<br />
Negative net sales in Corporate declined $86 million in <strong>2009</strong> primarily<br />
driven by lower adjustments to eliminate these sales. These adjustments<br />
decreased due to lower net sales of existing unconsolidated entities.<br />
Net expenses from continuing operations decreased $316 million to<br />
$201 million. The decrease was primarily due to corporate hedging<br />
impacts, lower interest expense and higher current period divestiture<br />
gains, partially offset by higher restructuring spending. These items<br />
are discussed in more detail in the Results of Operations section.<br />
In 2008, negative net sales increased $474 million in Corporate<br />
primarily driven by higher adjustments to eliminate the impact of<br />
joint venture net sales for unconsolidated entities. These adjustments<br />
increased due to sales growth of existing unconsolidated entities and<br />
the addition of the Swiss Precision Diagnostics business. Net expenses<br />
in Corporate decreased $450 million in 2008. The decrease was<br />
driven primarily by a lower tax rate resulting from the net benefits of<br />
adjustments to reserves for uncertain tax positions.<br />
FINANCIAL CONDITION<br />
We believe our financial condition continues to be of high quality, as<br />
evidenced by our ability to generate substantial cash from operations<br />
and ready access to capital markets at <strong>com</strong>petitive rates.<br />
Operating cash flow provides the primary source of funds to finance<br />
operating needs and capital expenditures. Excess operating cash is<br />
used first to fund shareholder dividends. Other discretionary uses<br />
include share repurchases and “tack-on” acquisitions to <strong>com</strong>plement<br />
our portfolio of brands and geographies. As necessary, we may<br />
supplement operating cash flow with debt to fund these activities.<br />
The overall cash position of the Company reflects our strong business<br />
results and a global cash management strategy that takes into account<br />
liquidity management, economic factors and tax considerations.<br />
Operating Activities<br />
Operating cash flow was $14.9 billion in <strong>2009</strong>, a decrease of 1%<br />
versus the prior year total of $15.0 billion. Operating cash flow<br />
resulted primarily from net earnings adjusted for non-cash items<br />
(depreciation and amortization, stock-based <strong>com</strong>pensation, deferred<br />
in<strong>com</strong>e taxes and gain on the sale of businesses). The <strong>com</strong>bination of<br />
net earnings and non-cash items provided $15.3 billion of operating<br />
cash as <strong>com</strong>pared to $16.7 billion in the prior year. The decrease in<br />
operating cash flow versus 2008 was primarily due to a decline in net<br />
earnings from continuing operations. A net decrease in working<br />
capital also added to cash flow in the current year as lower accounts<br />
receivable and inventory balances were partially offset by a decline in<br />
accounts payable. The decrease in working capital was primarily due<br />
to the impact of lower net sales and our ability to adequately adjust<br />
production to better meet unit volume requirements. Accounts<br />
receivable days declined primarily due to improved collection efforts.<br />
Inventory and accounts payable days declined due in part to the<br />
optimization of our manufacturing process and inventory levels and<br />
a moderation of <strong>com</strong>modity costs late in the year. Other operating<br />
assets and liabilities reduced cash flow primarily due to changes in<br />
postretirement benefit plans. Cash flow from discontinued operations<br />
contributed $124 million to operating cash flow.<br />
In 2008, operating cash flow increased 12% over the prior year to<br />
$15.0 billion. Both operating cash flow and the increase in operating<br />
cash flow over the prior year resulted primarily from higher net<br />
earnings and non-cash charges (depreciation and amortization,<br />
stock-based <strong>com</strong>pensation, deferred in<strong>com</strong>e taxes and gain on the<br />
sale of businesses). Working capital balances increased primarily to<br />
support business growth resulting in a net use of cash. Cash flow<br />
from discontinued operations contributed $263 million to operating<br />
cash flow.<br />
Free Cash Flow. We view free cash flow as an important measure<br />
because it is one factor impacting the amount of cash available for<br />
dividends and discretionary investment. It is defined as operating cash<br />
flow less capital expenditures and is one of the measures used to<br />
evaluate senior management and determine their at-risk <strong>com</strong>pensation.<br />
Free cash flow was $11.7 billion in <strong>2009</strong>, <strong>com</strong>pared to $12.0 billion in<br />
2008. Free cash flow decreased as a result of higher capital spending<br />
and lower operating cash flow. Free cash flow productivity, defined as<br />
the ratio of free cash flow to net earnings, was 87% in <strong>2009</strong>. This is
Management’s Discussion and Analysis The <strong>Procter</strong> & <strong>Gamble</strong> Company 43<br />
below our 90% target primarily due to the gain on the Folgers coffee<br />
transaction which lowered productivity by approximately 15% because<br />
the gain is included in net earnings but had no impact on operating<br />
cash flow.<br />
In 2008, free cash flow was $12.0 billion, <strong>com</strong>pared to $10.5 billion<br />
in 2007. Free cash flow increased primarily as a result of higher<br />
operating cash flow. Capital expenditures were $3.0 billion and 3.7%<br />
of net sales. Free cash flow productivity was 99% in 2008, ahead of<br />
our 90% target.<br />
FREE CASH FLOW PRODUCTIVITY<br />
(% of net earnings)<br />
07<br />
08<br />
09<br />
Target 90%<br />
87%<br />
101%<br />
99%<br />
Investing Activities<br />
Net investing activities used $2.4 billion of cash in <strong>2009</strong> and $2.5 billion<br />
in 2008 mainly due to capital spending.<br />
Capital Spending. We view capital spending efficiency as a critical<br />
<strong>com</strong>ponent of our overall cash management strategy. Capital<br />
expenditures in <strong>2009</strong> were $3.2 billion, <strong>com</strong>pared to $3.0 billion in<br />
2008. Capital spending as a percentage of net sales was 4.1% in <strong>2009</strong>,<br />
<strong>com</strong>pared to 3.7% in 2008, as we continued to make investments to<br />
support capacity, innovation and cost savings. Capital spending for<br />
our discontinued Coffee business was $3 million and $30 million in<br />
<strong>2009</strong> and 2008, respectively.<br />
CAPITAL SPENDING<br />
(% of net sales)<br />
07<br />
08<br />
09<br />
3.7%<br />
3.9%<br />
4.1%<br />
Acquisitions. Acquisitions used $368 million of cash in <strong>2009</strong> primarily<br />
for the acquisition of Nioxin, a leader in the scalp care professional<br />
hair care market, which was incorporated into Beauty. In 2008,<br />
acquisitions used $381 million of cash primarily for the acquisition of<br />
Frederic Fekkai, a premium hair care brand, in Beauty.<br />
Proceeds from Asset Sales. Proceeds from asset sales were<br />
$1.1 billion in <strong>2009</strong> mainly due to the sale of our Coffee business<br />
and the Thermacare brand. Of these proceeds, $350 million related<br />
to debt issued in connection with the Folgers coffee transaction.<br />
The underlying debt obligation was transferred to The J.M. Smucker<br />
Company pursuant to the transaction. No cash was received from<br />
Smucker in the exchange transaction. During <strong>2009</strong>, we also divested<br />
our Thermacare brand and a number of other minor brands. In 2008,<br />
proceeds from asset sales were $928 million primarily behind the sale<br />
of our Western Europe family care business as well as several minor<br />
Beauty and Health Care divestitures.<br />
Financing Activities<br />
Dividend Payments. Our first discretionary use of cash is dividend<br />
payments. Dividends per <strong>com</strong>mon share increased 13% to $1.64<br />
per share in <strong>2009</strong>. Total dividend payments to both <strong>com</strong>mon and<br />
preferred shareholders were $5.0 billion, $4.7 billion and $4.2 billion<br />
in <strong>2009</strong>, 2008 and 2007, respectively. In April <strong>2009</strong>, the Board of<br />
Directors declared an increase in our quarterly dividend from $0.40<br />
to $0.44 per share on Common Stock and Series A and B ESOP<br />
Convertible Class A Preferred Stock.<br />
DIVIDENDS<br />
(per <strong>com</strong>mon share)<br />
07<br />
08<br />
09<br />
$1.28<br />
$1.45<br />
$1.64<br />
Long-Term and Short-Term Debt. We maintain debt levels we consider<br />
appropriate after evaluating a number of factors, including cash flow<br />
expectations, cash requirements for ongoing operations, investment<br />
and financing plans (including acquisitions and share repurchase<br />
activities) and the overall cost of capital. Total debt was $37.0 billion<br />
in <strong>2009</strong>, $36.7 billion in 2008 and $35.4 billion in 2007. Debt<br />
increased in <strong>2009</strong> and 2008 primarily to fund our share repurchase<br />
plan discussed below.<br />
Treasury Purchases. In 2007, we began to acquire $24–30 billion of<br />
our outstanding shares under a publicly announced three-year share<br />
repurchase plan. To date, we have acquired $16.3 billion of shares<br />
under this repurchase plan. Total share repurchases were $6.4 billion<br />
in <strong>2009</strong> and $10.0 billion in 2008, nearly all of which were made under<br />
our publicly announced share repurchase plan. Total share repurchases<br />
under the publicly announced plan may be below the announced<br />
range due to lower earnings growth in fiscal <strong>2009</strong> and 2010 versus<br />
expectations at the time the plan was publicly announced.<br />
In November 2008, we <strong>com</strong>pleted the divestiture of our Folgers coffee<br />
subsidiary. In connection with this divestiture, 38.7 million shares of<br />
P&G <strong>com</strong>mon stock were tendered by shareholders and exchanged for<br />
all shares of Folgers <strong>com</strong>mon stock, resulting in an increase of treasury<br />
stock of $2.5 billion.<br />
Liquidity<br />
Our current liabilities exceeded current assets by $9.0 billion, driven<br />
by our short-term debt position. We utilize short- and long-term debt<br />
to fund discretionary items such as acquisitions and share repurchases.<br />
We anticipate being able to support our short-term liquidity and<br />
operating needs largely through cash generated from operations.<br />
We have strong short- and long-term debt ratings which despite the<br />
current credit crisis have enabled and should continue to enable us to<br />
refinance our debt as it be<strong>com</strong>es due at favorable rates in <strong>com</strong>mercial<br />
paper and bond markets. In addition, we have agreements with a<br />
diverse group of financial institutions that, if needed, should provide<br />
sufficient credit funding to meet short-term financing requirements.
44 The <strong>Procter</strong> & <strong>Gamble</strong> Company Management’s Discussion and Analysis<br />
Our short-term credit ratings from Moody’s and Standard & Poor’s<br />
(S&P) are P-1 and A-1+, respectively. Our Moody’s and S&P long-term<br />
credit ratings are Aa3 with a negative outlook and AA- with a stable<br />
outlook, respectively.<br />
We maintain three bank credit facilities: a $6 billion 5-year facility<br />
expiring in August 2012, a $3 billion 5-year facility expiring in August<br />
2012 and a $1.8 billion 364-day facility expiring in June 2010. The<br />
credit facilities are in place to support our ongoing <strong>com</strong>mercial paper<br />
program. The two 5-year facilities can be extended for certain periods<br />
of time as specified in, and in accordance with, the terms of each of<br />
these credit agreements. We anticipate that these facilities will remain<br />
largely undrawn for the foreseeable future. These credit facilities do<br />
not have cross-default or ratings triggers, nor do they have material<br />
adverse events clauses, except at the time of signing. In addition to<br />
these credit facilities, we have an automatically effective registration<br />
statement on Form S-3 filed with the SEC that is available for registered<br />
offerings of short- or long-term debt securities.<br />
Guarantees and Other Off-Balance Sheet Arrangements<br />
We do not have guarantees or other off-balance sheet financing<br />
arrangements, including variable interest entities, which we believe<br />
could have a material impact on financial condition or liquidity.<br />
Contractual Commitments<br />
The following table provides information on the amount and payable date of our contractual <strong>com</strong>mitments as of June 30, <strong>2009</strong>.<br />
($ millions) Total<br />
RECORDED LIABILITIES<br />
Less Than<br />
1 Year 1–3 Years 3–5 Years<br />
Total debt $36,631 $16,270 $1,438 $6,091 $12,832<br />
Capital leases 392 46 84 76 186<br />
Unrecognized tax benefit (1) — — — — —<br />
OTHER<br />
Interest payments relating to long-term debt 12,616 1,183 2,469 1,788 7,176<br />
Operating leases (2) 1,620 305 495 378 442<br />
Minimum pension funding (3) 1,499 616 883 — —<br />
Purchase obligations (4) 3,897 1,258 1,659 681 299<br />
TOTAL CONTRACTUAL COMMITMENTS 56,655 19,678 7,028 9,014 20,935<br />
(1) As of June 30, <strong>2009</strong>, the Company’s Consolidated Balance Sheet reflects a liability for unrecognized tax benefits of $2.7 billion, including $736 of interest and penalties. Due to the high degree of<br />
uncertainty regarding the timing of future cash outflows of liabilities for unrecognized tax benefits, a reasonable estimate of the period of cash settlement beyond the balance sheet date of June 30,<br />
<strong>2009</strong>, can not be made.<br />
(2) Operating lease obligations are shown net of guaranteed sublease in<strong>com</strong>e.<br />
(3) Represents future pension payments to <strong>com</strong>ply with local funding requirements. The projected payments beyond fiscal year 2012 are not currently determinable.<br />
(4) Primarily reflects future contractual payments under various take-or-pay arrangements entered into as part of the normal course of business. Commitments made under take-or-pay obligations<br />
represent future purchases in line with expected usage to obtain favorable pricing. Approximately 43% relates to service contracts for information technology, human resources management and<br />
facilities management activities that have been outsourced. While the amounts listed represent contractual obligations, we do not believe it is likely that the full contractual amount would be paid if<br />
the underlying contracts were canceled prior to maturity. In such cases, we generally are able to negotiate new contracts or cancellation penalties, resulting in a reduced payment. The amounts do<br />
not include obligations related to other contractual purchase obligations that are not take-or-pay arrangements. Such contractual purchase obligations are primarily purchase orders at fair value<br />
that are part of normal operations and are reflected in historical operating cash flow trends. We do not believe such purchase obligations will adversely affect our liquidity position.<br />
SIGNIFICANT ACCOUNTING POLICIES AND ESTIMATES<br />
In preparing our financial statements in accordance with U.S. GAAP,<br />
there are certain accounting policies that are particularly important.<br />
These include revenue recognition, in<strong>com</strong>e taxes, certain employee<br />
benefits, acquisitions and goodwill and intangible assets. We believe<br />
these accounting policies, and others set forth in Note 1 to the<br />
Consolidated Financial Statements, should be reviewed as they are<br />
integral to understanding the results of operations and financial<br />
condition of the Company. In the case of revenue recognition, these<br />
policies simply represent required accounting and there is minimal<br />
judgment or estimation involved. In other areas, they may represent<br />
a choice between acceptable accounting methods or may require<br />
substantial judgment or estimation in their application.<br />
After<br />
5 Years<br />
Due to the nature of our business, these estimates generally are not<br />
considered highly uncertain at the time of estimation. Accordingly,<br />
they are not expected to result in changes that would materially<br />
affect our financial condition, results of operations or cash flows in<br />
any given year. However, for ongoing impairment testing of goodwill<br />
and intangible valuations, significant changes in the underlying<br />
assumptions used in the valuation models, including discount and tax<br />
rates or future cash flow projections, versus those anticipated at the<br />
time of the initial valuations, could result in impairment charges that<br />
could materially affect the financial statements in any given year.<br />
The Company has discussed the selection of significant accounting<br />
policies and the effect of estimates with the Audit Committee of the<br />
Company’s Board of Directors.
Management’s Discussion and Analysis The <strong>Procter</strong> & <strong>Gamble</strong> Company 45<br />
Revenue Recognition<br />
Most of our revenue transactions represent sales of inventory. We<br />
recognize revenue when title, ownership and risk of loss transfer to<br />
the customer, which can be on the date of shipment or the date of<br />
receipt by the customer. The revenue recorded is presented net of sales<br />
and other taxes we collect on behalf of governmental authorities and<br />
includes shipping and handling costs, which generally are included in<br />
the list price to the customer. A provision for payment discounts and<br />
product return allowances is recorded as a reduction of sales within the<br />
same period that the revenue is recognized. We offer sales incentives<br />
to customers and consumers through various programs, consisting<br />
primarily of customer pricing allowances, merchandising funds and<br />
consumer coupons. The cost of these programs is recognized as<br />
incurred and recorded as a reduction of sales. Given the nature of our<br />
business, revenue recognition practices do not contain estimates that<br />
materially affect results of operations.<br />
In<strong>com</strong>e Taxes<br />
Our annual tax rate is determined based on our in<strong>com</strong>e, statutory tax<br />
rates and the tax impacts of items treated differently for tax purposes<br />
than for financial reporting purposes. Tax law requires certain items<br />
to be included in the tax return at different times than the items are<br />
reflected in the financial statements. Some of these differences are<br />
permanent, such as expenses that are not deductible in our tax return,<br />
and some differences are temporary, reversing over time, such as<br />
depreciation expense. These temporary differences create deferred tax<br />
assets and liabilities.<br />
Deferred tax assets generally represent the tax effect of items that can<br />
be used as a tax deduction or credit in future years for which we have<br />
already recorded the tax benefit in our in<strong>com</strong>e statement. Deferred tax<br />
liabilities generally represent tax expense recognized in our financial<br />
statements for which payment has been deferred, or the tax effect of<br />
expenditures for which a deduction has already been taken in our tax<br />
return but has not yet been recognized in our financial statements or<br />
assets recorded at fair value in business <strong>com</strong>binations for which there<br />
was no corresponding tax basis adjustment.<br />
Inherent in determining our annual tax rate are judgments regarding<br />
business plans, planning opportunities and expectations about future<br />
out<strong>com</strong>es. Realization of certain deferred tax assets is dependent upon<br />
generating sufficient taxable in<strong>com</strong>e in the appropriate jurisdiction prior<br />
to the expiration of the carry-forward periods. Although realization is<br />
not assured, management believes it is more likely than not that our<br />
deferred tax assets, net of valuation allowances, will be realized.<br />
We operate in multiple jurisdictions with <strong>com</strong>plex regulatory environments<br />
subject to different interpretations by the taxpayer and respective<br />
governmental taxing authorities. In certain of these jurisdictions we<br />
may take positions that management believes are supportable, but<br />
are potentially subject to successful challenge by the applicable taxing<br />
authority. We evaluate our tax positions and establish liabilities in<br />
accordance with the applicable accounting guidance on uncertainty<br />
in in<strong>com</strong>e taxes. We review these tax uncertainties in light of the<br />
changing facts and circumstances, such as the progress of tax audits,<br />
and adjust them accordingly. We have a number of audits in process<br />
in various jurisdictions. Although the resolution of these tax positions<br />
is uncertain, based on currently available information, we believe that<br />
the ultimate out<strong>com</strong>es will not have a material adverse effect on our<br />
financial position, results of operations or cash flows.<br />
Because there are a number of estimates and assumptions inherent in<br />
calculating the various <strong>com</strong>ponents of our tax provision, certain<br />
changes or future events such as changes in tax legislation, geographic<br />
mix of earnings, <strong>com</strong>pletion of tax audits or earnings repatriation plans<br />
could have an impact on those estimates and our effective tax rate.<br />
Employee Benefits<br />
We sponsor various post-employment benefits throughout the world.<br />
These include pension plans, both defined contribution plans and<br />
defined benefit plans, and other post-employment benefit (OPEB) plans,<br />
consisting primarily of health care and life insurance for retirees. For<br />
accounting purposes, the defined benefit and OPEB plans require<br />
assumptions to estimate the projected and accumulated benefit<br />
obligations, including the following variables: discount rate; expected<br />
salary increases; certain employee-related factors, such as turnover,<br />
retirement age and mortality; expected return on assets and health<br />
care cost trend rates. These and other assumptions affect the annual<br />
expense and obligations recognized for the underlying plans. Our<br />
assumptions reflect our historical experiences and management’s<br />
best judgment regarding future expectations. In accordance with<br />
U.S. GAAP, the net amount by which actual results differ from our<br />
assumptions is deferred. If this net deferred amount exceeds 10% of<br />
the greater of plan assets or liabilities, a portion of the deferred<br />
amount is included in expense for the following year. The cost or<br />
benefit of plan changes, such as increasing or decreasing benefits for<br />
prior employee service (prior service cost), is deferred and included in<br />
expense on a straight-line basis over the average remaining service<br />
period of the employees expected to receive benefits.<br />
The expected return on plan assets assumption is important, since many<br />
of our defined benefit plans and our primary OPEB plan are funded.<br />
The process for setting the expected rates of return is described in<br />
Note 8 to the Consolidated Financial Statements. For <strong>2009</strong>, the average<br />
return on assets assumptions for pension plan assets andOPEB assets<br />
were 7.4% and 9.3%, respectively. A change in the rate of return of<br />
0.5% for both pension and OPEB assets would impact annual benefit<br />
expense by less than $40 million after tax.<br />
Since pension and OPEB liabilities are measured on a discounted basis,<br />
the discount rate is a significant assumption. Discount rates used for<br />
our U.S. defined benefit and OPEB plans are based on a yield curve<br />
constructed from a portfolio of high quality bonds for which the timing<br />
and amount of cash outflows approximate the estimated payouts of<br />
the plan. For our international plans, the discount rates are set by<br />
benchmarking against investment grade corporate bonds rated AA<br />
or better. The average discount rate on the defined benefit pension<br />
plans of 6.0% represents a weighted average of local rates in countries<br />
where such plans exist. A 0.5% change in the discount rate would<br />
impact annual after-tax defined benefit pension expense by less than
46 The <strong>Procter</strong> & <strong>Gamble</strong> Company Management’s Discussion and Analysis<br />
$50 million. The average discount rate on the OPEB plan of 6.4%<br />
reflects the higher interest rates generally applicable in the U.S., which<br />
is where a majority of the plan participants receive benefits. A 0.5%<br />
change in the discount rate would impact annual after-tax OPEB<br />
expense by less than $20 million.<br />
Certain defined contribution pension and OPEB benefits in the U.S. are<br />
funded by the Employee Stock Ownership Plan (ESOP), as discussed<br />
in Note 8 to the Consolidated Financial Statements.<br />
Acquisitions<br />
We account for acquired businesses using the purchase method of<br />
accounting. Under the purchase method, our Consolidated Financial<br />
Statements reflect the operations of an acquired business starting from<br />
the <strong>com</strong>pletion of the acquisition. In addition, the assets acquired<br />
and liabilities assumed must be recorded at the date of acquisition at<br />
their respective estimated fair values, with any excess of the purchase<br />
price over the estimated fair values of the net assets acquired<br />
recorded as goodwill.<br />
Significant judgment is required in estimating the fair value of intangible<br />
assets and in assigning their respective useful lives. Accordingly,<br />
we typically obtain the assistance of third-party valuation specialists<br />
for significant items. The fair value estimates are based on available<br />
historical information and on future expectations and assumptions<br />
deemed reasonable by management, but are inherently uncertain.<br />
We typically use an in<strong>com</strong>e method to estimate the fair value of<br />
intangible assets, which is based on forecasts of the expected future<br />
cash flows attributable to the respective assets. Significant estimates<br />
and assumptions inherent in the valuations reflect a consideration of<br />
other marketplace participants, and include the amount and timing of<br />
future cash flows (including expected growth rates and profitability),<br />
the underlying product or technology life cycles, economic barriers to<br />
entry, a brand’s relative market position and the discount rate applied<br />
to the cash flows. Unanticipated market or macroeconomic events<br />
and circumstances may occur, which could affect the accuracy or<br />
validity of the estimates and assumptions.<br />
Determining the useful life of an intangible asset also requires judgment.<br />
Certain brand intangibles are expected to have indefinite lives<br />
based on their history and our plans to continue to support and build<br />
the acquired brands. Other acquired brands are expected to have<br />
determinable useful lives. Our assessment as to brands that have an<br />
indefinite life and those that have a determinable life is based on a<br />
number of factors including <strong>com</strong>petitive environment, market share,<br />
brand history, underlying product life cycles, operating plans and the<br />
macroeconomic environment of the countries in which the brands<br />
are sold. Our estimates of the useful lives of determinable-lived<br />
intangibles, primarily including brands, technologies and customer<br />
relationships, are primarily based on these same factors. All of our<br />
acquired technology and customer-related intangibles are expected<br />
to have determinable useful lives.<br />
Other significant estimates associated with the accounting for acquisitions<br />
include exit costs. Provided certain criteria are met, exit costs<br />
related to acquired operations are treated as assumed liabilities. If<br />
those criteria are not met, the costs are treated as operating expenses<br />
of the <strong>com</strong>bined <strong>com</strong>pany as incurred. Exit costs, consisting primarily<br />
of severance costs, facility closure and other exit costs related to<br />
redundant manufacturing, selling, general and administrative functions,<br />
are based upon plans that have been <strong>com</strong>mitted to by management<br />
but which are subject to refinement. Significant estimates and<br />
assumptions inherent in the calculation of exit costs relate to the<br />
number of employees that will be terminated, future costs to operate<br />
and eventually vacate duplicate facilities and costs to terminate agreements.<br />
These estimates and assumptions may change as we execute<br />
approved plans. Decreases to the estimated costs are generally<br />
recorded as an adjustment to goodwill. Increases to the estimates are<br />
generally recorded as an adjustment to goodwill during the purchase<br />
price allocation period (generally within one year of the acquisition<br />
date) and as operating expenses thereafter. For acquisitions closed<br />
after June 30, <strong>2009</strong>, exit costs will no longer be treated as acquired<br />
liabilities. Rather, they will be charged to expense as incurred post<br />
acquisition in accordance with the applicable new accounting guidance<br />
(see discussion of the new business <strong>com</strong>binations accounting guidance<br />
in the New Accounting Pronouncements section below).<br />
Goodwill and Intangible Assets<br />
Acquired intangible assets may represent indefinite-lived assets<br />
(e.g., certain trademarks or brands), determinable-lived intangibles<br />
(e.g., certain trademarks or brands, customer relationships, patents<br />
and technologies) or residual goodwill. Of these, only the costs of<br />
determinable-lived intangibles are amortized to expense over their<br />
estimated life. The value of indefinite-lived intangible assets and<br />
residual goodwill is not amortized, but is tested at least annually for<br />
impairment. Our impairment testing for goodwill is performed<br />
separately from our impairment testing of indefinite-lived intangibles.<br />
We test goodwill for impairment, at least annually, by reviewing the<br />
book value <strong>com</strong>pared to the fair value at the reportable unit level.<br />
We test individual indefinite-lived intangibles at least annually by<br />
reviewing the individual book values <strong>com</strong>pared to the fair value. We<br />
determine the fair value of our reporting units based on the in<strong>com</strong>e<br />
approach. Under the in<strong>com</strong>e approach, we calculate the fair value of<br />
our reporting units based on the present value of estimated future<br />
cash flows. Considerable management judgment is necessary to<br />
evaluate the impact of operating and macroeconomic changes and<br />
to estimate future cash flows to measure fair value. Assumptions used<br />
in our impairment evaluations, such as forecasted growth rates and<br />
cost of capital, are consistent with internal projections and operating<br />
plans. We believe such assumptions and estimates are also <strong>com</strong>parable<br />
to those that would be used by other marketplace participants. When<br />
certain events or changes in operating conditions occur, indefinitelived<br />
intangible assets may be reclassified to a determinable life asset<br />
and an additional impairment assessment may be performed. We<br />
did not recognize any material impairment charges for goodwill or<br />
intangible assets during the years presented.
Management’s Discussion and Analysis The <strong>Procter</strong> & <strong>Gamble</strong> Company 47<br />
Our annual impairment testing for both goodwill and indefinite-lived<br />
intangible assets indicated that all reporting units and intangible assets<br />
fair values exceeded their respective recorded values. However, future<br />
changes in the judgments, assumptions and estimates that are used<br />
in our impairment testing for goodwill and indefinite-lived intangible<br />
assets, including discount and tax rates or future cash flow projections,<br />
could result in significantly different estimates of the fair values, which<br />
could result in impairment charges that could materially affect the<br />
financial statements in any given year. The recorded value of goodwill<br />
and intangible assets from recently acquired businesses are derived<br />
from more recent business operating plans and macroeconomic<br />
environmental conditions and therefore are more susceptible to an<br />
adverse change that could require an impairment charge. For example,<br />
because the Gillette intangible and goodwill amounts represent current<br />
values as of the relatively recent acquisition date, such amounts are<br />
more susceptible to an impairment risk if business operating results<br />
or macroeconomic conditions deteriorate. Gillette indefinite-lived<br />
intangible assets represent approximately 89% of the $26.9 billion of<br />
indefinite-lived intangible assets at June 30, <strong>2009</strong>. Goodwill allocated<br />
to reporting units consisting entirely of businesses purchased as part of<br />
the Gillette acquisition (Blades and Razors, Braun, Batteries) represents<br />
47% of the $56.5 billion of goodwill at June 30, <strong>2009</strong>. With the<br />
exception of our Braun business, all of our other reporting units have<br />
fair values that significantly exceed recorded values. While the fair<br />
value of our Braun business exceeds its carrying value, which includes<br />
goodwill and indefinite-lived intangibles of $2.4 billion, the economic<br />
downturn in <strong>2009</strong> has resulted in a disproportionate decline in that<br />
business in developing geographies given the more discretionary nature<br />
of home and personal grooming appliances purchases. Our valuation<br />
of the Braun business has it returning to sales and earnings growth<br />
rates consistent with our long-term business plans. Failure to achieve<br />
these business plans or a further deterioration of the macroeconomic<br />
conditions could result in a valuation that would trigger an impairment<br />
of the Braun business goodwill and intangibles.<br />
New Accounting Pronouncements<br />
On July 1, 2008, we adopted new accounting guidance on fair value<br />
measurements. This new guidance defines fair value, establishes a<br />
framework for measuring fair value in generally accepted accounting<br />
principles and expands disclosures about fair value measurements. The<br />
new guidance was effective for the Company beginning July 1, 2008,<br />
for certain financial assets and liabilities. Refer to Note 5 for additional<br />
information regarding our fair value measurements for financial assets<br />
and liabilities. The new guidance is effective for non-financial assets<br />
and liabilities recognized or disclosed at fair value on a non-recurring<br />
basis beginning July 1, <strong>2009</strong>.<br />
On January 1, <strong>2009</strong>, we adopted new accounting guidance on disclosures<br />
about derivative instruments and hedging activities. The new<br />
guidance impacts disclosures only and requires additional qualitative<br />
and quantitative information on the use of derivatives and their impact<br />
on an entity’s financial position, results of operations and cash flows.<br />
Refer to Note 5 for additional information regarding our risk management<br />
activities, including derivative instruments and hedging activities.<br />
In December 2007, the Financial Accounting Standards Board (FASB)<br />
issued new accounting guidance on business <strong>com</strong>binations and<br />
noncontrolling interests in consolidated financial statements. The new<br />
guidance revises the method of accounting for a number of aspects<br />
of business <strong>com</strong>binations and noncontrolling interests, including<br />
acquisition costs, contingencies (including contingent assets, contingent<br />
liabilities and contingent purchase price), the impacts of partial and<br />
step-acquisitions (including the valuation of net assets attributable<br />
to non-acquired minority interests), and post acquisition exit activities<br />
of acquired businesses. The new guidance will be effective for the<br />
Company beginning July 1, <strong>2009</strong>.<br />
No other new accounting pronouncement issued or effective during<br />
the fiscal year has had or is expected to have a material impact on the<br />
Consolidated Financial Statements.<br />
OTHER INFORMATION<br />
Hedging and Derivative Financial Instruments<br />
As a multinational <strong>com</strong>pany with diverse product offerings, we are<br />
exposed to market risks, such as changes in interest rates, currency<br />
exchange rates and <strong>com</strong>modity prices. We evaluate exposures on a<br />
centralized basis to take advantage of natural exposure netting and<br />
correlation. To the extent we choose to manage volatility associated<br />
with the net exposures, we enter into various financial transactions<br />
which we account for using the applicable accounting guidance for<br />
derivative instruments and hedging activities. These financial transactions<br />
are governed by our policies covering acceptable counterparty<br />
exposure, instrument types and other hedging practices. Note 5 to<br />
the Consolidated Financial Statements includes a detailed discussion<br />
of our accounting policies for financial instruments.<br />
Derivative positions are monitored using techniques including market<br />
valuation, sensitivity analysis and value-at-risk modeling. The tests for<br />
interest rate, currency rate and <strong>com</strong>modity price exposures discussed<br />
below are based on the CorporateManager value-at-risk model<br />
using a one-year horizon and a 95% confidence level. The model<br />
incorporates the impact of correlation (the degree to which exposures<br />
move together over time) and diversification (from holding multiple<br />
currency, <strong>com</strong>modity and interest rate instruments) and assumes that<br />
financial returns are normally distributed. Estimates of volatility and<br />
correlations of market factors are drawn from the RiskMetrics dataset<br />
as of June 30, <strong>2009</strong>. In cases where data is unavailable in RiskMetrics ,<br />
a reasonable proxy is included.<br />
Our market risk exposures relative to interest rates, currency rates and<br />
<strong>com</strong>modity prices, as discussed below, have not changed materially<br />
versus the previous reporting period. In addition, we are not aware of<br />
any facts or circumstances that would significantly impact such<br />
exposures in the near term.<br />
Interest Rate Exposure on Financial Instruments. Interest rate swaps<br />
are used to hedge exposures to interest rate movement on underlying<br />
debt obligations. Certain interest rate swaps denominated in foreign<br />
currencies are designated to hedge exposures to currency exchange
48 The <strong>Procter</strong> & <strong>Gamble</strong> Company Management’s Discussion and Analysis<br />
rate movements on our investments in foreign operations. These<br />
currency interest rate swaps are designated as hedges of the Company’s<br />
foreign net investments.<br />
Based on our overall interest rate exposure as of and during the year<br />
ended June 30, <strong>2009</strong>, including derivative and other instruments<br />
sensitive to interest rates, we believe a near-term change in interest<br />
rates, at a 95% confidence level based on historical interest rate<br />
movements, would not materially affect our financial statements.<br />
Currency Rate Exposure on Financial Instruments. Because we<br />
manufacture and sell products in a number of countries throughout<br />
the world, we are exposed to the impact on revenue and expenses of<br />
movements in currency exchange rates. The primary purpose of our<br />
currency hedging activities is to reduce the risk that our financial<br />
position will be adversely affected by short-term changes in exchange<br />
rates. Corporate policy prescribes the range of allowable hedging<br />
activity. We primarily use forward contracts with maturities of less than<br />
18 months. In addition, we enter into certain currency swaps with<br />
maturities of up to five years to hedge our exposure to exchange rate<br />
movements on inter<strong>com</strong>pany financing transactions.<br />
Based on our overall currency rate exposure as of and during the year<br />
ended June 30, <strong>2009</strong>, we believe, at a 95% confidence level based<br />
on historical currency rate movements, the impact of a near-term<br />
change in currency rates on derivative and other instruments would<br />
not materially affect our financial statements.<br />
Commodity Price Exposure on Financial Instruments. We use raw<br />
materials that are subject to price volatility caused by weather, supply<br />
conditions, political and economic variables and other unpredictable<br />
factors. In addition to fixed price contracts, we use futures, options<br />
and swap contracts to manage the volatility related to the above<br />
exposures.<br />
Based on our overall <strong>com</strong>modity price exposure as of and during the<br />
year ended June 30, <strong>2009</strong>, we believe, at a 95% confidence level<br />
based on historical <strong>com</strong>modity price movements, the impact of a<br />
near-term change in <strong>com</strong>modity prices on derivative and other<br />
instruments would not materially affect our financial statements.<br />
Measures Not Defined By U.S. GAAP<br />
Our discussion of financial results includes several “non-GAAP”<br />
financial measures. We believe these measures provide our investors<br />
with additional information about our underlying results and trends, as<br />
well as insight to some of the metrics used to evaluate management.<br />
When used in MD&A, we have provided the <strong>com</strong>parable GAAP<br />
measure in the discussion. These measures include:<br />
Organic Sales Growth. Organic sales growth measures sales growth<br />
excluding the impacts of foreign exchange, acquisitions and divestitures<br />
from year-over-year <strong>com</strong>parisons. We believe this provides<br />
investors with a more <strong>com</strong>plete understanding of underlying results<br />
and trends by providing sales growth on a consistent basis.<br />
The following tables provide a numerical reconciliation of organic<br />
sales growth to reported net sales growth:<br />
FY <strong>2009</strong><br />
Net Sales<br />
Growth<br />
Foreign<br />
Exchange<br />
Impact<br />
Acquisition/<br />
Divestiture<br />
Impact<br />
Organic<br />
Sales<br />
Growth<br />
Beauty -4% 4% 1% 1%<br />
Grooming -9% 6% 1% -2%<br />
Health Care -7% 5% 1% -1%<br />
Snacks and Pet Care -3% 4% 0% 1%<br />
Fabric Care and Home Care -2% 5% 0% 3%<br />
Baby Care and Family Care 1% 4% 2% 7%<br />
TOTAL P&G -3% 4% 1% 2%<br />
FY 2008<br />
Net Sales<br />
Growth<br />
Foreign<br />
Exchange<br />
Impact<br />
Acquisition/<br />
Divestiture<br />
Impact<br />
Organic<br />
Sales<br />
Growth<br />
Beauty 9% -6% 1% 4%<br />
Grooming 11% -7% 0% 4%<br />
Health Care 9% -5% -1% 3%<br />
Snacks and Pet Care 7% -4% 0% 3%<br />
Fabric Care and Home Care 11% -5% 0% 6%<br />
Baby Care and Family Care 9% -4% 3% 8%<br />
TOTAL P&G 9% -5% 1% 5%<br />
Free Cash Flow. Free cash flow is defined as operating cash flow less<br />
capital spending. We view free cash flow as an important measure<br />
because it is one factor in determining the amount of cash available<br />
for dividends and discretionary investment. Free cash flow is also one<br />
of the measures used to evaluate senior management and is a factor<br />
in determining their at-risk <strong>com</strong>pensation.<br />
Free Cash Flow Productivity. Free cash flow productivity is defined as<br />
the ratio of free cash flow to net earnings. Our target is to generate free<br />
cash flow at or above 90% of net earnings. Free cash flow productivity<br />
is one of the measures used to evaluate senior management and is a<br />
factor in determining their at-risk <strong>com</strong>pensation.<br />
The following table provides a numerical reconciliation of free cash flow:<br />
Operating<br />
Cash Flow<br />
Capital<br />
Spending<br />
Free<br />
Cash Flow<br />
Net<br />
Earnings<br />
Free<br />
Cash Flow<br />
Productivity<br />
<strong>2009</strong> $14,919 $(3,238) $11,681 $13,436 87%<br />
2008 $ 15,008 $ (3,046) $ 11,962 $ 12,075 99%<br />
2007 $ 13,410 $ (2,945) $ 10,465 $ 10,340 101%<br />
2006 $ 11,372 $ (2,667) $ 8,705 $ 8,684 100%<br />
2005 $ 8,561 $ (2,181) $ 6,380 $ 6,923 92%<br />
2004 $ 9,216 $ (2,024) $ 7,192 $ 6,156 117%<br />
2003 $ 8,455 $ (1,482) $ 6,973 $ 4,788 146%<br />
2002 $ 7,672 $ (1,679) $ 5,993 $ 3,910 153%<br />
Total Free Cash Flow Since 2001 $ 69,351<br />
Average Free Cash Flow Productivity 112%
Consolidated Statements of Earnings<br />
The <strong>Procter</strong> & <strong>Gamble</strong> Company 49<br />
Amounts in millions except per share amounts; Years ended June 30 <strong>2009</strong> 2008 2007<br />
NET SALES $79,029 $81,748 $74,832<br />
Cost of products sold 38,898 39,536 35,659<br />
Selling, general and administrative expense 24,008 25,575 24,170<br />
OPERATING INCOME 16,123 16,637 15,003<br />
Interest expense 1,358 1,467 1,304<br />
Other non-operating in<strong>com</strong>e, net 560 462 565<br />
EARNINGS FROM CONTINUING OPERATIONS BEFORE INCOME TAXES 15,325 15,632 14,264<br />
In<strong>com</strong>e taxes on continuing operations 4,032 3,834 4,201<br />
NET EARNINGS FROM CONTINUING OPERATIONS 11,293 11,798 10,063<br />
NET EARNINGS FROM DISCONTINUED OPERATIONS 2,143 277 277<br />
NET EARNINGS $13,436 $12,075 $10,340<br />
BASIC NET EARNINGS PER COMMON SHARE:<br />
Earnings from continuing operations $ 3.76 $ 3.77 $ 3.13<br />
Earnings from discontinued operations 0.73 0.09 0.09<br />
BASIC NET EARNINGS PER COMMON SHARE 4.49 3.86 3.22<br />
DILUTED NET EARNINGS PER COMMON SHARE:<br />
Earnings from continuing operations 3.58 3.56 2.96<br />
Earnings from discontinued operations 0.68 0.08 0.08<br />
DILUTED NET EARNINGS PER COMMON SHARE 4.26 3.64 3.04<br />
DIVIDENDS PER COMMON SHARE $ 1.64 $ 1.45 $ 1.28<br />
See ac<strong>com</strong>panying Notes to Consolidated Financial Statements.
50 The <strong>Procter</strong> & <strong>Gamble</strong> Company<br />
Consolidated Balance Sheets<br />
Assets<br />
Amounts in millions; June 30 <strong>2009</strong> 2008<br />
CURRENT ASSETS<br />
Cash and cash equivalents $ 4,781 $ 3,313<br />
Accounts receivable 5,836 6,761<br />
Inventories<br />
Materials and supplies 1,557 2,262<br />
Work in process 672 765<br />
Finished goods 4,651 5,389<br />
Total inventories 6,880 8,416<br />
Deferred in<strong>com</strong>e taxes 1,209 2,012<br />
Prepaid expenses and other current assets 3,199 4,013<br />
TOTAL CURRENT ASSETS 21,905 24,515<br />
PROPERTY, PLANT AND EQUIPMENT<br />
Buildings 6,724 7,052<br />
Machinery and equipment 29,042 30,145<br />
Land 885 889<br />
Total property, plant and equipment 36,651 38,086<br />
Accumulated depreciation (17,189) (17,446)<br />
NET PROPERTY, PLANT AND EQUIPMENT 19,462 20,640<br />
GOODWILL AND OTHER INTANGIBLE ASSETS<br />
Goodwill 56,512 59,767<br />
Trademarks and other intangible assets, net 32,606 34,233<br />
NET GOODWILL AND OTHER INTANGIBLE ASSETS 89,118 94,000<br />
OTHER NONCURRENT ASSETS 4,348 4,837<br />
TOTAL ASSETS $134,833 $143,992<br />
See ac<strong>com</strong>panying Notes to Consolidated Financial Statements.
Consolidated Balance Sheets<br />
Liabilities and Shareholders’ Equity<br />
The <strong>Procter</strong> & <strong>Gamble</strong> Company 51<br />
Amounts in millions; June 30 <strong>2009</strong> 2008<br />
CURRENT LIABILITIES<br />
Accounts payable $ 5,980 $ 6,775<br />
Accrued and other liabilities 8,601 11,099<br />
Debt due within one year 16,320 13,084<br />
TOTAL CURRENT LIABILITIES 30,901 30,958<br />
LONG-TERM DEBT 20,652 23,581<br />
DEFERRED INCOME TAXES 10,752 11,805<br />
OTHER NONCURRENT LIABILITIES 9,429 8,154<br />
TOTAL LIABILITIES 71,734 74,498<br />
SHAREHOLDERS’ EQUITY<br />
Convertible Class A preferred stock, stated value $1 per share (600 shares authorized) 1,324 1,366<br />
Non-Voting Class B preferred stock, stated value $1 per share (200 shares authorized) — —<br />
Common stock, stated value $1 per share (10,000 shares authorized; shares issued: <strong>2009</strong> —4,007.3, 2008 —4,001.8) 4,007 4,002<br />
Additional paid-in capital 61,118 60,307<br />
Reserve for ESOP debt retirement (1,340) (1,325)<br />
Accumulated other <strong>com</strong>prehensive in<strong>com</strong>e (loss) (3,358) 3,746<br />
Treasury stock, at cost (shares held: <strong>2009</strong> —1,090.3, 2008 —969.1) (55,961) (47,588)<br />
Retained earnings 57,309 48,986<br />
TOTAL SHAREHOLDERS’ EQUITY 63,099 69,494<br />
TOTAL LIABILITIES AND SHAREHOLDERS’ EQUITY $134,833 $143,992<br />
See ac<strong>com</strong>panying Notes to Consolidated Financial Statements.
52 The <strong>Procter</strong> & <strong>Gamble</strong> Company<br />
Consolidated Statements of Shareholders’ Equity<br />
Dollars in millions/Shares in thousands<br />
Common<br />
Shares<br />
Outstanding<br />
(1) Cumulative impact of adopting new accounting guidance relates to: 2007—defined benefit and post retirement plans; 2008—uncertainty in in<strong>com</strong>e taxes; <strong>2009</strong> —split-dollar life insurance arrangements.<br />
See ac<strong>com</strong>panying Notes to Consolidated Financial Statements.<br />
Common<br />
Stock<br />
Preferred<br />
Stock<br />
Additional<br />
Paid-In<br />
Capital<br />
Reserve for<br />
ESOP Debt<br />
Retirement<br />
Accumulated<br />
Other<br />
Comprehensive<br />
In<strong>com</strong>e<br />
Treasury<br />
Stock<br />
Retained<br />
Earnings Total<br />
BALANCE JUNE 30, 2006 3,178,841 $3,976 $1,451 $57,856 $(1,288) $ (518) $(34,235) $35,666 $ 62,908<br />
Net earnings 10,340 10,340<br />
Other <strong>com</strong>prehensive in<strong>com</strong>e:<br />
Financial statement translation 2,419 2,419<br />
Hedges and investment<br />
securities, net of $459 tax (951) (951)<br />
Total <strong>com</strong>prehensive in<strong>com</strong>e $ 11,808<br />
Cumulative impact for adoption<br />
of new accounting guidance (1) (333) (333)<br />
Dividends to shareholders:<br />
Common (4,048) (4,048)<br />
Preferred, net of tax benefits (161) (161)<br />
Treasury purchases (89,829) (5,578) (5,578)<br />
Employee plan issuances 37,824 14 1,167 1,003 2,184<br />
Preferred stock conversions 5,110 (45) 7 38 —<br />
ESOP debt impacts (20) (20)<br />
BALANCE JUNE 30, 2007 3,131,946 3,990 1,406 59,030 (1,308) 617 (38,772) 41,797 66,760<br />
Net earnings 12,075 12,075<br />
Other <strong>com</strong>prehensive in<strong>com</strong>e:<br />
Financial statement translation 6,543 6,543<br />
Hedges and investment<br />
securities, net of $1,664 tax (2,906) (2,906)<br />
Defined benefit retirement<br />
plans, net of $120 tax (508) (508)<br />
Total <strong>com</strong>prehensive in<strong>com</strong>e $ 15,204<br />
Cumulative impact for adoption<br />
of new accounting guidance (1) (232) (232)<br />
Dividends to shareholders:<br />
Common (4,479) (4,479)<br />
Preferred, net of tax benefits (176) (176)<br />
Treasury purchases (148,121) (10,047) (10,047)<br />
Employee plan issuances 43,910 12 1,272 1,196 2,480<br />
Preferred stock conversions 4,982 (40) 5 35 —<br />
ESOP debt impacts (17) 1 (16)<br />
BALANCE JUNE 30, 2008 3,032,717 4,002 1,366 60,307 (1,325) 3,746 (47,588) 48,986 69,494<br />
Net earnings 13,436 13,436<br />
Other <strong>com</strong>prehensive in<strong>com</strong>e:<br />
Financial statement translation (6,151) (6,151)<br />
Hedges and investment<br />
securities, net of $452 tax 748 748<br />
Defined benefit retirement<br />
plans, net of $879 tax (1,701) (1,701)<br />
Total <strong>com</strong>prehensive in<strong>com</strong>e $ 6,332<br />
Cumulative impact for adoption<br />
of new accounting guidance (1) (84) (84)<br />
Dividends to shareholders:<br />
Common (4,852) (4,852)<br />
Preferred, net of tax benefits (192) (192)<br />
Treasury purchases (98,862) (6,370) (6,370)<br />
Employee plan issuances 16,841 5 804 428 1,237<br />
Preferred stock conversions 4,992 (42) 7 35 —<br />
Shares tendered for Folgers<br />
coffee subsidiary (38,653) (2,466) (2,466)<br />
ESOP debt impacts (15) 15 —<br />
BALANCE JUNE 30, <strong>2009</strong> 2,917,035 $4,007 $1,324 $61,118 $(1,340) $(3,358) $(55,961) $57,309 $ 63,099
Consolidated Statements of Cash Flows<br />
The <strong>Procter</strong> & <strong>Gamble</strong> Company 53<br />
Amounts in millions; Years ended June 30 <strong>2009</strong> 2008 2007<br />
CASH AND CASH EQUIVALENTS, BEGINNING OF YEAR $ 3,313 $ 5,354 $ 6,693<br />
OPERATING ACTIVITIES<br />
Net earnings 13,436 12,075 10,340<br />
Depreciation and amortization 3,082 3,166 3,130<br />
Share-based <strong>com</strong>pensation expense 516 555 668<br />
Deferred in<strong>com</strong>e taxes 596 1,214 253<br />
Gain on sale of businesses (2,377) (284) (153)<br />
Change in accounts receivable 415 432 (729)<br />
Change in inventories 721 (1,050) (389)<br />
Change in accounts payable, accrued and other liabilities (742) 297 (278)<br />
Change in other operating assets and liabilities (758) (1,270) (151)<br />
Other 30 (127) 719<br />
TOTAL OPERATING ACTIVITIES 14,919 15,008 13,410<br />
INVESTING ACTIVITIES<br />
Capital expenditures (3,238) (3,046) (2,945)<br />
Proceeds from asset sales 1,087 928 281<br />
Acquisitions, net of cash acquired (368) (381) (492)<br />
Change in investments 166 (50) 673<br />
TOTAL INVESTING ACTIVITIES (2,353) (2,549) (2,483)<br />
FINANCING ACTIVITIES<br />
Dividends to shareholders (5,044) (4,655) (4,209)<br />
Change in short-term debt (2,420) 2,650 9,006<br />
Additions to long-term debt 4,926 7,088 4,758<br />
Reductions of long-term debt (2,587) (11,747) (17,929)<br />
Treasury stock purchases (6,370) (10,047) (5,578)<br />
Impact of stock options and other 681 1,867 1,499<br />
TOTAL FINANCING ACTIVITIES (10,814) (14,844) (12,453)<br />
EFFECT OF EXCHANGE RATE CHANGES ON CASH AND CASH EQUIVALENTS (284) 344 187<br />
CHANGE IN CASH AND CASH EQUIVALENTS 1,468 (2,041) (1,339)<br />
CASH AND CASH EQUIVALENTS, END OF YEAR $ 4,781 $ 3,313 $ 5,354<br />
SUPPLEMENTAL DISCLOSURE<br />
Cash payments for:<br />
Interest $ 1,226 $ 1,373 $ 1,330<br />
In<strong>com</strong>e Taxes 3,248 3,499 4,116<br />
Assets acquired through non-cash capital leases 8 13 41<br />
Divestiture of coffee business in exchange for shares of P&G stock 2,466 — —<br />
See ac<strong>com</strong>panying Notes to Consolidated Financial Statements.
54 The <strong>Procter</strong> & <strong>Gamble</strong> Company<br />
Notes to Consolidated Financial Statements<br />
NOTE 1<br />
SUMMARY OF SIGNIFICANT ACCOUNTING POLICIES<br />
Nature of Operations<br />
The <strong>Procter</strong> & <strong>Gamble</strong> Company’s (the “Company,” “we” or “us”)<br />
business is focused on providing branded consumer goods products<br />
of superior quality and value. Our products are sold in more than<br />
180 countries primarily through retail operations including mass<br />
merchandisers, grocery stores, membership club stores, drug stores,<br />
department stores, salons and high-frequency stores. We have onthe-ground<br />
operations in approximately 80 countries.<br />
Basis of Presentation<br />
The Consolidated Financial Statements include the Company and its<br />
controlled subsidiaries. Inter<strong>com</strong>pany transactions are eliminated.<br />
Use of Estimates<br />
Preparation of financial statements in conformity with accounting<br />
principles generally accepted in the United States of America (U.S. GAAP)<br />
requires management to make estimates and assumptions that affect<br />
the amounts reported in the Consolidated Financial Statements and<br />
ac<strong>com</strong>panying disclosures. These estimates are based on management’s<br />
best knowledge of current events and actions the Company may<br />
undertake in the future. Estimates are used in accounting for, among<br />
other items, consumer and trade promotion accruals, pensions, postemployment<br />
benefits, stock options, valuation of acquired intangible<br />
assets, useful lives for depreciation and amortization, future cash<br />
flows associated with impairment testing for goodwill, indefinite-lived<br />
intangible assets and long-lived assets, deferred tax assets, uncertain<br />
in<strong>com</strong>e tax positions and contingencies. Actual results may ultimately<br />
differ from estimates, although management does not generally<br />
believe such differences would materially affect the financial statements<br />
in any individual year. However, in regard to ongoing impairment<br />
testing of goodwill and indefinite-lived intangible assets, significant<br />
deterioration in future cash flow projections or other assumptions used<br />
in valuation models, versus those anticipated at the time of the initial<br />
valuations, could result in impairment charges that may materially<br />
affect the financial statements in a given year.<br />
Revenue Recognition<br />
Sales are recognized when revenue is realized or realizable and has<br />
been earned. Most revenue transactions represent sales of inventory.<br />
The revenue recorded is presented net of sales and other taxes we<br />
collect on behalf of governmental authorities and includes shipping<br />
and handling costs, which generally are included in the list price to the<br />
customer. Our policy is to recognize revenue when title to the product,<br />
ownership and risk of loss transfer to the customer, which can be on the<br />
date of shipment or the date of receipt by the customer. A provision<br />
for payment discounts and product return allowances is recorded as a<br />
reduction of sales in the same period that the revenue is recognized.<br />
Amounts in millions of dollars except per share amounts or as otherwise specified.<br />
Trade promotions, consisting primarily of customer pricing allowances,<br />
merchandising funds and consumer coupons, are offered through<br />
various programs to customers and consumers. Sales are recorded net of<br />
trade promotion spending, which is recognized as incurred, generally<br />
at the time of the sale. Most of these arrangements have terms of<br />
approximately one year. Accruals for expected payouts under these<br />
programs are included as accrued marketing and promotion in the<br />
accrued and other liabilities line item in the Consolidated Balance Sheets.<br />
Cost of Products Sold<br />
Cost of products sold is primarily <strong>com</strong>prised of direct materials and<br />
supplies consumed in the manufacture of product, as well as manufacturing<br />
labor, depreciation expense and direct overhead expense<br />
necessary to acquire and convert the purchased materials and supplies<br />
into finished product. Cost of products sold also includes the cost to<br />
distribute products to customers, inbound freight costs, internal transfer<br />
costs, warehousing costs and other shipping and handling activity.<br />
Selling, General and Administrative Expense<br />
Selling, general and administrative expense (SG&A) is primarily <strong>com</strong>prised<br />
of marketing expenses, selling expenses, research and development<br />
costs, administrative and other indirect overhead costs, depreciation<br />
and amortization expense on non-manufacturing assets and other<br />
miscellaneous operating items. Research and development costs are<br />
charged to expense as incurred and were $2,044 in <strong>2009</strong>, $2,212 in<br />
2008, and $2,100 in 2007. Advertising costs, charged to expense<br />
as incurred, include worldwide television, print, radio, internet and<br />
in-store advertising expenses and were $7,579 in <strong>2009</strong>, $8,583 in<br />
2008 and $7,850 in 2007. Non-advertising related <strong>com</strong>ponents of<br />
the Company’s total marketing spending include costs associated with<br />
consumer promotions, product sampling and sales aids, all of which<br />
are included in SG&A, as well as coupons and customer trade funds,<br />
which are recorded as reductions to net sales.<br />
Other Non-Operating In<strong>com</strong>e, Net<br />
Other non-operating in<strong>com</strong>e, net, primarily includes net divestiture<br />
gains and interest and investment in<strong>com</strong>e.<br />
Currency Translation<br />
Financial statements of operating subsidiaries outside the United<br />
States of America (U.S.) generally are measured using the local<br />
currency as the functional currency. Adjustments to translate those<br />
statements into U.S. dollars are recorded in other <strong>com</strong>prehensive<br />
in<strong>com</strong>e. Currency translation adjustments in accumulated other<br />
<strong>com</strong>prehensive in<strong>com</strong>e were gains of $3,333 and $9,484 at June 30,<br />
<strong>2009</strong> and 2008, respectively. For subsidiaries operating in highly<br />
inflationary economies, the U.S. dollar is the functional currency.<br />
Remeasurement adjustments for financial statements in highly<br />
inflationary economies and other transactional exchange gains and<br />
losses are reflected in earnings.
Notes to Consolidated Financial Statements The <strong>Procter</strong> & <strong>Gamble</strong> Company 55<br />
Cash Flow Presentation<br />
The Statements of Cash Flows are prepared using the indirect method,<br />
which reconciles net earnings to cash flow from operating activities.<br />
The reconciliation adjustments include the removal of timing differences<br />
between the occurrence of operating receipts and payments and their<br />
recognition in net earnings. The adjustments also remove cash flows<br />
arising from investing and financing activities, which are presented<br />
separately from operating activities. Cash flows from foreign currency<br />
transactions and operations are translated at an average exchange<br />
rate for the period. Cash flows from hedging activities are included<br />
in the same category as the items being hedged. Cash flows from<br />
derivative instruments designated as net investment hedges are<br />
classified as financing activities. Realized gains and losses from nonqualifying<br />
derivative instruments used to hedge currency exposures<br />
resulting from inter<strong>com</strong>pany financing transactions are also classified<br />
as financing activities. Cash flows from other derivative instruments<br />
used to manage interest, <strong>com</strong>modity or other currency exposures are<br />
classified as operating activities. Cash payments related to in<strong>com</strong>e<br />
taxes are classified as operating activities.<br />
Cash Equivalents<br />
Highly liquid investments with remaining stated maturities of three<br />
months or less when purchased are considered cash equivalents and<br />
recorded at cost.<br />
Investments<br />
Investment securities consist of readily marketable debt and equity<br />
securities. Unrealized gains or losses are charged to earnings for<br />
investments classified as trading. Unrealized gains or losses on securities<br />
classified as available-for-sale are generally recorded in shareholders’<br />
equity. If an available-for-sale security is other than temporarily<br />
impaired, the loss is charged to either earnings or shareholders’ equity<br />
depending on our intent and ability to retain the security until we<br />
recover the full cost basis and the extent of the loss attributable to<br />
the creditworthiness of the issuer. Investments in certain <strong>com</strong>panies<br />
over which we exert significant influence, but do not control the<br />
financial and operating decisions, are accounted for as equity method<br />
investments and are classified as other noncurrent assets. Other<br />
investments that are not controlled, and over which we do not have<br />
the ability to exercise significant influence, are accounted for under<br />
the cost method.<br />
Inventory Valuation<br />
Inventories are valued at the lower of cost or market value. Productrelated<br />
inventories are primarily maintained on the first-in, first-out<br />
method. Minor amounts of product inventories, including certain<br />
cosmetics and <strong>com</strong>modities, are maintained on the last-in, first-out<br />
method. The cost of spare part inventories is maintained using the<br />
average cost method.<br />
Property, Plant and Equipment<br />
Property, plant and equipment is recorded at cost reduced by<br />
accumulated depreciation. Depreciation expense is recognized over<br />
the assets’ estimated useful lives using the straight-line method.<br />
Machinery and equipment includes office furniture and fixtures<br />
(15-year life), <strong>com</strong>puter equipment and capitalized software (3- to<br />
5-year lives) and manufacturing equipment (3- to 20-year lives).<br />
Buildings are depreciated over an estimated useful life of 40 years.<br />
Estimated useful lives are periodically reviewed and, when appropriate,<br />
changes are made prospectively. When certain events or changes<br />
in operating conditions occur, asset lives may be adjusted and an<br />
impairment assessment may be performed on the recoverability of<br />
the carrying amounts.<br />
Goodwill and Other Intangible Assets<br />
Goodwill and indefinite-lived brands are not amortized, but are<br />
evaluated for impairment annually or when indicators of a potential<br />
impairment are present. Our impairment testing of goodwill is<br />
performed separately from our impairment testing of individual<br />
indefinite-lived intangibles. The annual evaluation for impairment of<br />
goodwill and indefinite-lived intangibles is based on valuation models<br />
that incorporate assumptions and internal projections of expected<br />
future cash flows and operating plans. We believe such assumptions<br />
are also <strong>com</strong>parable to those that would be used by other marketplace<br />
participants.<br />
We have a number of acquired brands that have been determined to<br />
have indefinite lives due to the nature of our business. We evaluate<br />
a number of factors to determine whether an indefinite life is appropriate,<br />
including the <strong>com</strong>petitive environment, market share, brand<br />
history, product life cycles, operating plans and the macroeconomic<br />
environment of the countries in which the brands are sold. When<br />
certain events or changes in operating conditions occur, an impairment<br />
assessment is performed and indefinite-lived brands may be adjusted<br />
to a determinable life.<br />
The cost of intangible assets with determinable useful lives is amortized<br />
to reflect the pattern of economic benefits consumed, either on a<br />
straight-line or accelerated basis over the estimated periods benefited.<br />
Patents, technology and other intangibles with contractual terms are<br />
generally amortized over their respective legal or contractual lives.<br />
Customer relationships and other non-contractual intangible assets<br />
with determinable lives are amortized over periods generally ranging<br />
from 5 to 40 years. When certain events or changes in operating<br />
conditions occur, an impairment assessment is performed and lives of<br />
intangible assets with determinable lives may be adjusted.<br />
Fair Values of Financial Instruments<br />
Certain financial instruments are required to be recorded at fair value.<br />
The estimated fair values of such financial instruments (including<br />
certain debt instruments, investment securities and derivatives) have<br />
been determined using market information and valuation methodologies,<br />
primarily discounted cash flow analysis. Changes in assumptions<br />
or estimation methods could affect the fair value estimates; however,<br />
we do not believe any such changes would have a material impact<br />
on our financial condition, results of operations or cash flows. Other<br />
financial instruments, including cash equivalents, other investments<br />
Amounts in millions of dollars except per share amounts or as otherwise specified.
56 The <strong>Procter</strong> & <strong>Gamble</strong> Company Notes to Consolidated Financial Statements<br />
and short-term debt, are recorded at cost, which approximates fair<br />
value. The fair values of long-term debt and derivative instruments<br />
are disclosed in Note 4 and Note 5, respectively.<br />
Subsequent Events<br />
For the fiscal year ended June 30, <strong>2009</strong>, the Company has evaluated<br />
subsequent events for potential recognition and disclosure through<br />
August 14, <strong>2009</strong>, the date of financial statement issuance.<br />
New Accounting Pronouncements and Policies<br />
Other than as described below, no new accounting pronouncement<br />
issued or effective during the fiscal year has had or is expected to<br />
have a material impact on the Consolidated Financial Statements.<br />
FAIR VALUE MEASUREMENTS<br />
On July 1, 2008, we adopted new accounting guidance on fair value<br />
measurements. The new guidance defines fair value, establishes a<br />
framework for measuring fair value under U.S. GAAP, and expands<br />
disclosures about fair value measurements. It was effective for the<br />
Company beginning July 1, 2008, for certain financial assets and<br />
liabilities. Refer to Note 5 for additional information regarding our<br />
fair value measurements for financial assets and liabilities. The new<br />
guidance is effective for non-financial assets and liabilities recognized<br />
or disclosed at fair value on a nonrecurring basis beginning July 1,<br />
<strong>2009</strong>. The Company believes that the adoption of the new guidance<br />
applicable to non-financial assets and liabilities will not have a material<br />
effect on its financial position, results of operations or cash flows.<br />
DISCLOSURES ABOUT DERIVATIVE INSTRUMENTS<br />
AND HEDGING ACTIVITIES<br />
On January 1, <strong>2009</strong>, we adopted new accounting guidance on<br />
disclosures about derivative instruments and hedging activities.<br />
The new guidance impacts disclosures only and requires additional<br />
qualitative and quantitative information on the use of derivatives and<br />
their impact on an entity’s financial position, results of operations<br />
and cash flows. Refer to Note 5 for additional information regarding<br />
our risk management activities, including derivative instruments and<br />
hedging activities.<br />
BUSINESS COMBINATIONS AND NONCONTROLLING INTERESTS IN<br />
CONSOLIDATED FINANCIAL STATEMENTS<br />
In December 2007, the Financial Accounting Standards Board issued<br />
new accounting guidance on business <strong>com</strong>binations and noncontrolling<br />
interests in consolidated financial statements. The new<br />
guidance revises the method of accounting for a number of aspects<br />
of business <strong>com</strong>binations and noncontrolling interests, including<br />
acquisition costs, contingencies (including contingent assets, contingent<br />
liabilities and contingent purchase price), the impacts of partial and<br />
step-acquisitions (including the valuation of net assets attributable<br />
to non-acquired minority interests) and post-acquisition exit activities<br />
of acquired businesses. The new guidance will be effective for the<br />
Company during our fiscal year beginning July 1, <strong>2009</strong>. The Company<br />
believes that the adoption of the new guidance will not have a material<br />
effect on its financial position, results of operations or cash flows.<br />
Amounts in millions of dollars except per share amounts or as otherwise specified.<br />
NOTE 2<br />
GOODWILL AND INTANGIBLE ASSETS<br />
The change in the net carrying amount of goodwill by Global<br />
Business Unit (GBU) was as follows:<br />
BEAUTY GBU<br />
<strong>2009</strong> 2008<br />
Beauty, beginning of year $16,903 $15,359<br />
Acquisitions and divestitures 98 187<br />
Translation and other (942) 1,357<br />
GOODWILL, JUNE 30 16,059 16,903<br />
Grooming, beginning of year 25,312 24,211<br />
Acquisitions and divestitures (246) (269)<br />
Translation and other (1,066) 1,370<br />
GOODWILL, JUNE 30 24,000 25,312<br />
HEALTH AND WELL-BEING GBU<br />
Health Care, beginning of year 8,750 8,482<br />
Acquisitions and divestitures (81) (59)<br />
Translation and other (265) 327<br />
GOODWILL, JUNE 30 8,404 8,750<br />
Snacks and Pet Care, beginning of year 2,434 2,407<br />
Acquisitions and divestitures (356) (5)<br />
Translation and other (23) 32<br />
GOODWILL, JUNE 30 2,055 2,434<br />
HOUSEHOLD CARE GBU<br />
Fabric Care and Home Care, beginning of year 4,655 4,470<br />
Acquisitions and divestitures (46) (43)<br />
Translation and other (201) 228<br />
GOODWILL, JUNE 30 4,408 4,655<br />
Baby Care and Family Care, beginning of year 1,713 1,623<br />
Acquisitions and divestitures (7) (34)<br />
Translation and other (120) 124<br />
GOODWILL, JUNE 30 1,586 1,713<br />
GOODWILL, NET, beginning of year 59,767 56,552<br />
Acquisitions and divestitures (638) (223)<br />
Translation and other (2,617) 3,438<br />
GOODWILL, JUNE 30 56,512 59,767<br />
The acquisition and divestiture impact during fiscal <strong>2009</strong> in Snacks<br />
and Pet Care is primarily due to the divestiture of the Coffee business.<br />
The remaining decrease in goodwill during fiscal <strong>2009</strong> is primarily due<br />
to currency translation across all GBUs.
Notes to Consolidated Financial Statements The <strong>Procter</strong> & <strong>Gamble</strong> Company 57<br />
Identifiable intangible assets were <strong>com</strong>prised of:<br />
June 30<br />
INTANGIBLE ASSETS WITH<br />
DETERMINABLE LIVES<br />
<strong>2009</strong> 2008<br />
Gross<br />
Carrying Accumulated<br />
Amount Amortization<br />
Gross<br />
Carrying Accumulated<br />
Amount Amortization<br />
Brands $ 3,580 $1,253 $ 3,564 $1,032<br />
Patents and technology 3,168 1,332 3,188 1,077<br />
Customer relationships 1,853 411 1,947 353<br />
Other 320 210 333 209<br />
TOTAL 8,921 3,206 9,032 2,671<br />
BRANDS WITH INDEFINITE<br />
LIVES 26,891 — 27,872 —<br />
TOTAL 35,812 3,206 36,904 2,671<br />
The amortization of intangible assets for the years ended June 30,<br />
<strong>2009</strong>, 2008 and 2007 was $648, $649 and $640, respectively.<br />
Estimated amortization expense over the next five years is as follows:<br />
2010 — $570; 2011 — $523; 2012 — $489; 2013 — $462; and<br />
2014 — $429. Such estimates do not reflect the impact of future<br />
foreign exchange rate changes.<br />
NOTE 3<br />
SUPPLEMENTAL FINANCIAL INFORMATION<br />
Selected <strong>com</strong>ponents of current and noncurrent liabilities were as<br />
follows:<br />
June 30 <strong>2009</strong> 2008<br />
ACCRUED AND OTHER LIABILITIES — CURRENT<br />
Marketing and promotion $2,378 $ 2,760<br />
Compensation expenses 1,464 1,527<br />
Accrued Gillette exit costs 111 257<br />
Taxes payable 722 945<br />
Other 3,926 5,610<br />
TOTAL 8,601 11,099<br />
OTHER NONCURRENT LIABILITIES<br />
Pension benefits $3,798 $ 3,146<br />
Other postretirement benefits 1,516 512<br />
Unrecognized tax benefits 2,705 3,075<br />
Other 1,410 1,421<br />
TOTAL 9,429 8,154<br />
Gillette Acquisition<br />
On October 1, 2005, we <strong>com</strong>pleted our acquisition of The Gillette<br />
Company (Gillette) for total consideration of $53.4 billion including<br />
<strong>com</strong>mon stock, the fair value of vested stock options and acquisition<br />
costs. In connection with this acquisition, we recognized an assumed<br />
liability for Gillette exit costs of $1.2 billion, including $854 in separation<br />
costs related to approximately 5,500 people, $55 in employee relocation<br />
costs and $320 in other exit costs. These costs are primarily related to<br />
the elimination of selling, general and administrative overlap between<br />
the two <strong>com</strong>panies in areas like Global Business Services, corporate<br />
staff and go-to-market support, as well as redundant manufacturing<br />
capacity. These activities are substantially <strong>com</strong>plete as of June 30, <strong>2009</strong>.<br />
Total integration plan charges against the assumed liability were<br />
$51, $286 and $438 for the years ended June <strong>2009</strong>, 2008 and 2007,<br />
respectively. A total of $106 and $121 of the liability was reversed<br />
during the years ended June <strong>2009</strong> and 2008, respectively, related to<br />
underspending on a number of projects that were concluded during the<br />
period, which resulted in a reduction of goodwill during those years.<br />
NOTE 4<br />
SHORT-TERM AND LONG-TERM DEBT<br />
June 30 <strong>2009</strong> 2008<br />
DEBT DUE WITHIN ONE YEAR<br />
Current portion of long-term debt $ 6,941 $ 1,746<br />
Commercial paper 5,027 9,748<br />
Floating rate notes 4,250 1,500<br />
Other 102 90<br />
TOTAL 16,320 13,084<br />
The weighted average short-term interest rates were 2.0% and 2.7%<br />
as of June 30, <strong>2009</strong> and 2008, respectively, including the effects of<br />
interest rate swaps discussed in Note 5.<br />
Amounts in millions of dollars except per share amounts or as otherwise specified.
58 The <strong>Procter</strong> & <strong>Gamble</strong> Company Notes to Consolidated Financial Statements<br />
June 30 <strong>2009</strong> 2008<br />
LONG-TERM DEBT<br />
Floating rate note due July <strong>2009</strong> $ 1,750 $ 1,750<br />
Floating rate note due August <strong>2009</strong> 1,500 1,500<br />
6.88% USD note due September <strong>2009</strong> 1,000 1,000<br />
Floating rate note due March 2010 750 —<br />
2% JPY note due June 2010 522 467<br />
4.88% EUR note due October 2011 1,411 1,573<br />
3.38% EUR note due December 2012 1,975 2,203<br />
4.60% USD note due January 2014 2,000 —<br />
4.50% EUR note due May 2014 2,116 2,360<br />
4.95% USD note due August 2014 900 900<br />
3.50% USD note due February 2015 750 —<br />
4.85% USD note due December 2015 700 700<br />
5.13% EUR note due October 2017 1,552 1,731<br />
4.70% USD note due February 2019 1,250 —<br />
4.13% EUR note due December 2020 846 944<br />
9.36% ESOP debentures due <strong>2009</strong>–2021 (1) 896 934<br />
4.88% EUR note due May 2027 1,411 1,573<br />
6.25% GBP note due January 2030 832 993<br />
5.50% USD note due February 2034 500 500<br />
5.80% USD note due August 2034 600 600<br />
5.55% USD note due March 2037 1,400 1,400<br />
Capital lease obligations 392 407<br />
All other long-term debt 2,540 3,792<br />
Current portion of long-term debt (6,941) (1,746)<br />
TOTAL 20,652 23,581<br />
(1) Debt issued by the ESOP is guaranteed by the Company and must be recorded as debt of the<br />
Company as discussed in Note 8.<br />
Long-term weighted average interest rates were 4.9% and 4.5% as<br />
of June 30, <strong>2009</strong> and 2008, respectively, including the effects of<br />
interest rate swaps and net investment hedges discussed in Note 5.<br />
The fair value of the long-term debt was $21,514 and $23,276 at<br />
June 30, <strong>2009</strong> and 2008, respectively. Long-term debt maturities<br />
during the next five years are as follows: 2010 —$6,941; 2011 —$47;<br />
2012 —$1,474; 2013 —$2,013; and 2014 —$4,154.<br />
The <strong>Procter</strong> & <strong>Gamble</strong> Company fully and unconditionally guarantees<br />
the registered debt and securities issued by its 100% owned finance<br />
subsidiaries.<br />
Amounts in millions of dollars except per share amounts or as otherwise specified.<br />
NOTE 5<br />
RISK MANAGEMENT ACTIVITIES<br />
AND FAIR VALUE MEASUREMENTS<br />
As a multinational <strong>com</strong>pany with diverse product offerings, we are<br />
exposed to market risks, such as changes in interest rates, currency<br />
exchange rates and <strong>com</strong>modity prices. We evaluate exposures on a<br />
centralized basis to take advantage of natural exposure netting and<br />
correlation. To the extent we choose to manage volatility associated<br />
with the net exposures, we enter into various financial transactions<br />
which we account for using the applicable accounting guidance for<br />
derivative instruments and hedging activities. These financial transactions<br />
are governed by our policies covering acceptable counterparty<br />
exposure, instrument types and other hedging practices.<br />
At inception, we formally designate and document qualifying instruments<br />
as hedges of underlying exposures. We formally assess, both<br />
at inception and at least quarterly, whether the financial instruments<br />
used in hedging transactions are effective at offsetting changes in<br />
either the fair value or cash flows of the related underlying exposure.<br />
Fluctuations in the value of these instruments generally are offset by<br />
changes in the fair value or cash flows of the underlying exposures<br />
being hedged. This offset is driven by the high degree of effectiveness<br />
between the exposure being hedged and the hedging instrument.<br />
The ineffective portion of a change in the fair value of a qualifying<br />
instrument is immediately recognized in earnings. The amount of<br />
ineffectiveness recognized is immaterial for all periods presented.<br />
Credit Risk Management<br />
We have counterparty credit guidelines and generally enter into<br />
transactions with investment grade financial institutions. Counterparty<br />
exposures are monitored daily and downgrades in credit rating are<br />
reviewed on a timely basis. Credit risk arising from the inability of a<br />
counterparty to meet the terms of our financial instrument contracts<br />
generally is limited to the amounts, if any, by which the counterparty’s<br />
obligations to us exceed our obligations to the counterparty.<br />
We have not incurred and do not expect to incur material credit losses<br />
on our risk management or other financial instruments.<br />
Certain of the Company’s financial instruments used in hedging<br />
transactions are governed by industry standard netting agreements<br />
with counterparties. If the Company’s credit rating were to fall below<br />
the levels stipulated in the agreements, the counterparties could<br />
demand either collateralization or termination of the arrangement.<br />
The aggregate fair value of the instruments covered by these contractual<br />
features that are in a net liability position as of June 30, <strong>2009</strong><br />
was $288 million. The Company has never been required to post any<br />
collateral as a result of these contractual features.
Notes to Consolidated Financial Statements The <strong>Procter</strong> & <strong>Gamble</strong> Company 59<br />
Interest Rate Risk Management<br />
Our policy is to manage interest cost using a mixture of fixed-rate<br />
and variable-rate debt. To manage this risk in a cost-efficient manner,<br />
we enter into interest rate swaps in which we agree to exchange with<br />
the counterparty, at specified intervals, the difference between fixed<br />
and variable interest amounts calculated by reference to an agreedupon<br />
notional amount.<br />
Interest rate swaps that meet specific accounting criteria are<br />
accounted for as fair value and cash flow hedges. There were no fair<br />
value hedging instruments at June 30, <strong>2009</strong> or June 30, 2008. For<br />
cash flow hedges, the effective portion of the changes in fair value of<br />
the hedging instrument is reported in other <strong>com</strong>prehensive in<strong>com</strong>e<br />
(OCI) and reclassified into interest expense over the life of the underlying<br />
debt. The ineffective portion, which is not material for any year<br />
presented, is immediately recognized in earnings.<br />
Foreign Currency Risk Management<br />
We manufacture and sell our products in a number of countries<br />
throughout the world and, as a result, are exposed to movements in<br />
foreign currency exchange rates. The purpose of our foreign currency<br />
hedging program is to manage the volatility associated with shortterm<br />
changes in exchange rates.<br />
To manage this exchange rate risk, we have historically utilized a<br />
<strong>com</strong>bination of forward contracts, options and currency swaps. As<br />
of June 30, <strong>2009</strong>, we had currency swaps with maturities up to five<br />
years, which are intended to offset the effect of exchange rate<br />
fluctuations on inter<strong>com</strong>pany loans denominated in foreign currencies<br />
and are therefore accounted for as cash flow hedges. The Company<br />
has also utilized forward contracts and options to offset the effect of<br />
exchange rate fluctuations on forecasted sales, inventory purchases<br />
and inter<strong>com</strong>pany royalties denominated in foreign currencies. The<br />
effective portion of the changes in fair value of these instruments is<br />
reported in OCI and reclassified into earnings in the same financial<br />
statement line item and in the same period or periods during which<br />
the related hedged transactions affect earnings. The ineffective<br />
portion, which is not material for any year presented, is immediately<br />
recognized in earnings.<br />
The change in value of certain non-qualifying instruments used to<br />
manage foreign exchange exposure of inter<strong>com</strong>pany financing<br />
transactions, in<strong>com</strong>e from international operations and other balance<br />
sheet items subject to revaluation is immediately recognized in<br />
earnings, substantially offsetting the foreign currency mark-to-market<br />
impact of the related exposure. The net earnings impact of such<br />
instruments was a $1,047 loss in <strong>2009</strong> and gains of $1,397 and $56<br />
in 2008 and 2007, respectively.<br />
Net Investment Hedging<br />
We hedge certain net investment positions in major foreign subsidiaries.<br />
To ac<strong>com</strong>plish this, we either borrow directly in foreign currencies<br />
and designate all or a portion of foreign currency debt as a hedge of<br />
the applicable net investment position or enter into foreign currency<br />
swaps that are designated as hedges of our related foreign net<br />
investments. Changes in the fair value of these instruments are immediately<br />
recognized in OCI to offset the change in the value of the net<br />
investment being hedged. Currency effects of these hedges reflected<br />
in OCI were an after-tax gain of $964 in <strong>2009</strong> and $2,951 loss in 2008.<br />
Accumulated net balances were a $4,059 and a $5,023 after-tax loss<br />
as of June 30, <strong>2009</strong> and 2008, respectively.<br />
Commodity Risk Management<br />
Certain raw materials used in our products or production processes<br />
are subject to price volatility caused by weather, supply conditions,<br />
political and economic variables and other unpredictable factors.<br />
To manage the volatility related to anticipated purchases of certain of<br />
these materials, we use futures and options with maturities generally<br />
less than one year and swap contracts with maturities up to five years.<br />
These market instruments generally are designated as cash flow<br />
hedges. The effective portion of the changes in fair value for these<br />
instruments is reported in OCI and reclassified into earnings in the<br />
same financial statement line item and in the same period or periods<br />
during which the hedged transactions affect earnings. The ineffective<br />
and non-qualifying portions, which are not material for any year<br />
presented, are immediately recognized in earnings.<br />
Insurance<br />
We self insure for most insurable risks. In addition, we purchase insurance<br />
for Directors and Officers Liability and certain other coverage in<br />
situations where it is required by law, by contract, or deemed to be in<br />
the interest of the Company.<br />
Fair Value Hierarchy<br />
New accounting guidance on fair value measurements for certain<br />
financial assets and liabilities requires that assets and liabilities carried<br />
at fair value be classified and disclosed in one of the following three<br />
categories:<br />
Level 1: Quoted market prices in active markets for identical assets<br />
or liabilities.<br />
Level 2: Observable market-based inputs or unobservable inputs<br />
that are corroborated by market data.<br />
Level 3: Unobservable inputs reflecting the reporting entity’s own<br />
assumptions or external inputs from inactive markets.<br />
In valuing assets and liabilities, we are required to maximize the use<br />
of quoted market prices and minimize the use of unobservable inputs.<br />
We calculate the fair value of our Level 1 and Level 2 instruments<br />
based on the exchange traded price of similar or identical instruments<br />
where available or based on other observable instruments. The fair<br />
value of our Level 3 instruments is calculated as the net present value<br />
of expected cash flows based on externally provided inputs. These<br />
calculations take into consideration the credit risk of both the Company<br />
and our counterparties. The Company has not changed its valuation<br />
techniques in measuring the fair value of any financial assets and<br />
liabilities during the period.<br />
Amounts in millions of dollars except per share amounts or as otherwise specified.
60 The <strong>Procter</strong> & <strong>Gamble</strong> Company Notes to Consolidated Financial Statements<br />
The following table sets forth the Company’s financial assets and liabilities as of June 30, <strong>2009</strong> that are measured at fair value on a recurring<br />
basis during the period, segregated by level within the fair value hierarchy:<br />
At June 30 Level 1 Level 2 Level 3 <strong>2009</strong> 2008<br />
Assets at fair value:<br />
Investment securities $ — $174 $38 $212 $ 282<br />
Derivatives relating to:<br />
Foreign currency hedges — — — — 4<br />
Other foreign currency instruments (1) — 300 — 300 190<br />
Net investment hedges — 83 — 83 26<br />
Commodities 3 25 — 28 229<br />
Total assets at fair value (2) 3 582 38 623 731<br />
Liabilities at fair value:<br />
Derivatives relating to:<br />
Foreign currency hedges — 103 — 103 37<br />
Other foreign currency instruments (1) — 39 — 39 33<br />
Net investment hedges — 85 — 85 1,210<br />
Interest rate — 13 — 13 17<br />
Commodities 2 96 3 101 —<br />
Total liabilities at fair value (3) 2 336 3 341 1,297<br />
(1) The other foreign currency instruments are <strong>com</strong>prised of non-qualifying foreign currency financial instruments.<br />
(2) All derivative assets are presented in prepaid expenses and other current assets or other noncurrent assets with the exception of investment securities which are only presented in other<br />
noncurrent assets.<br />
(3) All liabilities are presented in accrued and other liabilities or other noncurrent liabilities.<br />
The table below sets forth a reconciliation of the Company’s beginning<br />
and ending Level 3 financial assets and liabilities balances for the year<br />
ended June 30, <strong>2009</strong>.<br />
Derivatives<br />
Amounts in millions of dollars except per share amounts or as otherwise specified.<br />
Investment<br />
Securities<br />
BEGINNING OF YEAR<br />
Total gains or (losses) (realized/unrealized)<br />
$ 17 $ 46<br />
included in earnings (or changes in net assets)<br />
Total gains or (losses) (realized/unrealized)<br />
— (2)<br />
included in OCI (27) (6)<br />
Net purchases, issuances and settlements 7 —<br />
Transfers in/(out) of Level 3 — —<br />
END OF YEAR (3) 38
Notes to Consolidated Financial Statements The <strong>Procter</strong> & <strong>Gamble</strong> Company 61<br />
Disclosures about Derivative Instruments<br />
The fair values and amounts of gains and losses on qualifying and non-qualifying financial instruments used in hedging transactions as of, and for<br />
the year ended, June 30, <strong>2009</strong> are as follows:<br />
Derivatives in Cash Flow<br />
Hedging Relationships<br />
Notional Amount<br />
(Ending Balance) Fair Value Asset (Liability)<br />
Amount of Gain or (Loss)<br />
Recognized in OCI on<br />
Derivative (Effective Portion)<br />
Amount of Gain or (Loss)<br />
Reclassified from<br />
Accumulated OCI<br />
into In<strong>com</strong>e<br />
(Effective Portion) (1)<br />
June 30 June 30 Twelve Months Ended June 30<br />
Interest rate contracts $4,000 $ (13) $ 18 $ (56)<br />
Foreign currency contracts 690 (103) 26 (66)<br />
Commodity contracts 503 (73) (62) (170)<br />
Total 5,193 (189) (18) (292)<br />
Derivatives in Net Investment<br />
Hedging Relationships<br />
Notional Amount<br />
(Ending Balance) Fair Value Asset (Liability)<br />
Amount of Gain or (Loss)<br />
Recognized in OCI on<br />
Derivative (Effective Portion)<br />
Amount of Gain or (Loss)<br />
Recognized in In<strong>com</strong>e on<br />
Derivative (Ineffective Portion<br />
and Amount Excluded from<br />
Effectiveness Testing) (1)<br />
June 30 June 30 Twelve Months Ended June 30<br />
Net investment hedges $2,271 $(2) $(2) $(5)<br />
Total 2,271 (2) (2) (5)<br />
Derivatives Not Designated as<br />
Hedging Instruments<br />
Notional Amount<br />
(Ending Balance) Fair Value Asset (Liability)<br />
Amount of Gain or (Loss)<br />
Recognized in In<strong>com</strong>e on<br />
Derivative (1)<br />
June 30 Twelve Months Ended June 30<br />
Foreign currency contracts $12,348 $261 $(1,047)<br />
Commodity contracts — — (5)<br />
Total 12,348 261 (1,052)<br />
(1) The gain or loss reclassified from accumulated OCI into in<strong>com</strong>e is included in the consolidated statement of earnings as follows: interest rate contracts<br />
in interest expense, foreign currency contracts in SG&A and interest expense, <strong>com</strong>modity contracts in cost of products sold and net investment hedges in<br />
interest expense.<br />
During the next 12 months, the amount of the June 30, <strong>2009</strong> OCI balance that will be reclassified to earnings is expected to be immaterial.<br />
In addition, the total notional amount of contracts outstanding at the end of the period is indicative of the level of the Company’s derivative<br />
activity during the period.<br />
Amounts in millions of dollars except per share amounts or as otherwise specified.
62 The <strong>Procter</strong> & <strong>Gamble</strong> Company Notes to Consolidated Financial Statements<br />
NOTE 6<br />
EARNINGS PER SHARE<br />
Net earnings less preferred dividends (net of related tax benefits) are<br />
divided by the weighted average number of <strong>com</strong>mon shares outstanding<br />
during the year to calculate basic net earnings per <strong>com</strong>mon<br />
share. Diluted net earnings per <strong>com</strong>mon share are calculated to give<br />
effect to stock options and other stock-based awards (see Note 7)<br />
and assume conversion of preferred stock (see Note 8).<br />
Net earnings and <strong>com</strong>mon shares used to calculate basic and diluted<br />
net earnings per share were as follows:<br />
Years ended June 30 <strong>2009</strong> 2008 2007<br />
NET EARNINGS FROM<br />
CONTINUING OPERATIONS<br />
Preferred dividends,<br />
$11,293 $11,798 $10,063<br />
net of tax benefit (192) (176) (161)<br />
NET EARNINGS FROM<br />
CONTINUING OPERATIONS<br />
AVAILABLE TO COMMON<br />
SHAREHOLDERS<br />
Preferred dividends,<br />
11,101 11,622 9,902<br />
net of tax benefit 192 176 161<br />
DILUTED NET EARNINGS FROM<br />
CONTINUING OPERATIONS<br />
Net earnings from discontinued<br />
11,293 11,798 10,063<br />
operations 2,143 277 277<br />
NET EARNINGS 13,436 12,075 10,340<br />
Shares in millions; Years ended June 30 <strong>2009</strong> 2008 2007<br />
Basic weighted average <strong>com</strong>mon<br />
shares outstanding 2,952.2 3,080.8 3,159.0<br />
Effect of dilutive securities<br />
Conversion of preferred<br />
shares (1) 139.2 144.2 149.6<br />
Exercise of stock options and<br />
other unvested equity<br />
awards (2) 62.7 91.8 90.0<br />
DILUTED WEIGHTED AVERAGE<br />
COMMON SHARES<br />
OUTSTANDING 3,154.1 3,316.8 3,398.6<br />
(1) Despite being included currently in diluted net earnings per <strong>com</strong>mon share, the actual<br />
conversion to <strong>com</strong>mon stock occurs pursuant to the repayment of the ESOPs’ obligations<br />
through 2035.<br />
(2) Approximately 92 million in <strong>2009</strong>, 40 million in 2008 and 41 million in 2007 of the<br />
Company’s outstanding stock options were not included in the diluted net earnings per<br />
share calculation because the options were out of the money or to do so would have been<br />
antidilutive (i.e., the total proceeds upon exercise would have exceeded the market value of<br />
the underlying <strong>com</strong>mon shares).<br />
Amounts in millions of dollars except per share amounts or as otherwise specified.<br />
NOTE 7<br />
STOCK-BASED COMPENSATION<br />
We have stock-based <strong>com</strong>pensation plans under which we annually<br />
grant stock option and restricted stock awards to key managers and<br />
directors. Exercise prices on options granted have been and continue<br />
to be set equal to the market price of the underlying shares on the<br />
date of the grant. The key manager stock option awards granted<br />
since September 2002 are vested after three years and have a 10-year<br />
life. The key manager stock option awards granted from July 1998<br />
through August 2002 vested after three years and have a 15-year life.<br />
Key managers can elect to receive up to 50% of the value of their<br />
option award in restricted stock units (RSUs). Key manager RSUs are<br />
vested and settled in shares of <strong>com</strong>mon stock five years from the<br />
grant date. The awards provided to the Company’s directors are in the<br />
form of restricted stock and RSUs. In addition to our key manager and<br />
director grants, we make other minor stock option and RSU grants to<br />
employees for which the terms are not substantially different.<br />
A total of 229 million shares of <strong>com</strong>mon stock were authorized for<br />
issuance under stock-based <strong>com</strong>pensation plans approved by shareholders<br />
in 2001 and 2003, of which 12 million remain available for<br />
grant. An additional 20 million shares of <strong>com</strong>mon stock available for<br />
issuance under a plan approved by Gillette shareholders in 2004<br />
were assumed by the Company in conjunction with the acquisition<br />
of Gillette. A total of 10 million of these shares remain available for<br />
grant under this plan.<br />
Total stock-based <strong>com</strong>pensation expense for stock option grants was<br />
$460, $522 and $612 for <strong>2009</strong>, 2008 and 2007, respectively. The<br />
total in<strong>com</strong>e tax benefit recognized in the in<strong>com</strong>e statement for these<br />
stock-based <strong>com</strong>pensation arrangements was $126, $141 and $163<br />
for <strong>2009</strong>, 2008 and 2007, respectively. Total <strong>com</strong>pensation cost for<br />
restricted stock, RSUs and other stock-based grants, was $56, $33 and<br />
$56 in <strong>2009</strong>, 2008 and 2007, respectively.<br />
In calculating the <strong>com</strong>pensation expense for stock options granted,<br />
we utilize a binomial lattice-based valuation model. Assumptions<br />
utilized in the model, which are evaluated and revised, as necessary,<br />
to reflect market conditions and experience, were as follows:<br />
Years ended June 30 <strong>2009</strong> 2008 2007<br />
Interest rate 0.7–3.8% 1.3–3.8% 4.3–4.8%<br />
Weighted average<br />
interest rate 3.6% 3.4% 4.5%<br />
Dividend yield 2.0% 1.9% 1.9%<br />
Expected volatility 18–34% 19–25% 16–20%<br />
Weighted average<br />
volatility 21% 20% 19%<br />
Expected life in years 8.7 8.3 8.7
Notes to Consolidated Financial Statements The <strong>Procter</strong> & <strong>Gamble</strong> Company 63<br />
Because lattice-based option valuation models incorporate ranges of<br />
assumptions for inputs, those ranges are disclosed in the preceding<br />
table. Expected volatilities are based on a <strong>com</strong>bination of historical<br />
volatility of our stock and implied volatilities of call options on our<br />
stock. We use historical data to estimate option exercise and employee<br />
termination patterns within the valuation model. The expected life of<br />
options granted is derived from the output of the option valuation<br />
model and represents the average period of time that options granted<br />
are expected to be outstanding. The interest rate for periods within<br />
the contractual life of the options is based on the U.S. Treasury yield<br />
curve in effect at the time of grant.<br />
A summary of options outstanding under the plans as of June 30,<br />
<strong>2009</strong>, and activity during the year then ended is presented below:<br />
Options in thousands Options<br />
Weighted Avg.<br />
Exercise Price<br />
Outstanding,<br />
beginning of year 337,177 $48.25<br />
Granted 37,623 50.30<br />
Exercised (16,199) 39.45<br />
Canceled (1,284) 57.62<br />
Weighted Avg.<br />
Remaining<br />
Contractual<br />
Life in Years<br />
Aggregate<br />
Intrinsic Value<br />
(in millions)<br />
OUTSTANDING,<br />
END OF YEAR 357,317 48.83 6.3 $2,084<br />
EXERCISABLE 259,362 44.93 5.4 1,984<br />
The weighted average grant-date fair value of options granted was<br />
$11.67, $15.91 and $17.29 per share in <strong>2009</strong>, 2008 and 2007,<br />
respectively. The total intrinsic value of options exercised was $434,<br />
$1,129 and $894 in <strong>2009</strong>, 2008 and 2007, respectively. The total<br />
grant-date fair value of options that vested during <strong>2009</strong>, 2008 and<br />
2007 was $537, $532 and $552, respectively. We have no specific<br />
policy to repurchase <strong>com</strong>mon shares to mitigate the dilutive impact of<br />
options; however, we have historically made adequate discretionary<br />
purchases, based on cash availability, market trends and other factors,<br />
to satisfy stock option exercise activity.<br />
At June 30, <strong>2009</strong>, there was $524 of <strong>com</strong>pensation cost that has not<br />
yet been recognized related to stock awards. That cost is expected to<br />
be recognized over a remaining weighted average period of 2.0 years.<br />
Cash received from options exercised was $639, $1,837 and $1,422<br />
in <strong>2009</strong>, 2008 and 2007, respectively. The actual tax benefit realized<br />
for the tax deductions from option exercises totaled $146, $318 and<br />
$265 in <strong>2009</strong>, 2008 and 2007, respectively.<br />
NOTE 8<br />
POSTRETIREMENT BENEFITS AND<br />
EMPLOYEE STOCK OWNERSHIP PLAN<br />
We offer various postretirement benefits to our employees.<br />
Defined Contribution Retirement Plans<br />
We have defined contribution plans which cover the majority of our<br />
U.S. employees, as well as employees in certain other countries.<br />
These plans are fully funded. We generally make contributions to<br />
participants’ accounts based on individual base salaries and years of<br />
service. Total global defined contribution expense was $364, $290,<br />
and $273 in <strong>2009</strong>, 2008 and 2007, respectively.<br />
The primary U.S. defined contribution plan (the U.S. DC plan) <strong>com</strong>prises<br />
the majority of the balances and expense for the Company’s defined<br />
contribution plans. For the U.S. DC plan, the contribution rate is set<br />
annually. Total contributions for this plan approximated 15% of total<br />
participants’ annual wages and salaries in <strong>2009</strong>, 2008 and 2007.<br />
We maintain The <strong>Procter</strong> & <strong>Gamble</strong> Profit Sharing Trust (Trust) and<br />
Employee Stock Ownership Plan (ESOP) to provide a portion of the<br />
funding for the U.S. DC plan, as well as other retiree benefits.<br />
Operating details of the ESOP are provided at the end of this Note.<br />
The fair value of the ESOP Series A shares allocated to participants<br />
reduces our cash contribution required to fund the U.S. DC plan.<br />
Defined Benefit Retirement Plans and Other Retiree Benefits<br />
We offer defined benefit retirement pension plans to certain employees.<br />
These benefits relate primarily to local plans outside the U.S. and, to<br />
a lesser extent, plans assumed in the Gillette acquisition covering U.S.<br />
employees.<br />
We also provide certain other retiree benefits, primarily health care<br />
and life insurance, for the majority of our U.S. employees who be<strong>com</strong>e<br />
eligible for these benefits when they meet minimum age and service<br />
requirements. Generally, the health care plans require cost sharing<br />
with retirees and pay a stated percentage of expenses, reduced by<br />
deductibles and other coverages. These benefits are primarily funded<br />
by ESOP Series B shares, as well as certain other assets contributed<br />
by the Company.<br />
Amounts in millions of dollars except per share amounts or as otherwise specified.
64 The <strong>Procter</strong> & <strong>Gamble</strong> Company Notes to Consolidated Financial Statements<br />
Obligation and Funded Status. We use a June 30 measurement date<br />
for our defined benefit retirement plans and other retiree benefit<br />
plans. The following provides a reconciliation of benefit obligations,<br />
plan assets and funded status of these plans:<br />
Pension Benefits (1) Other Retiree Benefits (2)<br />
Years ended June 30 <strong>2009</strong> 2008 <strong>2009</strong> 2008<br />
CHANGE IN BENEFIT<br />
OBLIGATION<br />
Benefit obligation at<br />
beginning of year (3) $10,095 $ 9,819 $ 3,553 $ 3,558<br />
Service cost 214 263 91 95<br />
Interest cost 551 539 243 226<br />
Participants’ contributions 15 14 55 58<br />
Amendments 47 52 — (11)<br />
Actuarial (gain) loss 456 (655) 186 (232)<br />
Acquisitions (divestitures) (3) (7) (17) 2<br />
Curtailments and<br />
settlements 3 (68) — (3)<br />
Special termination benefits 3 1 16 2<br />
Currency translation<br />
and other (867) 642 27 67<br />
Benefit payments (498) (505) (226) (209)<br />
BENEFIT OBLIGATION<br />
AT END OF YEAR (3) 10,016 10,095 3,928 3,553<br />
CHANGE IN PLAN ASSETS<br />
Fair value of plan assets at<br />
beginning of year 7,225 7,350 3,225 3,390<br />
Actual return on plan assets (401) (459) (678) (29)<br />
Acquisitions (divestitures) — — — —<br />
Employer contributions 657 507 18 21<br />
Participants’ contributions 15 14 55 58<br />
Currency translation<br />
and other (688) 318 (4) 1<br />
ESOP debt impacts (4) — — 4 (7)<br />
Benefit payments (498) (505) (226) (209)<br />
FAIR VALUE OF PLAN<br />
ASSETS AT END OF YEAR 6,310 7,225 2,394 3,225<br />
FUNDED STATUS (3,706) (2,870) (1,534) (328)<br />
(1) Primarily non-U.S.-based defined benefit retirement plans.<br />
(2) Primarily U.S.-based other postretirement benefit plans.<br />
(3) For the pension benefit plans, the benefit obligation is the projected benefit obligation.<br />
For other retiree benefit plans, the benefit obligation is the accumulated postretirement<br />
benefit obligation.<br />
(4) Represents the net impact of ESOP debt service requirements, which is netted against plan<br />
assets for Other Retiree Benefits.<br />
Amounts in millions of dollars except per share amounts or as otherwise specified.<br />
Pension Benefits Other Retiree Benefits<br />
Years ended June 30 <strong>2009</strong> 2008 <strong>2009</strong> 2008<br />
CLASSIFICATION OF NET<br />
AMOUNT RECOGNIZED<br />
Noncurrent assets $ 133 $ 321 $ — $ 200<br />
Current liability (41) (45) (18) (16)<br />
Noncurrent liability (3,798) (3,146) (1,516) (512)<br />
NET AMOUNT RECOGNIZED (3,706) (2,870) (1,534) (328)<br />
AMOUNTS RECOGNIZED IN<br />
ACCUMULATED OTHER<br />
COMPREHENSIVE INCOME<br />
(AOCI)<br />
Net actuarial loss 1,976 715 1,860 578<br />
Prior service cost (credit) 227 213 (152) (175)<br />
NET AMOUNTS RECOGNIZED<br />
IN AOCI 2,203 928 1,708 403<br />
CHANGE IN PLAN ASSETS<br />
AND BENEFIT OBLIGA-<br />
TIONS RECOGNIZED IN<br />
ACCUMULATED OTHER<br />
COMPREHENSIVE INCOME<br />
(AOCI)<br />
Net actuarial loss —<br />
current year 1,335 361 1,309 226<br />
Prior service cost (credit) —<br />
current year 47 52 — (11)<br />
Amortization of net actuarial<br />
loss (29) (9) (2) (7)<br />
Amortization of prior service<br />
(cost) credit (14) (14) 23 21<br />
Settlement/Curtailment cost — (32) — (2)<br />
Currency translation<br />
and other (64) 19 (25) 24<br />
TOTAL CHANGE IN AOCI 1,275 377 1,305 251<br />
NET AMOUNTS RECOGNIZED<br />
IN PERIODIC BENEFIT COST<br />
AND AOCI 1,616 609 1,088 33<br />
The underfunding of pension benefits is primarily a function of<br />
the different funding incentives that exist outside of the U.S. In<br />
certain countries, there are no legal requirements or financial<br />
incentives provided to <strong>com</strong>panies to pre-fund pension obligations.<br />
In these instances, benefit payments are typically paid directly from<br />
the Company’s cash as they be<strong>com</strong>e due.
Notes to Consolidated Financial Statements The <strong>Procter</strong> & <strong>Gamble</strong> Company 65<br />
The accumulated benefit obligation for all defined benefit retirement<br />
pension plans was $8,637 and $8,750 at June 30, <strong>2009</strong> and June 30,<br />
2008, respectively. Pension plans with accumulated benefit obligations<br />
in excess of plan assets and plans with projected benefit obligations in<br />
excess of plan assets consist of the following:<br />
Accumulated Benefit<br />
Obligation Exceeds the<br />
Fair Value of Plan Assets<br />
Projected Benefit<br />
Obligation Exceeds the<br />
Fair Value of Plan Assets<br />
Years ended June 30 <strong>2009</strong> 2008 <strong>2009</strong> 2008<br />
Projected benefit obligation $6,509 $5,277 $9,033 $7,987<br />
Accumulated benefit<br />
obligation 5,808 4,658 7,703 6,737<br />
Fair value of plan assets 3,135 2,153 5,194 4,792<br />
Net Periodic Benefit Cost. Components of the net periodic benefit<br />
cost were as follows:<br />
Pension Benefits Other Retiree Benefits<br />
Years ended June 30 <strong>2009</strong> 2008 2007 <strong>2009</strong> 2008 2007<br />
Service cost $ 214 $ 263 $ 279 $ 91 $ 95 $ 85<br />
Interest cost 551 539 476 243 226 206<br />
Expected return on<br />
plan assets (473) (557) (454) (444) (429) (407)<br />
Prior service<br />
cost (credit)<br />
amortization 14 14 13 (23) (21) (22)<br />
Net actuarial loss<br />
amortization 29 9 45 2 7 2<br />
Curtailment and<br />
settlement gain 6 (36) (176) — (1) (1)<br />
GROSS BENEFIT<br />
COST (CREDIT)<br />
Dividends on ESOP<br />
341 232 183 (131) (123) (137)<br />
preferred stock — — — (86) (95) (85)<br />
NET PERIODIC<br />
BENEFIT COST<br />
(CREDIT) 341 232 183 (217) (218) (222)<br />
Pursuant to plan revisions adopted during 2007, Gillette’s U.S. defined<br />
benefit retirement pension plans were frozen effective January 1, 2008,<br />
at which time Gillette employees in the U.S. moved into the Trust and<br />
ESOP. This revision resulted in a $154 curtailment gain for the year<br />
ended June 30, 2007.<br />
Amounts expected to be amortized from accumulated other <strong>com</strong>prehensive<br />
in<strong>com</strong>e into net period benefit cost during the year ending<br />
June 30, 2010, are as follows:<br />
Pension<br />
Benefits<br />
Other Retiree<br />
Benefits<br />
Net actuarial loss $92 $ 19<br />
Prior service cost (credit) 15 (21)<br />
Assumptions. We determine our actuarial assumptions on an annual<br />
basis. These assumptions are weighted to reflect each country that<br />
may have an impact on the cost of providing retirement benefits.<br />
The weighted average assumptions for the defined benefit and other<br />
retiree benefit calculations, as well as assumed health care trend<br />
rates, were as follows:<br />
Pension Benefits Other Retiree Benefits<br />
Years ended June 30 <strong>2009</strong> 2008 <strong>2009</strong> 2008<br />
ASSUMPTIONS USED TO<br />
DETERMINE BENEFIT<br />
OBLIGATIONS (1)<br />
Discount rate 6.0% 6.3% 6.4% 6.9%<br />
Rate of <strong>com</strong>pensation increase 3.7% 3.7% — —<br />
ASSUMPTIONS USED TO<br />
DETERMINE NET PERIODIC<br />
BENEFIT COST (2)<br />
Discount rate 6.3% 5.5% 6.9% 6.3%<br />
Expected return on plan assets 7.4% 7.4% 9.3% 9.3%<br />
Rate of <strong>com</strong>pensation increase 3.7% 3.1% — —<br />
ASSUMED HEALTH CARE COST<br />
TREND RATES<br />
Health care cost trend rates<br />
assumed for next year — — 8.5% 8.6%<br />
Rate to which the health care<br />
cost trend rate is assumed to<br />
decline (ultimate trend rate) — — 5.0% 5.1%<br />
Year that the rate reaches the<br />
ultimate trend rate — — 2016 2015<br />
(1) Determined as of end of year.<br />
(2) Determined as of beginning of year and adjusted for acquisitions.<br />
Several factors are considered in developing the estimate for the longterm<br />
expected rate of return on plan assets. For the defined benefit<br />
retirement plans, these include historical rates of return of broad equity<br />
and bond indices and projected long-term rates of return obtained<br />
from pension investment consultants. The expected long-term rates<br />
of return for plan assets are 8%–9% for equities and 5%–6% for<br />
bonds. For other retiree benefit plans, the expected long-term rate of<br />
return reflects the fact that the assets are <strong>com</strong>prised primarily of<br />
Company stock. The expected rate of return on Company stock is based<br />
on the long-term projected return of 9.5% and reflects the historical<br />
pattern of favorable returns.<br />
Assumed health care cost trend rates could have a significant effect<br />
on the amounts reported for the other retiree benefit plans. A onepercentage<br />
point change in assumed health care cost trend rates<br />
would have the following effects:<br />
One-Percentage<br />
Point Increase<br />
One-Percentage<br />
Point Decrease<br />
Effect on total of service and interest cost<br />
<strong>com</strong>ponents $ 58 $ (46)<br />
Effect on postretirement benefit obligation 549 (447)<br />
Amounts in millions of dollars except per share amounts or as otherwise specified.
66 The <strong>Procter</strong> & <strong>Gamble</strong> Company Notes to Consolidated Financial Statements<br />
Plan Assets. Our target asset allocation for the year ended June 30,<br />
<strong>2009</strong>, and actual asset allocation by asset category as of June 30, <strong>2009</strong><br />
and 2008, were as follows:<br />
Asset Category<br />
Amounts in millions of dollars except per share amounts or as otherwise specified.<br />
Target Asset Allocation<br />
Pension<br />
Benefits<br />
Other<br />
Retiree<br />
Benefits<br />
Equity securities (1) 45% 93%<br />
Debt securities 55% 7%<br />
TOTAL 100% 100%<br />
Asset Allocation at June 30<br />
Pension Benefits Other Retiree Benefits<br />
Asset Category <strong>2009</strong> 2008 <strong>2009</strong> 2008<br />
Equity securities (1) 42% 45% 93% 96%<br />
Debt securities 51% 50% 7% 4%<br />
Cash 6% 3% — —<br />
Real estate 1% 2% — —<br />
TOTAL 100% 100% 100% 100%<br />
(1) Equity securities for other retiree plan assets include Company stock, net of Series B ESOP<br />
debt, of $2,084 and $2,809 as of June 30, <strong>2009</strong> and 2008, respectively.<br />
Our investment objective for defined benefit retirement plan assets is<br />
to meet the plans’ benefit obligations, while minimizing the potential<br />
for future required Company plan contributions. The investment<br />
strategies focus on asset class diversification, liquidity to meet benefit<br />
payments and an appropriate balance of long-term investment return<br />
and risk. Target ranges for asset allocations are determined by matching<br />
the actuarial projections of the plans’ future liabilities and benefit<br />
payments with expected long-term rates of return on the assets,<br />
taking into account investment return volatility and correlations across<br />
asset classes. Plan assets are diversified across several investment<br />
managers and are generally invested in liquid funds that are selected<br />
to track broad market equity and bond indices. Investment risk is<br />
carefully controlled with plan assets rebalanced to target allocations<br />
on a periodic basis and continual monitoring of investment managers’<br />
performance relative to the investment guidelines established with<br />
each investment manager.<br />
Cash Flows. Management’s best estimate of cash requirements for<br />
the defined benefit retirement plans and other retiree benefit plans<br />
for the year ending June 30, 2010, is approximately $616 and $24,<br />
respectively. For the defined benefit retirement plans, this is <strong>com</strong>prised<br />
of $178 in expected benefit payments from the Company directly to<br />
participants of unfunded plans and $438 of expected contributions<br />
to funded plans. For other retiree benefit plans, this is <strong>com</strong>prised of<br />
expected contributions that will be used directly for benefit payments.<br />
Expected contributions are dependent on many variables, including<br />
the variability of the market value of the plan assets as <strong>com</strong>pared<br />
to the benefit obligation and other market or regulatory conditions.<br />
In addition, we take into consideration our business investment<br />
opportunities and resulting cash requirements. Accordingly, actual<br />
funding may differ significantly from current estimates.<br />
Total benefit payments expected to be paid to participants, which<br />
include payments funded from the Company’s assets, as discussed<br />
above, as well as payments from the plans, are as follows:<br />
Years ending June 30<br />
EXPECTED BENEFIT PAYMENTS<br />
Pension<br />
Benefits<br />
Other Retiree<br />
Benefits<br />
2010 $ 499 $ 184<br />
2011 496 201<br />
2012 507 217<br />
2013 525 232<br />
2014 552 247<br />
2015–2019 3,096 1,453<br />
Employee Stock Ownership Plan<br />
We maintain the ESOP to provide funding for certain employee<br />
benefits discussed in the preceding paragraphs.<br />
The ESOP borrowed $1.0 billion in 1989 and the proceeds were used<br />
to purchase Series A ESOP Convertible Class A Preferred Stock to fund<br />
a portion of the U.S. DC plan. Principal and interest requirements of<br />
the borrowing were paid by the Trust from dividends on the preferred<br />
shares and from advances provided by the Company. The original<br />
borrowing of $1.0 billion has been repaid in full, and advances from<br />
the Company of $178 remain outstanding at June 30, <strong>2009</strong>. Each<br />
share is convertible at the option of the holder into one share of the<br />
Company’s <strong>com</strong>mon stock. The dividend for the current year was equal<br />
to the <strong>com</strong>mon stock dividend of $1.64 per share. The liquidation<br />
value is $6.82 per share.<br />
In 1991, the ESOP borrowed an additional $1.0 billion. The proceeds<br />
were used to purchase Series B ESOP Convertible Class A Preferred<br />
Stock to fund a portion of retiree health care benefits. These shares,<br />
net of the ESOP’s debt, are considered plan assets of the Other Retiree<br />
Benefits plan discussed above. Debt service requirements are funded by<br />
preferred stock dividends, cash contributions and advances provided<br />
by the Company, of which $266 is outstanding at June 30, <strong>2009</strong>.<br />
Each share is convertible at the option of the holder into one share<br />
of the Company’s <strong>com</strong>mon stock. The dividend for the current year<br />
was equal to the <strong>com</strong>mon stock dividend of $1.64 per share. The<br />
liquidation value is $12.96 per share.<br />
Our ESOP accounting practices are consistent with current ESOP<br />
accounting guidance, including the permissible continuation of certain<br />
provisions from prior accounting guidance. ESOP debt, which is<br />
guaranteed by the Company, is recorded as debt (see Note 4) with an<br />
offset to the Reserve for ESOP Debt Retirement, which is presented<br />
within Shareholders’ Equity. Advances to the ESOP by the Company<br />
are recorded as an increase in the Reserve for ESOP Debt Retirement.<br />
Interest incurred on the ESOP debt is recorded as interest expense.<br />
Dividends on all preferred shares, net of related tax benefits, are<br />
charged to retained earnings.
Notes to Consolidated Financial Statements The <strong>Procter</strong> & <strong>Gamble</strong> Company 67<br />
The series A and B preferred shares of the ESOP are allocated to<br />
employees based on debt service requirements, net of advances<br />
made by the Company to the Trust. The number of preferred shares<br />
outstanding at June 30 was as follows:<br />
Shares in thousands <strong>2009</strong> 2008 2007<br />
Allocated 56,818 58,557 60,402<br />
Unallocated 16,651 18,665 20,807<br />
TOTAL SERIES A 73,469 77,222 81,209<br />
Allocated 20,991 21,134 21,105<br />
Unallocated 42,522 43,618 44,642<br />
TOTAL SERIES B 63,513 64,752 65,747<br />
For purposes of calculating diluted net earnings per <strong>com</strong>mon share,<br />
the preferred shares held by the ESOP are considered converted from<br />
inception.<br />
In connection with the Gillette acquisition, we assumed the Gillette<br />
ESOP, which was established to assist Gillette employees in financing<br />
retiree medical costs. These ESOP accounts are held by participants and<br />
must be used to reduce the Company’s other retiree benefit obligations.<br />
Such accounts reduced our obligation by $171 at June 30, <strong>2009</strong>.<br />
NOTE 9<br />
INCOME TAXES<br />
In<strong>com</strong>e taxes are recognized for the amount of taxes payable for the<br />
current year and for the impact of deferred tax liabilities and assets,<br />
which represent future tax consequences of events that have been<br />
recognized differently in the financial statements than for tax purposes.<br />
Deferred tax assets and liabilities are established using the enacted<br />
statutory tax rates and are adjusted for any changes in such rates in<br />
the period of change.<br />
Earnings from continuing operations before in<strong>com</strong>e taxes consisted<br />
of the following:<br />
Years ended June 30 <strong>2009</strong> 2008 2007<br />
United States $ 9,064 $ 8,696 $ 8,692<br />
International 6,261 6,936 5,572<br />
TOTAL 15,325 15,632 14,264<br />
The provision for in<strong>com</strong>e taxes on continuing operations consisted of<br />
the following:<br />
Years ended June 30 <strong>2009</strong> 2008 2007<br />
CURRENT TAX EXPENSE<br />
U.S. federal $1,867 $ 860 $2,511<br />
International 1,316 1,546 1,325<br />
U.S. state and local 253 214 112<br />
3,436 2,620 3,948<br />
DEFERRED TAX EXPENSE<br />
U.S. federal 577 1,267 231<br />
International and other 19 (53) 22<br />
596 1,214 253<br />
TOTAL TAX EXPENSE 4,032 3,834 4,201<br />
A reconciliation of the U.S. federal statutory in<strong>com</strong>e tax rate to our<br />
actual in<strong>com</strong>e tax rate on continuing operations is provided below:<br />
Years ended June 30 <strong>2009</strong> 2008 2007<br />
U.S. federal statutory in<strong>com</strong>e<br />
tax rate 35.0% 35.0% 35.0%<br />
Country mix impacts of foreign<br />
operations -6.9% -6.8% -4.5%<br />
In<strong>com</strong>e tax reserve adjustments -1.2% -3.2% -0.3%<br />
Other -0.6% -0.5% -0.7%<br />
EFFECTIVE INCOME TAX RATE 26.3% 24.5% 29.5%<br />
In<strong>com</strong>e tax reserve adjustments represent changes in our net liability<br />
for unrecognized tax benefits related to prior year tax positions.<br />
Tax benefits credited to shareholders’ equity totaled $556 and $1,823<br />
for the years ended June 30, <strong>2009</strong> and 2008, respectively. These<br />
primarily relate to the tax effects of net investment hedges, excess tax<br />
benefits from the exercise of stock options and the impacts of certain<br />
adjustments to pension and other retiree benefit obligations recorded<br />
in shareholders’ equity.<br />
We have undistributed earnings of foreign subsidiaries of approximately<br />
$25 billion at June 30, <strong>2009</strong>, for which deferred taxes have not<br />
been provided. Such earnings are considered indefinitely invested in<br />
the foreign subsidiaries. If such earnings were repatriated, additional<br />
tax expense may result, although the calculation of such additional<br />
taxes is not practicable.<br />
On July 1, 2007, we adopted new accounting guidance on the<br />
accounting for uncertainty in in<strong>com</strong>e taxes. The adoption of the new<br />
guidance resulted in a decrease to retained earnings as of July 1, 2007,<br />
of $232, which was reflected as a cumulative effect of a change in<br />
accounting principle, with a corresponding increase to the net liability<br />
for unrecognized tax benefits. The impact primarily reflects the accrual<br />
of additional statutory interest and penalties as required by the new<br />
accounting guidance, partially offset by adjustments to existing<br />
unrecognized tax benefits to <strong>com</strong>ply with measurement principles.<br />
The implementation of the new guidance also resulted in a reduction<br />
Amounts in millions of dollars except per share amounts or as otherwise specified.
68 The <strong>Procter</strong> & <strong>Gamble</strong> Company Notes to Consolidated Financial Statements<br />
in our net tax liabilities for uncertain tax positions related to prior<br />
acquisitions accounted for under purchase accounting, resulting in<br />
an $80 decrease to goodwill. Additionally, the Company historically<br />
classified unrecognized tax benefits in current taxes payable. As a<br />
result of the adoption of the new guidance, unrecognized tax benefits<br />
not expected to be paid in the next 12 months were reclassified to<br />
other noncurrent liabilities.<br />
A reconciliation of the beginning and ending liability for unrecognized<br />
tax benefits is as follows:<br />
Amounts in millions of dollars except per share amounts or as otherwise specified.<br />
<strong>2009</strong> 2008<br />
BEGINNING OF YEAR $2,582 $2,971<br />
Increases in tax positions for prior years 116 164<br />
Decreases in tax positions for prior years (485) (576)<br />
Increases in tax positions for current year 225 375<br />
Settlements with taxing authorities (172) (260)<br />
Lapse in statute of limitations (68) (200)<br />
Currency translation (195) 108<br />
END OF YEAR 2,003 2,582<br />
The Company is present in over 150 taxable jurisdictions, and at any<br />
point in time, has 50 – 60 audits underway at various stages of<br />
<strong>com</strong>pletion. We evaluate our tax positions and establish liabilities for<br />
uncertain tax positions that may be challenged by local authorities and<br />
may not be fully sustained, despite our belief that the underlying tax<br />
positions are fully supportable. Unrecognized tax benefits are reviewed<br />
on an ongoing basis and are adjusted in light of changing facts and<br />
circumstances, including progress of tax audits, developments in<br />
case law, and closing of statute of limitations. Such adjustments are<br />
reflected in the tax provision as appropriate. The Company has made a<br />
concerted effort to bring its audit inventory to a more current position.<br />
We have done this by working with tax authorities to conduct audits<br />
for several open years at once. We have tax years open ranging from<br />
1997 and forward. We are generally not able to reliably estimate the<br />
ultimate settlement amounts until the close of the audit. While we<br />
do not expect material changes, it is possible that the amount of<br />
unrecognized benefit with respect to our uncertain tax positions will<br />
significantly increase or decrease within the next 12 months related<br />
to the audits described above. At this time we are not able to make<br />
a reasonable estimate of the range of impact on the balance of<br />
unrecognized tax benefits or the impact on the effective tax rate<br />
related to these items.<br />
Included in the total liability for unrecognized tax benefit at June 30,<br />
<strong>2009</strong> is $1,381 that, if recognized, would impact the effective tax<br />
rate in future periods.<br />
We recognize accrued interest and penalties related to unrecognized<br />
tax benefits in in<strong>com</strong>e tax expense. As of June 30, <strong>2009</strong> and 2008,<br />
we had accrued interest of $636 and $656 and penalties of $100 and<br />
$155, respectively, that are not included in the above table. During<br />
the fiscal years ended June 30, <strong>2009</strong> and 2008, we recognized $119<br />
and $213 in interest and $(4) and $35 in penalties, respectively.<br />
Deferred in<strong>com</strong>e tax assets and liabilities were <strong>com</strong>prised of the<br />
following:<br />
June 30 <strong>2009</strong> 2008<br />
DEFERRED TAX ASSETS<br />
Pension and postretirement benefits $ 1,395 $ 633<br />
Stock-based <strong>com</strong>pensation 1,182 1,082<br />
Unrealized loss on financial and foreign<br />
exchange transactions 577 1,274<br />
Loss and other carryforwards 439 482<br />
Goodwill and other intangible assets 331 267<br />
Accrued marketing and promotion expense 167 125<br />
Accrued interest and taxes 120 123<br />
Fixed assets 114 100<br />
Inventory 97 114<br />
Advance payments 15 302<br />
Other 885 1,048<br />
Valuation allowances (104) (173)<br />
TOTAL 5,218 5,377<br />
DEFERRED TAX LIABILITIES<br />
Goodwill and other intangible assets 11,922 12,371<br />
Fixed assets 1,654 1,847<br />
Other 146 151<br />
TOTAL 13,722 14,369<br />
Net operating loss carryforwards were $1,428 and $1,515 at June 30,<br />
<strong>2009</strong> and 2008, respectively. If unused, $462 will expire between 2010<br />
and 2029. The remainder, totaling $966 at June 30, <strong>2009</strong>, may be<br />
carried forward indefinitely.<br />
NOTE 10<br />
COMMITMENTS AND CONTINGENCIES<br />
Guarantees<br />
In conjunction with certain transactions, primarily divestitures, we may<br />
provide routine indemnifications (e.g., indemnification for representations<br />
and warranties and retention of previously existing environmental,<br />
tax and employee liabilities) which terms range in duration and in some<br />
circumstances are not explicitly defined. The maximum obligation under<br />
some indemnifications is also not explicitly stated and, as a result, the<br />
overall amount of these obligations cannot be reasonably estimated.<br />
Other than obligations recorded as liabilities at the time of divestiture,<br />
we have not made significant payments for these indemnifications. We<br />
believe that if we were to incur a loss on any of these matters, the<br />
loss would not have a material effect on our financial position, results<br />
of operations or cash flows.<br />
In certain situations, we guarantee loans for suppliers and customers.<br />
The total amount of guarantees issued under such arrangements is<br />
not material.
Notes to Consolidated Financial Statements The <strong>Procter</strong> & <strong>Gamble</strong> Company 69<br />
Off-Balance Sheet Arrangements<br />
We do not have off-balance sheet financing arrangements, including<br />
variable interest entities, that have a material impact on our financial<br />
statements.<br />
Purchase Commitments<br />
We have purchase <strong>com</strong>mitments for materials, supplies, services<br />
and property, plant and equipment as part of the normal course of<br />
business. Commitments made under take-or-pay obligations are as<br />
follows: 2010 —$1,258; 2011 —$872; 2012 —$787; 2013 —$525;<br />
2014 —$156; and $299 thereafter. Such amounts represent future<br />
purchases in line with expected usage to obtain favorable pricing.<br />
Approximately 43% of our purchase <strong>com</strong>mitments relate to service<br />
contracts for information technology, human resources management<br />
and facilities management activities that have been outsourced to<br />
third-party suppliers. Due to the proprietary nature of many of our<br />
materials and processes, certain supply contracts contain penalty<br />
provisions for early termination. We do not expect to incur penalty<br />
payments under these provisions that would materially affect our<br />
financial position, results of operations or cash flows.<br />
Operating Leases<br />
We lease certain property and equipment for varying periods. Future<br />
minimum rental <strong>com</strong>mitments under noncancelable operating<br />
leases are as follows: 2010 — $305; 2011 — $272; 2012 — $223;<br />
2013 — $202; 2014 — $176; and $442 thereafter. Operating lease<br />
obligations are shown net of guaranteed sublease in<strong>com</strong>e.<br />
Litigation<br />
We are subject to various legal proceedings and claims arising out of<br />
our business which cover a wide range of matters such as governmental<br />
regulations, antitrust and trade regulations, product liability,<br />
patent and trademark matters, in<strong>com</strong>e taxes and other actions.<br />
As previously disclosed, the Company is subject to a variety of investigations<br />
into potential <strong>com</strong>petition law violations in Europe, including<br />
investigations initiated in the fourth quarter of fiscal 2008 by the<br />
European Commission with the assistance of national authorities<br />
from a variety of countries. We believe these matters involve a number<br />
of other consumer products <strong>com</strong>panies and/or retail customers. The<br />
Company’s policy is to <strong>com</strong>ply with all laws and regulations, including<br />
all antitrust and <strong>com</strong>petition laws, and to cooperate with investigations<br />
by relevant regulatory authorities, which the Company is doing.<br />
Competition and antitrust law inquiries often continue for several years<br />
and, if violations are found, can result in substantial fines. In other<br />
industries, fines have amounted to hundreds of millions of dollars.<br />
At this point, no significant formal claims have been made against the<br />
Company or any of our subsidiaries in connection with any of the<br />
above inquiries.<br />
In response to the actions of the European Commission and national<br />
authorities, the Company has launched its own internal investigations<br />
into potential violations of <strong>com</strong>petition laws, some of which are<br />
ongoing. The Company has identified violations in certain European<br />
countries and appropriate actions are being taken. It is still too early<br />
for us to reasonably estimate the fines to which the Company will be<br />
subject as a result of these <strong>com</strong>petition law issues. However, the<br />
ultimate resolution of these matters will likely result in fines or other<br />
costs that could materially impact our in<strong>com</strong>e statement and cash<br />
flows in the period in which they are accrued and paid, respectively.<br />
As these matters evolve the Company will, if necessary, recognize the<br />
appropriate reserves.<br />
With respect to other litigation and claims, while considerable uncertainty<br />
exists, in the opinion of management and our counsel, the<br />
ultimate resolution of the various lawsuits and claims will not materially<br />
affect our financial position, results of operations or cash flows.<br />
We are also subject to contingencies pursuant to environmental laws<br />
and regulations that in the future may require us to take action to<br />
correct the effects on the environment of prior manufacturing and<br />
waste disposal practices. Based on currently available information, we<br />
do not believe the ultimate resolution of environmental remediation<br />
will have a material adverse effect on our financial position, results of<br />
operations or cash flows.<br />
NOTE 11<br />
SEGMENT INFORMATION<br />
Through fiscal <strong>2009</strong>, we were organized under three GBUs as follows:<br />
��The Beauty GBU includes the Beauty and the Grooming businesses.<br />
The Beauty business is <strong>com</strong>prised of cosmetics, deodorants, prestige<br />
fragrances, hair care, personal cleansing and skin care. The Grooming<br />
business includes blades and razors, electric hair removal devices,<br />
face and shave products and home appliances.<br />
��The Health and Well-Being GBU includes the Health Care and the<br />
Snacks and Pet Care businesses. The Health Care business includes<br />
feminine care, oral care, personal health care and pharmaceuticals.<br />
The Snacks and Pet Care business includes pet food and snacks.<br />
��The Household Care GBU includes the Fabric Care and Home Care<br />
as well as the Baby Care and Family Care businesses. The Fabric Care<br />
and Home Care business includes air care, batteries, dish care,<br />
fabric care and surface care. The Baby Care and Family Care business<br />
includes baby wipes, bath tissue, diapers, facial tissue and paper<br />
towels.<br />
Under U.S. GAAP, we have six reportable segments: Beauty; Grooming;<br />
Health Care; Snacks and Pet Care; Fabric Care and Home Care; and<br />
Baby Care and Family Care. The accounting policies of the businesses<br />
are generally the same as those described in Note 1. Differences<br />
between these policies and U.S. GAAP primarily reflect: in<strong>com</strong>e taxes,<br />
which are reflected in the businesses using applicable blended statutory<br />
rates; the recording of fixed assets at historical exchange rates in certain<br />
high-inflation economies; and the treatment of certain unconsolidated<br />
investees. Certain unconsolidated investees are managed as integral<br />
parts of our business units for management reporting purposes.<br />
Amounts in millions of dollars except per share amounts or as otherwise specified.
70 The <strong>Procter</strong> & <strong>Gamble</strong> Company Notes to Consolidated Financial Statements<br />
Accordingly, these partially owned operations are reflected as consolidated<br />
subsidiaries in segment results, with 100% recognition of the<br />
individual in<strong>com</strong>e statement line items through before-tax earnings.<br />
Eliminations to adjust these line items to U.S. GAAP are included in<br />
Corporate. In determining after-tax earnings for the businesses, we<br />
eliminate the share of earnings applicable to other ownership interests,<br />
in a manner similar to minority interest and apply statutory tax rates.<br />
Adjustments to arrive at our effective tax rate are also included in<br />
Corporate.<br />
Corporate includes certain operating and non-operating activities that<br />
are not reflected in the operating results used internally to measure and<br />
evaluate the businesses, as well as eliminations to adjust management<br />
reporting principles to U.S. GAAP. Operating activities in Corporate<br />
include the results of incidental businesses managed at the corporate<br />
level along with the elimination of individual revenues and expenses<br />
generated by certain unconsolidated investees discussed in the preceding<br />
paragraph over which we exert significant influence, but do not<br />
Global Segment Results Net Sales<br />
BEAUTY GBU<br />
Amounts in millions of dollars except per share amounts or as otherwise specified.<br />
control. Operating elements also include certain employee benefit<br />
costs, the costs of certain restructuring-type activities to maintain a<br />
<strong>com</strong>petitive cost structure, including manufacturing and workforce<br />
rationalization, and other general Corporate items. The non-operating<br />
elements in Corporate primarily include interest expense, divestiture<br />
gains and interest and investing in<strong>com</strong>e. In addition, Corporate includes<br />
the historical results of certain divested businesses. Corporate assets<br />
primarily include cash, investment securities and all goodwill.<br />
The Company had net sales in the U.S. of $31.1 billion, $31.3 billion<br />
and $30.3 billion for the years ended June 30, <strong>2009</strong>, 2008 and 2007,<br />
respectively. Assets in the U.S. totaled $71.9 billion and $73.8 billion<br />
as of June 30, <strong>2009</strong> and 2008, respectively.<br />
Our largest customer, Wal-Mart Stores, Inc. and its affiliates, accounted<br />
for 15% of consolidated net sales in <strong>2009</strong>, 2008 and 2007.<br />
Earnings from<br />
Continuing<br />
Operations<br />
Before<br />
In<strong>com</strong>e Taxes<br />
Net Earnings<br />
from<br />
Continuing<br />
Operations<br />
Depreciation<br />
and<br />
Amortization Total Assets<br />
Capital<br />
Expenditures<br />
BEAUTY <strong>2009</strong> $18,789 $ 3,367 $ 2,531 $ 465 $ 11,330 $ 530<br />
2008 19,515 3,528 2,730 454 12,260 465<br />
2007 17,889 3,440 2,611 419 11,140 431<br />
GROOMING <strong>2009</strong> 7,543 2,091 1,492 710 26,192 290<br />
2008 8,254 2,299 1,679 739 27,406 305<br />
2007 7,437 1,895 1,383 729 27,767 314<br />
HEALTH AND WELL-BEING GBU<br />
HEALTH CARE <strong>2009</strong> 13,623 3,685 2,435 435 9,373 397<br />
2008 14,578 3,746 2,506 441 10,597 450<br />
2007 13,381 3,365 2,233 439 9,512 374<br />
SNACKS AND PET CARE <strong>2009</strong> 3,114 388 234 100 1,382 72<br />
2008 3,204 409 261 102 1,651 78<br />
2007 2,985 381 244 121 1,570 94<br />
HOUSEHOLD CARE GBU<br />
FABRIC CARE AND HOME CARE <strong>2009</strong> 23,186 4,663 3,032 578 12,457 808<br />
2008 23,714 5,060 3,411 599 13,708 763<br />
2007 21,355 4,636 3,119 567 12,113 706<br />
BABY CARE AND FAMILY CARE <strong>2009</strong> 14,103 2,827 1,770 570 7,363 902<br />
2008 13,898 2,700 1,728 612 8,102 763<br />
2007 12,726 2,291 1,440 671 7,731 769<br />
CORPORATE (1) <strong>2009</strong> (1,329) (1,696) (201) 224 66,736 239<br />
2008 (1,415) (2,110) (517) 181 70,268 222<br />
2007 (941) (1,744) (967) 135 68,181 257<br />
TOTAL COMPANY <strong>2009</strong> 79,029 15,325 11,293 3,082 134,833 3,238<br />
2008 81,748 15,632 11,798 3,128 143,992 3,046<br />
2007 74,832 14,264 10,063 3,081 138,014 2,945<br />
(1) The Corporate reportable segment includes the total assets and capital expenditures of the Coffee business prior to the divestiture in November 2008.
Notes to Consolidated Financial Statements The <strong>Procter</strong> & <strong>Gamble</strong> Company 71<br />
NOTE 12<br />
DISCONTINUED OPERATIONS<br />
In November 2008, the Company <strong>com</strong>pleted the divestiture of our<br />
Coffee business through the merger of its Folgers coffee subsidiary into<br />
The J.M. Smucker Company (Smucker) in an all-stock reverse Morris<br />
Trust transaction. In connection with the merger, 38.7 million shares<br />
of <strong>com</strong>mon stock of the Company were tendered by shareholders and<br />
exchanged for all shares of Folgers <strong>com</strong>mon stock, resulting in an<br />
increase of treasury stock of $2,466. Pursuant to the merger, a Smucker<br />
subsidiary merged with and into Folgers and Folgers became a wholly<br />
owned subsidiary of Smucker. The Company recorded an after-tax<br />
gain on the transaction of $2,011, which is included in Net Earnings<br />
from Discontinued Operations in the Consolidated Statement of<br />
Earnings for the year ended June 30, <strong>2009</strong>.<br />
The Coffee business had historically been part of the Company’s Snacks,<br />
Coffee and Pet Care reportable segment, as well as the coffee portion<br />
of our away-from-home business which is included in the Fabric Care<br />
NOTE 13<br />
QUARTERLY RESULTS (UNAUDITED)<br />
and Home Care reportable segment. In accordance with the applicable<br />
accounting guidance for the impairment or disposal of long-lived<br />
assets, the results of Folgers are presented as discontinued operations<br />
and, as such, have been excluded from both continuing operations and<br />
segment results for all years presented. Following is selected financial<br />
information included in Net Earnings from Discontinued Operations<br />
for the Coffee business:<br />
Years Ended June 30 <strong>2009</strong> 2008 2007<br />
Net Sales $ 668 $1,754 $1,644<br />
Earnings from discontinued<br />
operation 212 446 447<br />
In<strong>com</strong>e tax expense (80) (169) (170)<br />
Gain on sale of discontinued<br />
operation 1,896 — —<br />
Deferred tax benefit on sale 115 — —<br />
Net earnings from discontinued<br />
operations 2,143 277 277<br />
Quarters Ended Sept 30 Dec 31 Mar 31 Jun 30 Total Year<br />
NET SALES 2008–<strong>2009</strong> $21,582 $20,368 $18,417 $18,662 $79,029<br />
2007–2008 19,799 21,038 20,026 20,885 81,748<br />
OPERATING INCOME 2008–<strong>2009</strong> 4,569 4,251 3,730 3,573 16,123<br />
2007–2008 4,298 4,590 4,013 3,736 16,637<br />
GROSS MARGIN 2008–<strong>2009</strong> 50.8% 51.6% 50.3% 50.3% 50.8%<br />
2007–2008 53.2% 52.3% 51.7% 49.4% 51.6%<br />
NET EARNINGS:<br />
Earnings from continuing operations 2008 –<strong>2009</strong> $ 3,275 $ 2,962 $ 2,585 $ 2,471 $11,293<br />
2007–2008 3,004 3,194 2,650 2,950 11,798<br />
Earnings from discontinued operations 2008–<strong>2009</strong> 73 2,042 28 — 2,143<br />
2007–2008 75 76 60 66 277<br />
Net earnings 2008–<strong>2009</strong> 3,348 5,004 2,613 2,471 13,436<br />
2007–2008 3,079 3,270 2,710 3,016 12,075<br />
DILUTED NET EARNINGS PER COMMON SHARE:<br />
Earnings from continuing operations 2008–<strong>2009</strong> $ 1.01 $ 0.94 $ 0.83 $ 0.80 $ 3.58<br />
2007–2008 0.90 0.96 0.80 0.90 3.56<br />
Earnings from discontinued operations 2008–<strong>2009</strong> 0.02 0.64 0.01 — 0.68<br />
2007–2008 0.02 0.02 0.02 0.02 0.08<br />
Diluted net earnings per <strong>com</strong>mon share 2008–<strong>2009</strong> 1.03 1.58 0.84 0.80 4.26<br />
2007–2008 0.92 0.98 0.82 0.92 3.64<br />
Amounts in millions of dollars except per share amounts or as otherwise specified.
72 The <strong>Procter</strong> & <strong>Gamble</strong> Company<br />
Shareholder Information<br />
IF …<br />
��You need online access or help with your account<br />
��You are interested in our certificate safekeeping service<br />
��You want to arrange for direct deposit or reinvestment of dividends<br />
��You have a lost, stolen or destroyed stock certificate<br />
CALL PERSON-TO-PERSON<br />
��Shareholder Services representatives are available<br />
Monday–Friday, 9AM–4PM EST at 1-800-742-6253<br />
(call 1-513-983-3034 outside the USA and Canada)<br />
��Automated service available after USA business hours<br />
CONTACT P&G SHAREHOLDER SERVICES — 24 HOURS A DAY<br />
��Visit us online at www.pg.<strong>com</strong>/investor, where you can get stock<br />
purchase information, transaction forms, P&G annual reports and<br />
webcasts<br />
��E-mail us at shareholders.im@pg.<strong>com</strong><br />
��Call for financial information at 1-800-764-7483<br />
COMMON STOCK PRICE RANGE AND DIVIDENDS<br />
Price Range<br />
Quarter Ended<br />
2008–<strong>2009</strong><br />
High<br />
2008–<strong>2009</strong><br />
Low<br />
2007–2008<br />
High<br />
2007–2008<br />
Low<br />
September 30 $73.57 $60.05 $70.73 $60.89<br />
December 31 71.94 53.77 75.18 67.90<br />
March 31 62.97 43.93 73.81 62.74<br />
June 30 54.77 46.29 71.20 60.44<br />
Dividends<br />
Quarter Ended 2008–<strong>2009</strong> 2007–2008<br />
September 30 $ 0.40 $0.35<br />
December 31 0.40 0.35<br />
March 31 0.40 0.35<br />
June 30 0.44 0.40<br />
DIVIDEND HISTORY<br />
P&G has paid dividends without interruption since its incorporation<br />
in 1890 and has increased dividends each year for the past 53 fiscal<br />
years. P&G’s <strong>com</strong>pound annual dividend growth rate is 9.5% over<br />
the last 53 years.<br />
CORPORATE HEADQUARTERS<br />
The <strong>Procter</strong> & <strong>Gamble</strong> Company<br />
P.O. Box 599<br />
Cincinnati, OH 45201-0599<br />
TRANSFER AGENT/SHAREHOLDER SERVICES<br />
The <strong>Procter</strong> & <strong>Gamble</strong> Company<br />
Shareholder Services Department<br />
P.O. Box 5572<br />
Cincinnati, OH 45201-5572<br />
REGISTRAR<br />
The <strong>Procter</strong> & <strong>Gamble</strong> Company<br />
P.O. Box 599<br />
Cincinnati, OH 45201-0599<br />
EXCHANGE LISTINGS<br />
New York Stock Exchange, NYSE Euronext-Paris<br />
STOCK SYMBOL<br />
PG<br />
SHAREHOLDERS OF COMMON STOCK<br />
There were approximately 2,301,000 <strong>com</strong>mon stock shareowners,<br />
including shareholders of record, participants in the Shareholder<br />
Investment Program, participants in P&G stock ownership plans and<br />
beneficial owners with accounts at banks and brokerage firms, as<br />
of June 30, <strong>2009</strong>.<br />
FORM 10-K<br />
Shareholders may obtain a copy of P&G’s <strong>2009</strong> report to the<br />
Securities and Exchange Commission on Form 10-K by going to<br />
www.pg.<strong>com</strong>/investor or by calling us at 1-800-764-7483. This<br />
information is also available at no charge by sending a request to<br />
Shareholder Services at the address listed above.<br />
The most recent certifications by our Chief Executive and Chief Financial<br />
Officer pursuant to Section 302 of the Sarbanes-Oxley Act of 2002 are<br />
filed as exhibits to our Form 10-K for the fiscal year ended June 30,<br />
<strong>2009</strong>. We have also filed with the New York Stock Exchange the most<br />
recent <strong>Annual</strong> CEO certification as required by Section 303A.12(a) of<br />
the New York Stock Exchange Listed Company Manual.<br />
ANNUAL MEETING<br />
The next annual meeting of shareholders will be held on Tuesday,<br />
October 13, <strong>2009</strong>. A full transcript of the meeting will be available<br />
from Susan Felder, Assistant Secretary. Ms. Felder can be reached at<br />
299 East Sixth Street, Cincinnati, Ohio 45202-3315.
Financial Summary (Unaudited)<br />
The <strong>Procter</strong> & <strong>Gamble</strong> Company 73<br />
Amounts in millions,<br />
except per share amounts <strong>2009</strong> 2008 2007 2006 2005 2004 2003 2002 2001 2000 1999<br />
Net Sales $ 79,029 $ 81,748 $ 74,832 $ 66,724 $55,292 $50,128 $42,133 $38,965 $37,855 $38,545 $36,710<br />
Gross Margin 40,131 42,212 39,173 34,549 28,213 25,709 20,570 18,547 16,473 17,854 16,394<br />
Operating In<strong>com</strong>e 16,123 16,637 15,003 12,916 10,026 9,019 6,931 5,672 3,976 5,457 5,885<br />
Net Earnings from<br />
Continuing Operations 11,293 11,798 10,063 8,478 6,648 5,930 4,554 3,663 2,437 3,225 3,513<br />
Net Earnings from<br />
Discontinued<br />
Operations 2,143 277 277 206 275 226 234 247 175 138 170<br />
Net Earnings 13,436 12,075 10,340 8,684 6,923 6,156 4,788 3,910 2,612 3,363 3,683<br />
Net Earnings Margin from<br />
Continuing Operations 14.3% 14.4% 13.4% 12.7% 12.0% 11.8% 10.8% 9.4% 6.4% 8.4% 9.6%<br />
Basic Net Earnings per<br />
Common Share:<br />
Earnings from<br />
continuing<br />
operations $ 3.76 $ 3.77 $ 3.13 $ 2.72 $ 2.59 $ 2.25 $ 1.71 $ 1.36 $ 0.89 $ 1.19 $ 1.28<br />
Earnings from<br />
discontinued<br />
operations 0.73 0.09 0.09 0.07 0.11 0.09 0.09 0.10 0.07 0.05 0.07<br />
Basic Net Earnings per<br />
Common Share 4.49 3.86 3.22 2.79 2.70 2.34 1.80 1.46 0.96 1.24 1.35<br />
Diluted Net Earnings<br />
per Common Share:<br />
Earnings from<br />
continuing<br />
operations $ 3.58 $ 3.56 $ 2.96 $ 2.58 $ 2.43 $ 2.12 $ 1.62 $ 1.30 $ 0.86 $ 1.13 $ 1.21<br />
Earnings from<br />
discontinued<br />
operations 0.68 0.08 0.08 0.06 0.10 0.08 0.08 0.09 0.06 0.04 0.06<br />
Diluted Net Earnings per<br />
Common Share 4.26 3.64 3.04 2.64 2.53 2.20 1.70 1.39 0.92 1.17 1.27<br />
Dividends per<br />
Common Share 1.64 1.45 1.28 1.15 1.03 0.93 0.82 0.76 0.70 0.64 0.57<br />
Restructuring Program<br />
Charges (1) $ — $ — $ — $ — $ — $ — $ 751 $ 958 $ 1,850 $ 814 $ 481<br />
Research and<br />
Development Expense 2,044 2,212 2,100 2,060 1,926 1,782 1,641 1,572 1,751 1,880 1,709<br />
Advertising Expense 7,579 8,583 7,850 7,045 5,850 5,401 4,406 3,696 3,654 3,828 3,471<br />
Total Assets 134,833 143,992 138,014 135,695 61,527 57,048 43,706 40,776 34,387 34,366 32,192<br />
Capital Expenditures 3,238 3,046 2,945 2,667 2,181 2,024 1,482 1,679 2,486 3,018 2,828<br />
Long-Term Debt 20,652 23,581 23,375 35,976 12,887 12,554 11,475 11,201 9,792 9,012 6,265<br />
Shareholders’ Equity 63,099 69,494 66,760 62,908 18,475 18,190 17,025 14,415 12,560 12,673 12,352<br />
(1) Restructuring program charges, on an after-tax basis, totaled $538, $706, $1,475, $688 and $285 for 2003, 2002, 2001, 2000 and 1999, respectively, related to a multi-year restructuring plan<br />
initiated in 1999 concurrent with the reorganization of our business units from geographic into product-based Global Business Units.
74 The <strong>Procter</strong> & <strong>Gamble</strong> Company<br />
Shareholder Return Performance Graphs<br />
FIVE-YEAR CUMULATIVE TOTAL RETURN<br />
The following graph <strong>com</strong>pares the cumulative total return of P&G’s<br />
<strong>com</strong>mon stock for the 5-year period ending June 30, <strong>2009</strong>, against<br />
the cumulative total return of the S&P 500 Stock Index and the<br />
S&P 500 Consumer Staples Index. The graph and tables assume<br />
$100 was invested on June 30, 2004, and that all dividends were<br />
reinvested. The benchmark of “Composite Group” has been replaced<br />
by the S&P 500 Consumer Staples Index as the more relevant line of<br />
business <strong>com</strong>parison to P&G’s operations. The Composite Group<br />
results are still provided in this transition year, and are <strong>com</strong>prised of<br />
the S&P Household Products Index, the S&P Paper Products Index,<br />
the S&P Personal Products Index, the S&P Health Care Index and the<br />
S&P Food Index, all weighted based on P&G’s current fiscal year<br />
revenues. Further, the Dow Jones Industrial Average will no longer be<br />
shown after this year, as a “broad market” index as the S&P 500<br />
satisfies this <strong>com</strong>parison.<br />
DIVIDEND HISTORY<br />
P&G has paid dividends without interruption since its incorporation<br />
in 1890 and has increased dividends each year for the past 53 fiscal<br />
years. P&G’s <strong>com</strong>pound annual dividend growth rate is 9.5% over<br />
the last 53 years.<br />
COMPARISON OF FIVE-YEAR CUMULATIVE TOTAL RETURN<br />
P&G S&P 500 Consumer Staples Index S&P 500 Index Composite Group<br />
140<br />
130<br />
120<br />
110<br />
100<br />
90<br />
80<br />
DIVIDENDS PER SHARE (split-adjusted)<br />
1.70<br />
1.36<br />
1.02<br />
0.68<br />
0.34<br />
0.00<br />
2004 2005<br />
1956<br />
1970<br />
2006<br />
Cumulative Value of $100 Investment,<br />
through June 30<br />
Company Name/Index 2004 2005 2006 2007 2008 <strong>2009</strong><br />
P&G $100 $ 99 $106 $119 $121 $105<br />
S&P 500 Consumer<br />
Staples Index 100 102 110 128 128 104<br />
S&P 500 Index 100 106 115 139 121 89<br />
DJIA 100 101 112 138 119 92<br />
Composite Group 100 99 111 131 121 99<br />
1984<br />
2007<br />
1998<br />
2008<br />
The paper utilized in the printing of this annual report is certified by SmartWood to the FSC<br />
Standards, which promotes environmentally appropriate, socially beneficial and economically<br />
viable management of the world’s forests. The paper contains a mix of pulp that is derived<br />
from FSC certified well-managed forests; post-consumer recycled paper fibers and other<br />
controlled sources.<br />
<strong>2009</strong><br />
<strong>2009</strong><br />
(in dollars, split adjusted) 1956 1970 1984 1998 <strong>2009</strong><br />
Dividends per Share $0.01 $0.04 $0.15 $0.51 $1.64<br />
Design: VSA Partners, Inc.
Designed to Matter<br />
Sustainability at P&G<br />
At P&G, we focus our sustainability efforts on improvements<br />
that matter, making the most meaningful impact possible.<br />
Our <strong>com</strong>mitment begins with our Purpose, Values and<br />
Principles, where sustainability is embedded, manifesting<br />
itself in a systemic and long-term approach. From product<br />
innovations and operational improvements to social<br />
responsibility, employee engagement, and stakeholder<br />
partnerships, we pursue our sustainability goals with the aim<br />
of improving quality of life, now and for generations to <strong>com</strong>e.<br />
In 2007, we established five sustainability strategies and goals<br />
for 2012. In March <strong>2009</strong>, we increased our goals to reflect<br />
our progress and to demonstrate our ongoing <strong>com</strong>mitment to<br />
sustainable, responsible growth.<br />
To learn more, please visit www.pg.<strong>com</strong>/sustainability.<br />
Strategy 1:<br />
Products<br />
Delight the consumer<br />
with sustainable<br />
innovations that<br />
improve the<br />
environmental profile<br />
of our products.<br />
GOAL:<br />
Develop and market<br />
at least $50 billion in<br />
cumulative sales of<br />
“sustainable innovation<br />
products,” which are<br />
products with a<br />
significantly reduced<br />
(>10%) environmental<br />
footprint versus previous<br />
or alternative products.<br />
Strategy 2:<br />
Operations<br />
Improve the<br />
environmental<br />
profile of P&G’s<br />
own operations.<br />
GOAL:<br />
Deliver an additional<br />
20% reduction (per unit<br />
of production) in CO 2<br />
emissions, energy<br />
consumption, water<br />
consumption and<br />
disposed waste from<br />
P&G plants, leading to a<br />
total reduction over the<br />
decade of at least 50%.<br />
Strategy 3:<br />
Social<br />
Responsibility<br />
Improve children’s<br />
lives through P&G’s<br />
social responsibility<br />
programs.<br />
GOAL:<br />
Enable 300 million<br />
children to Live, Learn<br />
and Thrive. Prevent<br />
120 million days of<br />
disease and save<br />
thousands of lives by<br />
delivering 3 billion liters<br />
of clean water in our<br />
Children’s Safe Drinking<br />
Water program.<br />
Strategy 4:<br />
Employees<br />
Engage and equip<br />
all P&Gers to build<br />
sustainability thinking<br />
and practices into<br />
their everyday work.<br />
Strategy 5:<br />
Stakeholders<br />
Shape the future by<br />
working transparently<br />
with our stakeholders<br />
to enable continued<br />
freedom to innovate<br />
in a responsible way.
© <strong>2009</strong> <strong>Procter</strong> & <strong>Gamble</strong><br />
00046009