P&G 2009 Annual Report – AnnualReports.com - Procter & Gamble
P&G 2009 Annual Report – AnnualReports.com - Procter & Gamble
P&G 2009 Annual Report – AnnualReports.com - Procter & Gamble

You also want an ePaper? Increase the reach of your titles
YUMPU automatically turns print PDFs into web optimized ePapers that Google loves.
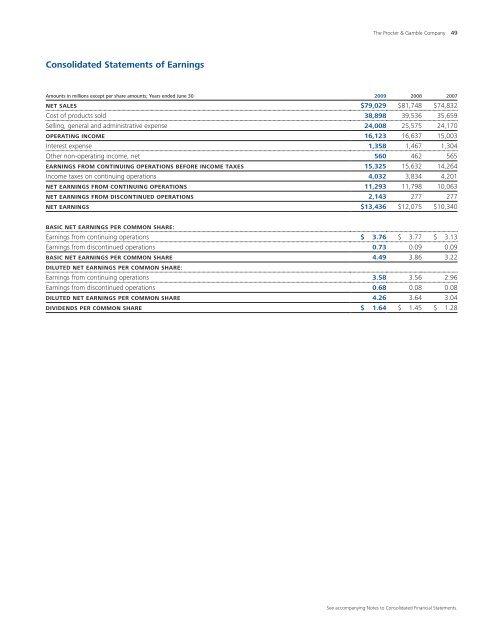
Consolidated Statements of Earnings<br />
The <strong>Procter</strong> & <strong>Gamble</strong> Company 49<br />
Amounts in millions except per share amounts; Years ended June 30 <strong>2009</strong> 2008 2007<br />
NET SALES $79,029 $81,748 $74,832<br />
Cost of products sold 38,898 39,536 35,659<br />
Selling, general and administrative expense 24,008 25,575 24,170<br />
OPERATING INCOME 16,123 16,637 15,003<br />
Interest expense 1,358 1,467 1,304<br />
Other non-operating in<strong>com</strong>e, net 560 462 565<br />
EARNINGS FROM CONTINUING OPERATIONS BEFORE INCOME TAXES 15,325 15,632 14,264<br />
In<strong>com</strong>e taxes on continuing operations 4,032 3,834 4,201<br />
NET EARNINGS FROM CONTINUING OPERATIONS 11,293 11,798 10,063<br />
NET EARNINGS FROM DISCONTINUED OPERATIONS 2,143 277 277<br />
NET EARNINGS $13,436 $12,075 $10,340<br />
BASIC NET EARNINGS PER COMMON SHARE:<br />
Earnings from continuing operations $ 3.76 $ 3.77 $ 3.13<br />
Earnings from discontinued operations 0.73 0.09 0.09<br />
BASIC NET EARNINGS PER COMMON SHARE 4.49 3.86 3.22<br />
DILUTED NET EARNINGS PER COMMON SHARE:<br />
Earnings from continuing operations 3.58 3.56 2.96<br />
Earnings from discontinued operations 0.68 0.08 0.08<br />
DILUTED NET EARNINGS PER COMMON SHARE 4.26 3.64 3.04<br />
DIVIDENDS PER COMMON SHARE $ 1.64 $ 1.45 $ 1.28<br />
See ac<strong>com</strong>panying Notes to Consolidated Financial Statements.