P&G 2009 Annual Report – AnnualReports.com - Procter & Gamble
P&G 2009 Annual Report – AnnualReports.com - Procter & Gamble
P&G 2009 Annual Report – AnnualReports.com - Procter & Gamble

You also want an ePaper? Increase the reach of your titles
YUMPU automatically turns print PDFs into web optimized ePapers that Google loves.
Management’s Discussion and Analysis The <strong>Procter</strong> & <strong>Gamble</strong> Company 35<br />
related to general overhead and workforce optimization. Successfully<br />
managing these changes, including identifying, developing and<br />
retaining key employees, is critical to our success.<br />
Global Economic Conditions. Economic changes, terrorist activity and<br />
political unrest may result in business interruption, inflation, deflation<br />
or decreased demand for our products. Our success will depend, in<br />
part, on our ability to manage continued global political and/or<br />
economic uncertainty, especially in our significant geographic markets,<br />
as well as any political or economic disruption due to terrorist and<br />
other hostile activities.<br />
Regulatory Environment. Changes in laws, regulations and the related<br />
interpretations may alter the environment in which we do business.<br />
This includes changes in environmental, <strong>com</strong>petitive and productrelated<br />
laws, as well as changes in accounting standards and taxation<br />
requirements. Our ability to manage regulatory, tax and legal matters<br />
(including product liability, patent, intellectual property, <strong>com</strong>petition<br />
law matters and tax policy) and to resolve pending legal matters<br />
within current estimates may impact our results.<br />
RESULTS OF OPERATIONS<br />
Net Sales<br />
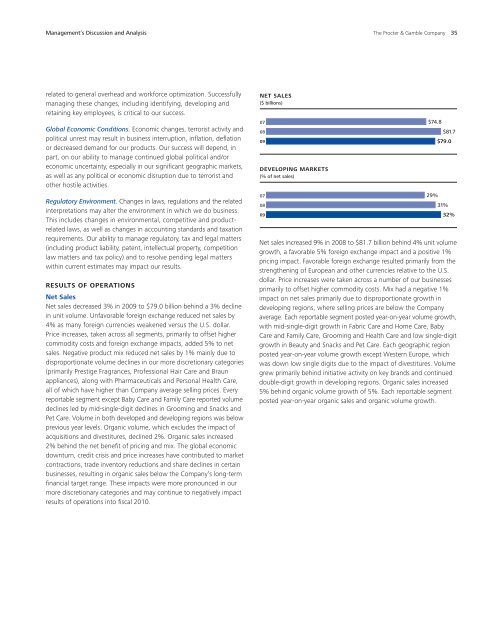
Net sales decreased 3% in <strong>2009</strong> to $79.0 billion behind a 3% decline<br />
in unit volume. Unfavorable foreign exchange reduced net sales by<br />
4% as many foreign currencies weakened versus the U.S. dollar.<br />
Price increases, taken across all segments, primarily to offset higher<br />
<strong>com</strong>modity costs and foreign exchange impacts, added 5% to net<br />
sales. Negative product mix reduced net sales by 1% mainly due to<br />
disproportionate volume declines in our more discretionary categories<br />
(primarily Prestige Fragrances, Professional Hair Care and Braun<br />
appliances), along with Pharmaceuticals and Personal Health Care,<br />
all of which have higher than Company average selling prices. Every<br />
reportable segment except Baby Care and Family Care reported volume<br />
declines led by mid-single-digit declines in Grooming and Snacks and<br />
Pet Care. Volume in both developed and developing regions was below<br />
previous year levels. Organic volume, which excludes the impact of<br />
acquisitions and divestitures, declined 2%. Organic sales increased<br />
2% behind the net benefit of pricing and mix. The global economic<br />
downturn, credit crisis and price increases have contributed to market<br />
contractions, trade inventory reductions and share declines in certain<br />
businesses, resulting in organic sales below the Company’s long-term<br />
financial target range. These impacts were more pronounced in our<br />
more discretionary categories and may continue to negatively impact<br />
results of operations into fiscal 2010.<br />
NET SALES<br />
($ billions)<br />
07<br />
08<br />
09<br />
DEVELOPING MARKETS<br />
(% of net sales)<br />
07<br />
08<br />
09<br />
$74.8<br />
29%<br />
$81.7<br />
$79.0<br />
31%<br />
32%<br />
Net sales increased 9% in 2008 to $81.7 billion behind 4% unit volume<br />
growth, a favorable 5% foreign exchange impact and a positive 1%<br />
pricing impact. Favorable foreign exchange resulted primarily from the<br />
strengthening of European and other currencies relative to the U.S.<br />
dollar. Price increases were taken across a number of our businesses<br />
primarily to offset higher <strong>com</strong>modity costs. Mix had a negative 1%<br />
impact on net sales primarily due to disproportionate growth in<br />
developing regions, where selling prices are below the Company<br />
average. Each reportable segment posted year-on-year volume growth,<br />
with mid-single-digit growth in Fabric Care and Home Care, Baby<br />
Care and Family Care, Grooming and Health Care and low single-digit<br />
growth in Beauty and Snacks and Pet Care. Each geographic region<br />
posted year-on-year volume growth except Western Europe, which<br />
was down low single digits due to the impact of divestitures. Volume<br />
grew primarily behind initiative activity on key brands and continued<br />
double-digit growth in developing regions. Organic sales increased<br />
5% behind organic volume growth of 5%. Each reportable segment<br />
posted year-on-year organic sales and organic volume growth.