America’s Dirtiest Power Plants
America's Dirtiest Power Plants - Environment Minnesota
America's Dirtiest Power Plants - Environment Minnesota
- No tags were found...

You also want an ePaper? Increase the reach of your titles
YUMPU automatically turns print PDFs into web optimized ePapers that Google loves.
<strong>America’s</strong> <strong>Dirtiest</strong> <strong>Power</strong> <strong>Plants</strong><br />
Their Oversized Contribution to Global<br />
Warming and What We Can Do About It
<strong>America’s</strong> <strong>Dirtiest</strong><br />
<strong>Power</strong> <strong>Plants</strong><br />
Their Oversized Contribution to Global Warming<br />
and What We Can Do About It<br />
Written by:<br />
Jordan Schneider and Travis Madsen, Frontier Group<br />
Julian Boggs, Environment America Research & Policy Center<br />
September 2013
Acknowledgments<br />
The authors thank Jeff Deyette, Senior Energy Analyst at Union of Concerned Scientists; Liz Perera,<br />
Senior Washington Representative, and Debbie Sease, Legislative Director, at Sierra Club; Mike<br />
Obeiter, Senior Associate, Climate and Energy Program at World Resources Institute; Starla Yeh,<br />
Policy Analyst, Climate and Clean Air Program at Natural Resources Defense Council; and others for<br />
providing useful feedback and insightful suggestions on drafts of this report. We also thank Frank<br />
Iannuzzi at Environment America Research & Policy Center for contributing to this report; and Tony<br />
Dutzik and Ben Davis at Frontier Group for providing editorial support.<br />
The authors bear responsibility for any factual errors. The views expressed in this report are those of<br />
the authors and do not necessarily reflect the views of our funders or those who provided review.<br />
© 2013 Environment Minnesota Research & Policy Center<br />
The Environment Minnesota Research & Policy Center is a 501(c)(3) organization.<br />
We are dedicated to protecting Minnesota’s air, water and open spaces. We<br />
investigate problems, craft solutions, educate the public and decision-makers,<br />
and help Minnesotans make their voices heard in local, state and national<br />
debates over the quality of our environment and our lives. For more information about Environment<br />
Minnesota Research & Policy Center or for additional copies of this report, please visit www.<br />
environmentminnesotacenter.org.<br />
Frontier Group conducts independent research and policy analysis to support a cleaner, healthier<br />
and more democratic society. Our mission is to inject accurate information and compelling ideas into<br />
public policy debates at the local, state and federal levels. For more information about Frontier Group,<br />
please visit www.frontiergroup.org.<br />
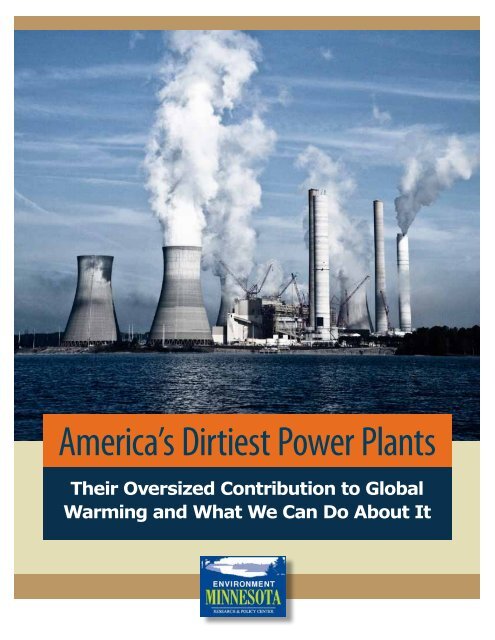
Cover photo: Georgia <strong>Power</strong> Company’s Plant Scherer in Juliette, Georgia, is the nation’s mostpolluting<br />
power plant. Each year, it emits more carbon dioxide pollution than that produced by<br />
energy consumption in Maine. See Table 1 in report.<br />
Photo Credit: TinRoof Marketing & Design<br />
Cover design: Kathleen Krushas, To the Point Publications, www.tothepointpublications.com
Table of Contents<br />
Executive Summary . . . . . . . . . . . . . . . . . . . . . . . . . . . . . . . . . . . . . . . . . . . . . 4<br />
Introduction ...................................................8<br />
The <strong>Dirtiest</strong> U.S. <strong>Power</strong> <strong>Plants</strong> Are a Major Source of<br />
Global Warming Pollution ......................................10<br />
Cutting U.S. <strong>Power</strong> Plant Pollution Can Help Prevent the<br />
Worst Impacts of Global Warming . . . . . . . . . . . . . . . . . . . . . . . . . . . . . . . 16<br />
Carbon Pollution Standards Are Needed to Clean Up<br />
Existing <strong>Power</strong> <strong>Plants</strong>. ..........................................20<br />
Policy Recommendations. .......................................22<br />
Methodology . . . . . . . . . . . . . . . . . . . . . . . . . . . . . . . . . . . . . . . . . . . . . . . . . .24<br />
Appendices . . . . . . . . . . . . . . . . . . . . . . . . . . . . . . . . . . . . . . . . . . . . . . . . . . . . . 26<br />
Notes .........................................................42
Executive<br />
Summary<br />
Global warming is one of the most profound<br />
threats of our time, and we’re already starting<br />
to feel the impacts – especially when it<br />
comes to extreme weather. From Hurricane Sandy to<br />
devastating droughts and deadly heat waves, extreme<br />
weather events threaten our safety, our health<br />
and our environment, and scientists predict things<br />
will only get worse for future generations unless we<br />
cut the dangerous global warming pollution that<br />
is fueling the problem. <strong>Power</strong> plants are the largest<br />
source of global warming pollution in the United<br />
States, responsible for 41 percent of the nation’s<br />
production of carbon dioxide pollution, the leading<br />
greenhouse gas driving global warming.<br />
<strong>America’s</strong> power plants are among the most significant<br />
sources of carbon dioxide pollution in the world.<br />
The 50 most-polluting U.S. power plants emit<br />
more than 2 percent of the world’s energy-related<br />
carbon dioxide pollution – or more pollution than<br />
every nation except six worldwide.<br />
A small handful of the dirtiest<br />
power plants produce a massive and<br />
disproportionate share of the nation’s<br />
global warming pollution.<br />
In 2011, the U.S. power sector contributed 41<br />
percent of all U.S. emissions of carbon dioxide, the<br />
leading pollutant driving global warming.<br />
There are nearly 6,000 electricity generating facilities<br />
in the United States, but most of the global<br />
warming pollution emitted by the U.S. power<br />
sector comes from a handful of exceptionally dirty<br />
power plants. For example, about 30 percent of<br />
all power-sector carbon dioxide emissions in 2011<br />
came from the 50 dirtiest power plants; about half<br />
came from the 100 dirtiest plants; and about 90<br />
percent came from the 500 dirtiest plants. (See<br />
Figure ES-1.)<br />
Despite their enormous contribution to global warming,<br />
U.S. power plants do not face any federal limits<br />
on carbon dioxide pollution. To protect our health,<br />
our safety and our environment from the worst<br />
impacts of global warming, the United States should<br />
clean up the dirtiest power plants.<br />
Figure ES-1. The 50 <strong>Dirtiest</strong> <strong>Power</strong> <strong>Plants</strong><br />
Contribute Significantly to U.S. Carbon Dioxide<br />
Pollution (Million Metric Tons – MMT), 2011<br />
4 <strong>America’s</strong> <strong>Dirtiest</strong> <strong>Power</strong> <strong>Plants</strong>
The dirtiest power plant in the United States,<br />
Georgia <strong>Power</strong>’s Plant Scherer, produced more<br />
than 21 million metric tons of carbon dioxide<br />
in 2011 – more than the total energy-related<br />
emissions of Maine. (See Table ES-1.)<br />
Dirty power plants produce a disproportionate<br />
share of the nation’s global warming pollution –<br />
especially given the relatively small share of total<br />
electricity they produce. For example, despite<br />
producing 30 percent of all power-sector carbon<br />
dioxide emissions, the 50 dirtiest power plants only<br />
produced 16 percent of the nation’s electricity in<br />
2011.<br />
The dirtiest U.S. power plants are<br />
major sources of global warming<br />
pollution on a global scale.<br />
If the 50 most-polluting U.S. power plants<br />
were an independent nation, they would be<br />
the seventh-largest emitter of carbon dioxide<br />
in the world, behind Germany and ahead of<br />
South Korea. (See Figure ES-2.) These power<br />
plants emitted carbon dioxide pollution<br />
equivalent to more than half the emissions<br />
of all passenger vehicles in the United States<br />
in 2010.<br />
Table ES-1. Emissions Equivalencies for the Nation’s Top Emitters of Global Warming Pollution<br />
Total 2011<br />
Emissions (Million<br />
Metric Tons of<br />
Carbon Dioxide)<br />
Percent of<br />
Total U.S.<br />
Carbon Dioxide<br />
Emissions<br />
Percent of Global<br />
Carbon Dioxide<br />
Emissions from<br />
Energy Use<br />
These <strong>Plants</strong> Produce Carbon Dioxide<br />
Greater Than or Equivalent To…<br />
Top Polluting<br />
Plant (Scherer<br />
<strong>Power</strong> Plant, GA)<br />
Top 10 Polluting<br />
<strong>Power</strong> <strong>Plants</strong><br />
Top 50 Polluting<br />
<strong>Power</strong> <strong>Plants</strong><br />
Top 100 Polluting<br />
<strong>Power</strong> <strong>Plants</strong><br />
21 0.4% 0.1%<br />
179 3.4% 0.5%<br />
656 12.4% 2.0%<br />
1,052 19.9% 3.2%<br />
The total energy-related emissions<br />
of Maine<br />
The pollution produced by<br />
electricity use in all New England<br />
homes in a year<br />
The pollution emitted by all the<br />
passenger vehicles in New York and<br />
California<br />
The total energy-related emissions<br />
of Venezuela<br />
Half the emissions of all passenger<br />
vehicles in the United States<br />
The total energy-related emissions<br />
of Texas<br />
The emissions of all passenger<br />
vehicles in the United States<br />
The pollution produced by<br />
electricity use in all U.S. homes in<br />
a year<br />
Executive Summary 5
Figure ES-2. Carbon Dioxide Pollution Emitted by the 50 <strong>Dirtiest</strong> <strong>Power</strong> <strong>Plants</strong> Compared to<br />
Other Countries (MMT CO 2 )<br />
10,000<br />
9,000<br />
8,000<br />
7,000<br />
6,000<br />
5,000<br />
4,000<br />
3,000<br />
2,000<br />
1,000<br />
0<br />
China<br />
United<br />
States<br />
All U.S.<br />
<strong>Power</strong><br />
<strong>Plants</strong><br />
India Russia Japan Germany 50 <strong>Dirtiest</strong><br />
U.S.<br />
<strong>Power</strong><br />
<strong>Plants</strong><br />
South<br />
Korea<br />
Canada<br />
The 100 most-polluting U.S. power plants<br />
produced more than 3 percent of the world’s<br />
carbon dioxide emissions from energy use in 2011,<br />
while the 500 most-polluting power plants were<br />
responsible for about 6 percent.<br />
To protect our health, our safety, and<br />
our environment from the dangers of<br />
global warming, America must clean<br />
up polluting power plants.<br />
The Obama Administration should set strong<br />
limits on carbon dioxide pollution from new<br />
power plants to prevent the construction of a new<br />
generation of dirty power plants, and force existing<br />
power plants to clean up by setting strong<br />
limits on carbon dioxide emissions from all existing<br />
power plants.<br />
º New plants – The Environmental Protection<br />
Agency (EPA) should work to meet its September<br />
2013 deadline for re-proposing a<br />
stringent emissions standard for new power<br />
plants. It should also set a deadline for finalizing<br />
these standards no later than June 2015.<br />
º Existing plants – The EPA should work to<br />
meet the timeline put forth by President<br />
Obama for proposing and finalizing emissions<br />
standards for existing power plants. This<br />
timeline calls for limits on existing plants to<br />
be proposed by June 2014 and finalized by<br />
June 2015. The standards should be based on<br />
the most recent climate science and designed<br />
to achieve the emissions reduction targets<br />
that are necessary to avoid the worst impacts<br />
of global warming.<br />
6 <strong>America’s</strong> <strong>Dirtiest</strong> <strong>Power</strong> <strong>Plants</strong>
In addition to cutting pollution from<br />
power plants, the United States should<br />
adopt a suite of clean energy policies<br />
at the local, state, and federal levels to<br />
curb emissions of carbon dioxide from<br />
energy use in other sectors.<br />
In particular, the United States should prioritize establishing<br />
a comprehensive, national plan to reduce<br />
carbon pollution from all sources – including transportation,<br />
industrial activities, and the commercial<br />
and residential sectors.<br />
Other policies to curb emissions include:<br />
Retrofitting three-quarters of <strong>America’s</strong> homes and<br />
businesses for improved energy efficiency, and<br />
implementing strong building energy codes to<br />
dramatically reduce fossil fuel consumption in new<br />
homes and businesses.<br />
Adopting a federal renewable electricity standard<br />
that calls for 25 percent of <strong>America’s</strong> electricity to<br />
come from clean, renewable sources by 2025.<br />
Strengthening and implementing state energy<br />
efficiency resource standards that require utilities<br />
to deliver energy efficiency improvements in<br />
homes, businesses and industries.<br />
Installing more than 200 gigawatts of solar panels<br />
and other forms of distributed renewable energy<br />
at residential, commercial and industrial buildings<br />
over the next two decades.<br />
Encouraging the use of energy-saving combined<br />
heat-and-power systems in industry.<br />
Facilitating the deployment of millions of plug-in<br />
vehicles that operate partly or solely on electricity,<br />
and adopting clean fuel standards that require a<br />
reduction in the carbon intensity of transportation<br />
fuels.<br />
Ensuring that the majority of new residential and<br />
commercial development in metropolitan areas<br />
takes place in compact, walkable communities<br />
with access to a range of transportation options.<br />
Expanding public transportation service to double<br />
ridership by 2030, encouraging further ridership<br />
increases through better transit service, and<br />
reducing per-mile global warming pollution from<br />
transit vehicles. The U.S. should also build highspeed<br />
rail lines in 11 high-priority corridors by<br />
2030.<br />
Strengthening and expanding the Regional Greenhouse<br />
Gas Initiative, which limits carbon dioxide<br />
pollution from power plants in nine northeastern<br />
state, and implementing California’s Global<br />
Warming Solutions Act (AB32), which places an<br />
economy-wide cap on the state’s greenhouse gas<br />
emissions.<br />
Executive Summary 7
Introduction<br />
It doesn’t take a trip to the Arctic Circle to see<br />
evidence of global warming these days. The impacts<br />
of a warming planet are now appearing<br />
on our doorsteps, making headlines in the morning<br />
paper. The United States has seen much more than<br />
its usual share of extreme downpours and intense<br />
heat waves in recent years, and emerging science<br />
links the increase in frequency and severity of some<br />
of these events to global warming. 1 New research<br />
also shows that a warmer world is likely to exacerbate<br />
the impacts of extreme weather events, such<br />
as hurricanes, floods, drought and wildfires. 2 Many<br />
extreme weather events of 2012 foreshadow the<br />
kind of disruption global warming may cause in the<br />
future. From the late-season “superstorm” Hurricane<br />
Sandy wreaking havoc on the East Coast, to earlyseason<br />
wildfires destroying thousands of homes in<br />
the West, to year-round drought conditions parching<br />
the largest area of the continental U.S. since<br />
1956, extreme weather events are occurring with<br />
increasing frequency and severity. 3<br />
Since 2007, federally declared weather-related<br />
disasters in the United States have affected counties<br />
housing 243 million people – or nearly four out of<br />
five Americans. 4 These events have caused billions<br />
of dollars in economic damage, have harmed our<br />
natural environment, and have jeopardized the<br />
lives of thousands of people. Climate science tells<br />
us that the impacts of these events will only worsen<br />
for future generations unless we immediately and<br />
dramatically reduce the dangerous carbon pollution<br />
that is fueling the problem. Meeting that challenge<br />
can seem overwhelming, and it’s certainly not going<br />
to be easy. But the United States and the world can<br />
make a major down-payment toward those emission<br />
reductions by cleaning up our biggest sources of<br />
pollution.<br />
In the case of the United States, that means power<br />
plants. As this report will show, a small number of<br />
dirty power plants make a massive and disproportionate<br />
contribution to the nation’s global warming<br />
emissions. Cleaning up our existing power plants –<br />
and preventing construction of a new generation of<br />
dirty power plants – would make a significant difference<br />
in fighting global warming.<br />
For the first time in history, the United States is<br />
preparing to take action to clean up these massive<br />
sources of carbon pollution. In 2012, the Environmental<br />
Protection Agency (EPA) issued the first-ever<br />
pollution standards for new power plants, and this<br />
summer President Obama directed the EPA to establish<br />
a standard for existing power plants by 2015. 5<br />
By finalizing strong carbon pollution standards for<br />
new and existing power plants, the U.S. will seize one<br />
of its best available opportunities to significantly reduce<br />
carbon pollution – helping to forestall the worst<br />
impacts of global warming for future generations.<br />
8 <strong>America’s</strong> <strong>Dirtiest</strong> <strong>Power</strong> <strong>Plants</strong>
Photo: Keith Syvinski<br />
Indiana Michigan <strong>Power</strong> Company’s coal-fired Rockport power plant in Spencer<br />
County, Indiana, is the 11th largest emitter of carbon dioxide pollution in the<br />
U.S. power sector. It produces global warming pollution equivalent to that<br />
produced by 3.2 million passenger vehicles in a year. See Table A-2 in Appendix.<br />
By finalizing strong carbon pollution standards for<br />
new and existing power plants, the U.S. will seize<br />
one of its best available opportunities to significantly<br />
reduce carbon pollution – helping to forestall the worst<br />
impacts of global warming for future generations.<br />
Introduction 9
The <strong>Dirtiest</strong> U.S. <strong>Power</strong> <strong>Plants</strong><br />
Are a Major Source of Global<br />
Warming Pollution<br />
Carbon dioxide is the leading greenhouse gas<br />
driving global warming, and power plants<br />
are the largest source of carbon dioxide<br />
pollution in the United States. 6 Burning fossil fuels<br />
for electricity generation produced about 41 percent<br />
of total U.S. carbon dioxide emissions in 2011. 7 A<br />
disproportionate share of these power-sector carbon<br />
dioxide emissions come from a small subset of the<br />
nation’s dirtiest power plants, particularly coal-fired<br />
power plants. However, despite their enormous<br />
contribution to global warming, U.S. power plants<br />
currently face no federal limits on carbon dioxide<br />
pollution. Cleaning up these dirty power plants with<br />
strong, nationwide pollution standards is one of the<br />
most important steps the U.S. can take to curb global<br />
warming pollution.<br />
The 50 <strong>Dirtiest</strong> <strong>Power</strong> <strong>Plants</strong> Contribute<br />
a Massive and Disproportionate Share<br />
of Carbon Dioxide Emissions<br />
There are nearly 6,000 electricity generating facilities<br />
in the United States, but most of the global warming<br />
pollution emitted by the U.S. power sector comes<br />
from a handful of exceptionally dirty power plants. 8<br />
These dirty power plants also produce a disproportionately<br />
large amount of the nation’s total global<br />
warming pollution. For example, just one of these<br />
dirty power plants, Georgia <strong>Power</strong>’s Plant Scherer,<br />
produces more global warming pollution each year<br />
than all the energy-related emissions of Maine. 9<br />
In 2011, the 50 dirtiest U.S. power plants<br />
were responsible for 30 percent of all U.S.<br />
power-sector emissions of carbon dioxide, 12<br />
percent of total U.S. energy-related emissions,<br />
and 2 percent of worldwide energy-related<br />
emissions. 10 (See Figure 1.) If the 50 dirtiest power<br />
plants were an independent nation, they would<br />
be the seventh-largest emitter of carbon dioxide<br />
pollution in the world, behind Germany and ahead<br />
of South Korea. 11 (See Figure 2.) Their emissions<br />
in 2011 were greater than half the emissions of all<br />
passenger vehicles in the United States in 2010. 12<br />
(See Table 1 for additional comparisons.)<br />
The 100 dirtiest plants were responsible for about<br />
half of total carbon dioxide emissions from the U.S.<br />
electricity sector in 2011, and more than 3 percent<br />
of total worldwide emissions from energy use. 13<br />
The 500 dirtiest power plants were responsible<br />
for around 90 percent of total carbon dioxide<br />
emissions from the U.S. electricity sector, and<br />
about 6 percent of total worldwide emissions from<br />
energy use. 14<br />
10 <strong>America’s</strong> <strong>Dirtiest</strong> <strong>Power</strong> <strong>Plants</strong>
Figure 1. The 50 <strong>Dirtiest</strong> <strong>Power</strong> <strong>Plants</strong> Contribute Significantly to U.S. Carbon Dioxide Emissions<br />
Figure 2. Carbon Dioxide (CO 2 ) Pollution Emitted by the 50 <strong>Dirtiest</strong> <strong>Power</strong> <strong>Plants</strong> Compared to CO 2<br />
Pollution in Other Countries (MMT)<br />
10,000<br />
9,000<br />
8,000<br />
7,000<br />
6,000<br />
5,000<br />
4,000<br />
3,000<br />
2,000<br />
1,000<br />
0<br />
China<br />
United<br />
States<br />
All U.S.<br />
<strong>Power</strong><br />
<strong>Plants</strong><br />
India Russia Japan Germany 50 <strong>Dirtiest</strong><br />
U.S.<br />
<strong>Power</strong><br />
<strong>Plants</strong><br />
South<br />
Korea<br />
Canada<br />
The <strong>Dirtiest</strong> U.S. <strong>Power</strong> <strong>Plants</strong> Are a Major Source of Global Warming Pollution 11
Table 1. Emissions Equivalencies for the Nation’s Top Emitters of Global Warming Pollution 15<br />
Total 2011<br />
Emissions<br />
(Million Metric<br />
Tons of Carbon<br />
Dioxide)<br />
Percent of Total<br />
U.S. Carbon<br />
Dioxide<br />
Emissions<br />
Percent of<br />
Global Carbon<br />
Dioxide<br />
Emissions from<br />
Energy Use<br />
These <strong>Plants</strong> Produce Carbon Dioxide<br />
Greater Than or Equivalent To…<br />
Top Polluting<br />
Plant (Scherer<br />
<strong>Power</strong> Plant,<br />
GA)<br />
Top 10<br />
Polluting<br />
<strong>Power</strong> <strong>Plants</strong><br />
Top 50<br />
Polluting<br />
<strong>Power</strong> <strong>Plants</strong><br />
Top 100<br />
Polluting<br />
<strong>Power</strong> <strong>Plants</strong><br />
21 0.4% 0.1%<br />
179 3.4% 0.5%<br />
656 12.4% 2.0%<br />
1,052 19.9% 3.2%<br />
The total energy-related emissions of<br />
Maine 16<br />
The pollution produced by electricity use<br />
in all New England homes in a year 17<br />
The pollution emitted by all the passenger<br />
vehicles in New York and California 18<br />
The total energy-related emissions of<br />
Venezuela 19<br />
Half the emissions of all passenger<br />
vehicles in the United States 20<br />
The total energy-related emission of<br />
Texas 21<br />
The emissions of all passenger vehicles in<br />
the United States 22<br />
The pollution produced by electricity use<br />
in all U.S. homes in a year 23<br />
The <strong>Dirtiest</strong> <strong>Power</strong> <strong>Plants</strong> Are Old and<br />
Inefficient<br />
Coal-fired power plants are among the biggest<br />
sources of carbon dioxide pollution in the electric<br />
power sector. 24 In fact, 98 of the nation’s 100 mostpolluting<br />
power plants in terms of total carbon dioxide<br />
emissions are coal plants; among the top 500,<br />
317 (63 percent) are coal plants. 25 The remainder are<br />
older oil and gas-fired power plants. (See Table A-2<br />
in Appendix).<br />
Most of the nation’s coal plants are old and inefficient.<br />
About 74 percent of U.S. coal plants were at<br />
least 30 years old at the end of 2012, and about half<br />
were 40 to 60 years old, according to the Energy<br />
Information Administration (EIA). 26 Coal plants are<br />
not designed to last much longer than 30 years, but<br />
coal companies routinely renovate these plants to<br />
extend their lifetimes. 27 Still, many of these plants<br />
are inefficient to operate, so power providers run<br />
them at only a fraction of their full capacity or for<br />
shorter periods of time, which results in a lower<br />
“capacity factor” (the ratio of a power plant’s actual<br />
output compared to its full capacity) for the oldest<br />
and dirtiest plants. In 2009, the average capacity<br />
factor for the whole U.S. coal fleet was 64 percent,<br />
with about 40 percent reporting capacity factors<br />
below 30 percent. 28<br />
Although many coal plants today are underutilized<br />
because of their age and inefficiency, they remain<br />
12 <strong>America’s</strong> <strong>Dirtiest</strong> <strong>Power</strong> <strong>Plants</strong>
Figure 3. Share of Statewide <strong>Power</strong>-Sector Emissions vs. Share of Electricity Generation for Top 5<br />
SD<br />
DE<br />
RI<br />
NH<br />
VT<br />
MT<br />
NM<br />
NE<br />
ND<br />
AK<br />
ID<br />
UT<br />
OR<br />
WY<br />
KS<br />
WA<br />
MN<br />
TN<br />
ME<br />
AZ<br />
3%<br />
8%<br />
11%<br />
23%<br />
22%<br />
Emitters in 20 States 31 81%<br />
35%<br />
40%<br />
46%<br />
44%<br />
46%<br />
46%<br />
49%<br />
48%<br />
50%<br />
53%<br />
52%<br />
60%<br />
65%<br />
69%<br />
78%<br />
83%<br />
82%<br />
85%<br />
89%<br />
89%<br />
88%<br />
88%<br />
92%<br />
91%<br />
90%<br />
94%<br />
93%<br />
93%<br />
97%<br />
96%<br />
96%<br />
100%<br />
99%<br />
99%<br />
Top 5 Share<br />
of Total<br />
Electricity<br />
Generation<br />
(2011)<br />
Top 5 Share<br />
of Total<br />
<strong>Power</strong>-<br />
Sector<br />
Emissions<br />
(2011)<br />
0% 20% 40% 60% 80% 100%<br />
among the worst contributors to global warming<br />
pollution. For example, coal-fired power plants<br />
were responsible for nearly 80 percent of the<br />
global warming pollution produced by electric<br />
power plants in 2011, even though they produced<br />
only 42 percent of the nation’s electricity. 29<br />
The 50 dirtiest plants produced 30 percent of all<br />
power-sector carbon dioxide emissions, but only<br />
16 percent of electricity nationwide in 2011. 30 In<br />
some states, this imbalance is even more extreme.<br />
(See Figure 3.)<br />
In some states, emissions from a handful of the<br />
dirtiest power plants can exceed emissions from<br />
the rest of the economy, including the industrial<br />
and transportation sectors. For example, in five<br />
states – Wyoming, Montana, North Dakota, West<br />
Virginia, and New Mexico – the five dirtiest power<br />
plants are responsible for about half of total statewide<br />
energy-related emissions; and in 31 states,<br />
these top polluters are responsible for at least<br />
one-quarter of statewide energy-related emissions.<br />
(See Table 2 and Table A-3 in the Appendix.)<br />
The <strong>Dirtiest</strong> U.S. <strong>Power</strong> <strong>Plants</strong> Are a Major Source of Global Warming Pollution 13
Table 2. Emissions of Top 5 Polluting <strong>Plants</strong> as a Share of <strong>Power</strong>-Sector and Statewide Total Carbon<br />
Dioxide Emissions in 50 States, 2011 32<br />
State<br />
Total Emissions of Top<br />
5 <strong>Power</strong> <strong>Plants</strong> (Million<br />
Metric Tons of<br />
Carbon Dioxide)<br />
Top 5 Share of <strong>Power</strong>-<br />
Sector Emissions (2011) Top 5 Share of Total Emissions 33<br />
Wyoming 38.1 89% 59%<br />
Montana 16.1 96% 55%<br />
North Dakota 27.1 93% 52%<br />
West Virginia 49.3 69% 52%<br />
New Mexico 29.1 94% 50%<br />
Utah 30.6 90% 49%<br />
Arizona 43.0 81% 46%<br />
Nebraska 24.7 93% 45%<br />
Arkansas 32.0 92% 45%<br />
Kansas 30.8 88% 41%<br />
Alabama 48.1 63% 36%<br />
Delaware 3.9 99% 36%<br />
North Carolina 43.0 71% 36%<br />
Missouri 50.1 62% 35%<br />
Georgia 52.1 76% 34%<br />
Iowa 29.7 75% 34%<br />
Kentucky 50.4 54% 34%<br />
South Carolina 26.3 70% 34%<br />
Tennessee 34.4 83% 34%<br />
Oklahoma 35.0 69% 32%<br />
Hawaii 5.6 77% 31%<br />
New Hampshire 4.9 97% 31%<br />
Wisconsin 29.1 67% 29%<br />
Maryland 18.6 80% 28%<br />
Nevada 9.3 64% 28%<br />
Colorado 26.2 67% 28%<br />
Rhode Island 3.5 99% 28%<br />
Michigan 42.8 64% 27%<br />
Indiana 58.7 52% 27%<br />
Minnesota 26.3 85% 27%<br />
Mississippi 14.1 61% 25%<br />
Ohio 54.7 50% 24%<br />
South Dakota 2.9 100% 23%<br />
Pennsylvania 55.7 48% 22%<br />
14 <strong>America’s</strong> <strong>Dirtiest</strong> <strong>Power</strong> <strong>Plants</strong>
Table 2. (continued)<br />
State<br />
Total Emissions of Top<br />
5 <strong>Power</strong> <strong>Plants</strong> (Million<br />
Metric Tons of<br />
Carbon Dioxide)<br />
Top 5 Share of <strong>Power</strong>-<br />
Sector Emissions (2011) Top 5 Share of Total Emissions 33<br />
Oregon 5.9 89% 22%<br />
Illinois 44.0 46% 19%<br />
Virginia 16.8 60% 19%<br />
Florida 41.7 37% 18%<br />
Massachusetts 10.5 66% 16%<br />
Connecticut 5.9 75% 16%<br />
Washington 6.7 88% 15%<br />
Louisiana 35.0 61% 12%<br />
Maine 2.8 82% 11%<br />
Texas 74.6 30% 10%<br />
New Jersey 9.9 64% 10%<br />
New York 11.0 32% 7%<br />
Alaska 2.8 75% 6%<br />
Idaho 0.4 91% 4%<br />
California 7.5 19% 2%<br />
Vermont 0.0 96% 0%<br />
Despite the large contribution of fossil fuel-fired<br />
power plants to U.S. global warming emissions,<br />
neither these highly polluting plants nor proposed<br />
new power plants face any federal regulations limiting<br />
emissions of carbon dioxide or other greenhouse<br />
gases. As a result, these power plants have emitted<br />
carbon dioxide pollution unchecked for decades,<br />
and there is no guarantee that new power plants will<br />
be built in ways that minimize their contribution to<br />
global warming.<br />
The <strong>Dirtiest</strong> U.S. <strong>Power</strong> <strong>Plants</strong> Are a Major Source of Global Warming Pollution 15
Cutting U.S. <strong>Power</strong> Plant Pollution<br />
Can Help Prevent the Worst<br />
Impacts of Global Warming<br />
Global warming threatens our health, our<br />
safety, and our environment. Rising global<br />
average temperatures and other climate<br />
impacts have already resulted in extreme precipitation<br />
events and heat waves in the United States,<br />
and climate science tells us that global warming will<br />
likely lead to further changes in weather extremes. 34<br />
Extreme weather events such as Hurricane Sandy,<br />
extended droughts, heat waves, and floods caused<br />
by heavy precipitation are likely to become more<br />
common in a warming world. 35 At the same time,<br />
global warming-induced sea-level rise, changes in<br />
summer and winter precipitation patterns, and ecosystem<br />
changes could reduce the ability of natural<br />
and man-made systems to withstand even normal<br />
weather events.<br />
To avoid the worst impacts of global warming,<br />
worldwide emissions of carbon dioxide and other<br />
global warming pollutants will have to peak roughly<br />
three years from now, and then decline quickly and<br />
dramatically – dropping by more than 50 percent by<br />
2050. 36 In the United States, addressing this challenge<br />
means cleaning up our biggest sources of<br />
global warming pollution – especially dirty power<br />
plants, which are responsible for more than 40 percent<br />
of our emissions of carbon dioxide each year. 37<br />
A handful of exceptionally dirty power plants are<br />
the worst contributors to this problem. By focusing<br />
on cleaning up power plants – our country’s largest<br />
single source of carbon pollution – and preventing<br />
construction of a new generation of dirty power<br />
plants in the United States, America can make a<br />
meaningful difference in preventing the worst impacts<br />
of global warming.<br />
The U.S. must act now to prevent the<br />
worst impacts of global warming<br />
In 2007, the Intergovernmental Panel on Climate<br />
Change (IPCC) – the world’s foremost scientific<br />
authority on the subject – concluded that “warming<br />
of the climate system is unequivocal” and that<br />
“[m]ost of the observed increase in global average<br />
temperatures since the mid-20 th century is very<br />
likely due to the observed increase in anthropogenic<br />
[greenhouse gas] concentrations.” 38 In 2013, in<br />
a draft of its upcoming Fifth Assessment Report on<br />
climate change, the IPCC strengthened this assertion,<br />
citing “near certainty” that global warming is<br />
human-caused and suggesting that seas could rise<br />
by as much as three feet by the end of the century if<br />
greenhouse gas emissions continue unabated. 39<br />
Clear signs of global warming have already begun<br />
to emerge:<br />
Global average sea and air temperatures in 2010<br />
were tied for the hottest on record, according to<br />
the National Oceanic and Atmospheric Administration<br />
(NOAA). 40 2001 to 2010 was the hottest<br />
decade on record, with average temperatures<br />
estimated to be 0.83˚F hotter than the 1961-1990<br />
norm. 41 2010 was also the wettest year on record<br />
based on global average precipitation. 42<br />
16 <strong>America’s</strong> <strong>Dirtiest</strong> <strong>Power</strong> <strong>Plants</strong>
Oceans have absorbed 80 percent of the extra<br />
heat in the climate system, causing ocean water to<br />
expand. 43 Coupled with melting glaciers, this has<br />
caused sea levels to rise by about eight inches –<br />
with the rate of increase accelerating. 44<br />
Hurricanes have become more intense, and the<br />
frequency of extreme rain and snowstorms has<br />
increased. 45<br />
At the same time, droughts in many parts of the<br />
world have become longer and more severe,<br />
especially in the tropics and subtropics. 46<br />
In the United States, warmer average annual<br />
temperatures are connected to increases in<br />
extreme precipitation and more intense heat<br />
waves. Furthermore, the U.S. has experienced an<br />
increase in the frequency and severity of extreme<br />
weather events, including floods, prolonged<br />
drought, more intense wildfires, and stronger tropical<br />
storms and hurricanes. 47<br />
The more global warming pollution that humanity<br />
emits, the more serious the consequences. And the<br />
changes will be largely irreversible for a thousand<br />
years after emissions stop. 48<br />
On our current emissions path, humanity risks increasing<br />
the average global temperature by 4°C<br />
(7.2°F) or more (above the pre-industrial era) by the<br />
end of this century even if current emission reduction<br />
commitments and pledges are met, according to<br />
a 2012 report by the World Bank. 49 Warming on this<br />
scale would have catastrophic consequences, including:<br />
Sea level rise of as much as 3 feet in the next<br />
century, causing extensive coastal inundation and<br />
increasing the risk of storm surge flooding in major<br />
coastal cities.50 By 2300, global mean sea levels<br />
could rise as high as 13 feet above present-day<br />
levels. 51<br />
A 150 percent increase in ocean acidity above<br />
pre-industrial levels, resulting in wide-ranging,<br />
negative impacts on marine species and ecosystems,<br />
with particularly severe damage to coral<br />
reefs and fisheries. 52<br />
An increase of 20-30 percent in the amount of<br />
precipitation falling during heavy rainstorms,<br />
increasing the risk of major flooding events in<br />
many parts of the world. 53<br />
Increasing aridity, drought and extreme temperatures<br />
in Africa, southern Europe and the Middle<br />
East, and most of the Americas, Australia, and<br />
Southeast Asia. 54<br />
Global Warming Endangers Public<br />
Health<br />
Hotter temperatures bring about numerous threats<br />
to public health. High temperatures combine with<br />
sunlight, nitrogen oxides and volatile organic compounds<br />
to create ozone “smog,” which damages<br />
the respiratory system, reduces lung function, and<br />
aggravates asthma and other respiratory diseases. 55<br />
The Union of Concerned Scientists estimates that, by<br />
2020, students in the United States could experience<br />
more than 900,000 additional missed school days,<br />
and seniors and infants could experience more than<br />
5,000 additional hospitalizations due to increases<br />
of ozone smog exposure that result from the higher<br />
temperatures caused by global warming. 56 Higher<br />
temperatures will also allow pollen allergens such<br />
as ragweed to proliferate, causing those who suffer<br />
from seasonal allergies to experience worsening<br />
symptoms, such as hay fever and asthma. 57<br />
Global warming can also be expected to increase<br />
the number of deaths caused by heat stress. 58 Excessive<br />
heat events happen when high temperatures<br />
combine with other weather conditions – such as<br />
dew point temperature, cloud cover, wind speed and<br />
surface atmospheric pressure throughout the day –<br />
Cutting U.S. <strong>Power</strong> Plant Pollution Can Help Prevent the Worst Impacts of Global Warming 17
and contribute to heat-related deaths in a particular<br />
location. 59 According to a 2012 study by the Natural<br />
Resources Defense Council (NRDC), excessive heat<br />
events caused by global warming could kill up to<br />
150,000 people in <strong>America’s</strong> 40 largest cities by the<br />
end of the century. 60<br />
Higher temperatures may also change the patterns<br />
of occurrence of various infectious diseases. A 2009<br />
study, for example, found a correlation between<br />
warmer temperatures and increased reports of infection<br />
by West Nile Virus. 61 Global warming may also<br />
increase the risk of more frequent and more widespread<br />
outbreaks of waterborne illnesses by allowing<br />
warm-water pathogens to expand into cooler<br />
climates, or by exposing more urban water bodies<br />
to sewage contamination after flooding caused by<br />
major precipitation events, according to NRDC. 62<br />
Increases in droughts and flooding caused by global<br />
warming can also reduce water available for drinking<br />
or for irrigation; they can also harm crops directly,<br />
diminishing food variety, nutritional content, and<br />
availability, all of which can contribute to malnutrition<br />
and the spread of disease. 63 Finally, sea-level rise<br />
and disasters such as strong storms and floods can<br />
damage urban infrastructure and displace existing<br />
communities. 64<br />
Global warming pollutants are not the only emissions<br />
from power plants that harm human health.<br />
For example, in 2010, two-thirds of all airborne<br />
mercury pollution in the United States came from the<br />
smokestacks of coal-fired power plants. 65 Mercury<br />
is a potent neurotoxicant, and exposure to mercury<br />
during critical periods of brain development can<br />
contribute to irreversible deficits in verbal skills, damage<br />
to attention and motor control, and reduced IQ. 66<br />
Coal- and natural gas-fired power plants also emit<br />
nitrogen oxides (NO X ), which exacerbate ozone smog<br />
pollution, as well as other pollutants that contribute<br />
to particulate matter and acid rain. Like smog,<br />
particulate matter pollution contributes to a host<br />
of respiratory and cardiovascular ailments. 67 Sulfur<br />
dioxide, too, is a respiratory irritant for sensitive<br />
populations. 68 In addition, it is a major component of<br />
acid rain that has damaged forests across the eastern<br />
United States. 69<br />
Cleaning Up U.S. <strong>Power</strong> <strong>Plants</strong><br />
Would Cut Carbon Pollution at<br />
a Global Scale<br />
Humanity as a whole must limit emissions to no more<br />
than 1 trillion metric tons of carbon dioxide from<br />
2000 through 2050 in order to have a 75 percent<br />
chance of limiting the global temperature increase<br />
to 3.6° F (2° C) above the pre-industrial era – a target<br />
the international community has set to limit the most<br />
severe global warming impacts. 70 For the world, this<br />
means that emissions will need to peak by 2015 and<br />
decline by more than half by 2050 to have a chance<br />
at preventing the worst impacts of climate change. 71<br />
For the United States and other developed countries,<br />
emission reductions must occur more quickly and<br />
more steeply, with reductions of at least 25 to 40 percent<br />
below 1990 levels by 2020 and 80 to 95 percent<br />
by 2050. 72<br />
As of 2011, annual U.S. greenhouse gas emissions<br />
were still 10 percent above 1990 levels. 73 The annual<br />
emissions from a small group of the nation’s dirtiest<br />
power plants are greatly hindering our ability to<br />
meet the emissions reduction targets necessary to<br />
avoid the worst impacts of global warming. Replacing<br />
these power plants with zero-emission energy<br />
sources such as wind and solar power, or eliminating<br />
the need for the power they produce through energy<br />
efficiency and conservation, would reduce U.S.<br />
greenhouse gas emissions to 11 percent below 1990<br />
levels, even in the absence of other efforts to reduce<br />
emissions. 74<br />
Limiting carbon dioxide pollution from new and existing<br />
power plants is one of the most effective ways<br />
to reduce U.S. global warming pollution in the short<br />
run and for decades to come, reducing the risk that<br />
18 <strong>America’s</strong> <strong>Dirtiest</strong> <strong>Power</strong> <strong>Plants</strong>
emissions will reach a level that triggers dangerous,<br />
irreversible climate change impacts.<br />
Adopting federal limits on carbon dioxide pollution<br />
from power plants as part of a suite of policies to<br />
reduce global warming pollution at all levels of government<br />
would help the United States achieve 2020<br />
emissions reduction targets – even in the absence<br />
of a federal, economy-wide cap on carbon pollution.<br />
For example, Environment America Research<br />
& Policy Center’s 2011 report, The Way Forward on<br />
Global Warming, demonstrated that with a suite of<br />
local, state and federal policies to increase energy<br />
efficiency, deploy clean energy technologies and<br />
improve public transportation, the United States<br />
could curb emissions of carbon dioxide from energy<br />
use by as much as 3.5 percent below 1990<br />
levels by 2020 and 20 percent below 1990 levels<br />
by 2030. 75 A nationwide cap on carbon pollution<br />
from all sources – not just power plants – would allow<br />
the United States to make the remaining emissions<br />
reductions necessary to prevent the worst<br />
impacts of global warming.<br />
Cutting U.S. <strong>Power</strong> Plant Pollution Can Help Prevent the Worst Impacts of Global Warming 19
Carbon Pollution Standards<br />
Are Needed to Clean Up<br />
Existing <strong>Power</strong> <strong>Plants</strong><br />
The unprecedented threat that global warming<br />
poses to our health, our safety and our<br />
environment demands that the United<br />
States takes urgent action to reduce emissions of<br />
global warming pollution. However, U.S. power<br />
plants currently face no federal limits on the amount<br />
of carbon dioxide pollution they can emit.<br />
Given the enormous share of global warming pollution<br />
contributed by U.S. power plants, limiting carbon<br />
dioxide emissions from both new and existing<br />
power plants must be a key part of any strategy to<br />
reduce U.S. global warming emissions. Fortunately,<br />
the first steps toward setting these standards are<br />
already being taken. On June 25, 2013, President<br />
Obama announced his plan to address global warming<br />
through executive action, using existing statutory<br />
authority and funds. 76 The two most important<br />
elements of this plan are finalizing carbon emissions<br />
standards for new power plants and directing the<br />
EPA to quickly propose and implement a limit on<br />
existing plants. 77<br />
The EPA proposed a limit on new power plants<br />
in March 2012. Since then, the EPA has received<br />
more than 3.2 million public comments supporting<br />
limiting carbon pollution from power plants, and<br />
President Obama has asked the EPA to re-propose a<br />
carbon pollution standard for new power plants by<br />
September 20, 2013. 78<br />
larger to 1,000 pounds of CO 2 per megawatt-hour<br />
(MWh) of electricity they produce. 79 According to<br />
the EPA, this standard was based on commonly<br />
used combined-cycle natural gas power plants – a<br />
standard that new coal plants are highly unlikely to<br />
meet. 80 Existing coal plants produce an average of<br />
2,180 lbs CO 2 /MWh, with the worst plants producing<br />
more than 3,000 lbs CO 2 /MWh. 81<br />
The EPA has yet to propose a standard for existing<br />
power plants, a large portion of which are aging<br />
coal-fired plants. However, the president has directed<br />
the EPA to propose and submit carbon pollution<br />
limits for existing plants by June 2014 and to finalize<br />
those limits the following year. 82 (See “The Long Road<br />
to Carbon Pollution Limits” on page 21.)<br />
Some states already limit carbon pollution from power<br />
plants. California has an economy-wide cap on carbon<br />
dioxide emissions, and nine states from Maine<br />
to Maryland participate in the Regional Greenhouse<br />
Gas Initiative (RGGI), which caps pollution from<br />
power plants in the Northeast. Once finalized, the<br />
EPA’s carbon pollution limits for all new power plants<br />
nationwide would go a long way toward reducing<br />
future U.S. global warming pollution. However, the<br />
agency must also move quickly to establish strong<br />
federal standards for existing power plants – and<br />
force the nation’s largest sources of carbon pollution<br />
to clean up.<br />
The originally proposed limit restricts global warming<br />
pollution for facilities 25 megawatts (MW) or<br />
20 <strong>America’s</strong> <strong>Dirtiest</strong> <strong>Power</strong> <strong>Plants</strong>
The Long Road to Carbon Pollution Limits<br />
The Obama administration’s recent actions indicating progress toward carbon dioxide pollution<br />
from power plants are the culmination of a 14-year campaign to clean up the nation’s power<br />
plants. In 1999, one year after the EPA declined to include carbon dioxide pollution limits in new<br />
vehicle emissions standards, 19 environmental and public interest groups petitioned the EPA to<br />
classify carbon dioxide as an air pollutant subject to the Clean Air Act regulation. 83 They cited carbon<br />
dioxide’s contribution to global warming – which threatens human health and the environment<br />
– as rationale for regulation. 84<br />
In 2003, the EPA released an official statement that it did not believe the Act authorized the EPA<br />
to regulate global warming pollution, and that even if it did authorize regulating greenhouse<br />
gases, the EPA objected to doing so on policy grounds. 85 However, the U.S. Supreme Court disagreed<br />
with the EPA in 2007, ruling with several states and environmental groups that the EPA<br />
does indeed have the authority to regulate greenhouse gases, and that its policy objections were<br />
insufficient to decline to regulate. 86 The court also directed the EPA to determine if greenhouse<br />
gases contribute to global warming and, if so, whether global warming endangered public health<br />
and welfare. 87 By the end of 2009, the EPA officially determined that emissions of carbon dioxide<br />
endanger public health and welfare by contributing to global warming. 88<br />
In December 2010, the EPA announced its plan to release new performance standards and mandatory<br />
emissions guidelines for all new fossil fuel-fired power plants. 89 The EPA proposed an interim<br />
carbon pollution standard for new power plants in April 2012 that is in effect until a rule can be<br />
finalized. 90 This step set the first-ever national limits on the amount of carbon pollution power<br />
plants can emit. 91<br />
Carbon Pollution Standards Are Needed to Clean Up Existing <strong>Power</strong> <strong>Plants</strong> 21
Policy<br />
Recommendations<br />
To protect our health, our economy,<br />
and our environment from the dangers<br />
of global warming, America must clean<br />
up its dirtiest power plants.<br />
The Obama Administration should set strong<br />
limits on carbon dioxide pollution from new<br />
power plants to prevent the construction of a new<br />
generation of dirty power plants, and force existing<br />
power plants to clean up by setting strong<br />
limits on carbon dioxide emissions for all existing<br />
power plants.<br />
º New plants – The EPA should work to meet its<br />
September 2013 deadline for re-proposing a<br />
stringent emissions standard for new power<br />
plants. It should also set a deadline for finalizing<br />
these standards no later than June 2015.<br />
º Existing plants – The EPA should work to meet<br />
the timeline put forth by President Obama for<br />
proposing and finalizing emissions standards<br />
for existing power plants. This timeline calls for<br />
limits on existing plants to be proposed by June<br />
2014 and finalized by June 2015. 92 The standards<br />
should be based on climate science and<br />
designed to achieve the emissions reductions<br />
targets that are necessary to avoid the worst<br />
impacts of global warming.<br />
In addition to cutting pollution from<br />
power plants, the United States<br />
should adopt a suite of clean energy<br />
policies at the local, state, and<br />
federal level to curb emissions of<br />
carbon dioxide from energy use in<br />
other sectors.<br />
In particular, the United States should prioritize<br />
establishing a comprehensive, national plan to<br />
reduce carbon pollution from all sources – including<br />
transportation, industrial activities, and the<br />
commercial and residential sectors.<br />
Other policies to curb emissions include:<br />
Retrofitting three-quarters of <strong>America’s</strong><br />
homes and businesses for improved energy<br />
efficiency, and implementing strong building<br />
energy codes to dramatically reduce fossil fuel<br />
consumption in new homes and businesses.<br />
Adopting a federal renewable electricity<br />
standard that calls for 25 percent of <strong>America’s</strong><br />
electricity to come from clean, renewable<br />
sources by 2025.<br />
Installing more than 200 gigawatts of solar<br />
panels and other forms of distributed renewable<br />
energy at residential, commercial and<br />
industrial buildings over the next two decades.<br />
Strengthening and implementing state energy<br />
efficiency resource standards that require utilities<br />
to deliver energy efficiency improvements<br />
in homes, businesses and industries.<br />
22 <strong>America’s</strong> <strong>Dirtiest</strong> <strong>Power</strong> <strong>Plants</strong>
Encouraging the use of energy-saving combined<br />
heat-and-power systems in industry.<br />
Setting strong energy efficiency standards for<br />
household appliances and commercial equipment,<br />
and promoting the use of energy-efficient<br />
boilers, process heat systems, and energy-saving<br />
combined heat-and-power in industrial facilities.<br />
Facilitating the deployment of millions of plug-in<br />
vehicles that operate partly or solely on electricity,<br />
and adopting clean fuel standards that require<br />
a reduction in the carbon intensity of transportation<br />
fuels. The U.S. should also adopt strong fuel<br />
economy standards for heavy-duty trucks.<br />
Ensuring that the majority of new residential and<br />
commercial development in metropolitan areas<br />
takes place in compact, walkable communities<br />
with access to a range of transportation options.<br />
Expanding public transportation service to<br />
double ridership by 2030, encouraging further<br />
ridership increases through better transit service,<br />
and reducing per-mile global warming pollution<br />
from transit vehicles. The U.S. should also build<br />
high-speed rail lines in 11 high-priority corridors<br />
by 2030.<br />
Carrying out President Obama’s Executive Order<br />
13514, which requires large reductions in global<br />
warming pollution from federal agencies.<br />
Rejecting proposals to increase our access to<br />
and use of carbon-intensive fuels, including<br />
current proposals to import tar sands oil from<br />
Canada via the Keystone XL pipeline and to<br />
open more land to hydraulic fracturing for shale<br />
oil and natural gas.<br />
Strengthening and expanding the Regional<br />
Greenhouse Gas Initiative, which limits carbon<br />
dioxide pollution from power plants in nine<br />
northeastern states, and implementing California’s<br />
Global Warming Solutions Act (AB32),<br />
which places an economy-wide cap on the<br />
state’s greenhouse gas emissions.<br />
Policy Recommendations 23
Methodology<br />
In this report we examine emissions of carbon dioxide<br />
from all utility and non-utility power plants<br />
within the United States in 2011. We derive emissions<br />
data from fuel consumption figures reported to<br />
the U.S. Department of Energy and estimates of the<br />
carbon content of each fuel source developed by the<br />
U.S. Environmental Protection Agency. Details follow.<br />
We obtained fuel consumption and electricity<br />
generation data for power plants operating in<br />
the United States from the U.S. Department of<br />
Energy’s Energy Information Administration (EIA),<br />
2011 December EIA-923 Monthly Time Series. 93<br />
We focused on fuel consumption for electricity<br />
generation, excluding any fuel consumption for<br />
the purposes of generating heat.<br />
We obtained estimates of the carbon dioxide<br />
emissions created per unit of energy output of the<br />
different fuels used in electricity generation from<br />
the U.S. Environmental Protection Agency, Center<br />
for Climate Leadership, Emission Factors for Greenhouse<br />
Gas Inventories, November 2011; and U.S.<br />
Environmental Protection Agency, Inventory of U.S.<br />
Greenhouse Gas Emissions and Sinks: 1990-2011,<br />
April 2013. Table 3 lists these coefficients. For all<br />
biomass fuels, including wood waste and the<br />
biogenic fraction of municipal solid waste, we<br />
assigned an emissions value of zero, since these<br />
fuels are already part of the non-fossil portion of<br />
the world’s carbon cycle.<br />
We multiplied fuel consumption in terms of<br />
heat content by the appropriate carbon dioxide<br />
emissions factors, yielding an estimate of 2011<br />
carbon dioxide emissions by plant. Using database<br />
tools, we sorted or aggregated the data in various<br />
ways to generate the facts in this report. Our<br />
methodology resulted in a value for 2011 carbon<br />
dioxide pollution from the power sector very<br />
similar to that listed in the EPA’s 2011 greenhouse<br />
gas emissions inventory (see above); our analysis<br />
resulted in a value of 2,202 MMT of carbon<br />
dioxide from all U.S. power plants, while the EPA’s<br />
emissions inventory gave a value of 2,159 MMT of<br />
carbon dioxide emissions from the power sector<br />
– a difference of less than 2 percent. EIA’s 2011<br />
Annual Energy Review lists a value of 2,166 MMT of<br />
carbon dioxide emitted by power plants in 2011. 94<br />
We chose to estimate 2011 carbon dioxide pollution<br />
based on plant-level energy consumption<br />
data because EIA’s Form 923 database (which<br />
contains such data) includes information on a<br />
broader range of power plants than the EPA’s Air<br />
Markets Program Data, which provides estimates<br />
of carbon dioxide emissions for a subset of large<br />
electric power plants. 95<br />
24 <strong>America’s</strong> <strong>Dirtiest</strong> <strong>Power</strong> <strong>Plants</strong>
Table 3: Carbon Dioxide Emission Coefficients<br />
Category<br />
Fuel<br />
Emission Coefficient<br />
(Kg CO2 / MMBtu)<br />
Coal Bituminous 93.40<br />
Coal Lignite 96.36<br />
Coal Sub-Bituminous 97.02<br />
Coal Waste Coal 96 94.38<br />
Coal Coal-Derived Synthesis Gas 97 94.38<br />
Coal Anthracite 103.54<br />
Coal Coal-Based Synfuel 98 92.91<br />
Petroleum Products Distillate Fuel Oil 99 73.15<br />
Petroleum Products Jet Fuel 72.22<br />
Petroleum Products Kerosene 75.20<br />
Petroleum Products Petroleum Coke 102.41<br />
Petroleum Products<br />
Petroleum Coke-Derived<br />
Synthesis Gas 100 102.41<br />
Petroleum Products Residual Fuel Oil 101 78.80<br />
Petroleum Products Propane 61.46<br />
Petroleum Products Waste Oil 102 66.53<br />
Natural Gas and other gases Natural Gas 103 53.02<br />
Natural Gas and other gases Blast Furnace Gas 104 274.32<br />
Natural Gas and other gases Other Fossil-Fuel Gas 105 59.00<br />
Other Purchased Steam 106 88.18<br />
Other Tire-Derived Fuels 107 85.97<br />
Other<br />
Municipal Solid Waste - Non-<br />
Biogenic Fraction<br />
90.70<br />
Methodology 25
Appendices<br />
Table A-1. <strong>Power</strong> Plant Carbon Dioxide Emissions as a Share of Total State-Level Emissions (MMT),<br />
2010 108 State<br />
Electric<br />
<strong>Power</strong><br />
Sector<br />
Emissions<br />
Total<br />
Statewide<br />
Energy-<br />
Related<br />
Emissions<br />
Percentage<br />
of<br />
Statewide<br />
Emissions<br />
from <strong>Power</strong><br />
<strong>Plants</strong><br />
Estimated Share<br />
of Statewide<br />
Emissions<br />
Contributed by Top<br />
5 Emitting <strong>Power</strong><br />
<strong>Plants</strong>±<br />
Total <strong>Power</strong><br />
Sector Emissions<br />
Equivalent<br />
in Number<br />
of Passenger<br />
Vehicles<br />
(Millions) 109<br />
Alabama 76.7 132.7 58% 36% 16.0<br />
Alaska 3.0 38.7 8% 6% 0.6<br />
Arizona 54.4 95.9 57% 46% 11.3<br />
Arkansas 32.3 66.1 49% 45% 6.7<br />
California 43.5 369.8 12% 2% 99.1<br />
Colorado 39.9 96.5 41% 28% 8.3<br />
Connecticut 7.7 36.9 21% 16% 1.6<br />
Delaware 4.2 11.7 36% 36% 0.9<br />
District of Columbia 0.2 3.3 6% 6% 0.0<br />
Florida 119.6 246.0 49% 18% 24.9<br />
Georgia 79.1 173.7 46% 34% 16.5<br />
Hawaii 7.6 18.9 40% 31% 1.6<br />
Idaho 0.7 16.2 4% 4% 0.1<br />
Illinois 94.0 230.4 41% 19% 19.6<br />
Indiana 114.3 219.1 52% 27% 23.8<br />
Iowa 40.6 88.7 46% 34% 8.5<br />
Kansas 35.4 75.0 47% 41% 7.4<br />
Kentucky 94.2 150.7 63% 34% 19.6<br />
Louisiana 42.6 223.5 19% 12% 8.9<br />
Maine 2.6 18.5 14% 11% 0.5<br />
Maryland 24.9 70.5 35% 28% 5.2<br />
Massachusetts 18.2 73.0 25% 16% 3.8<br />
Michigan 70.4 165.9 42% 27% 14.7<br />
Minnesota 29.3 93.4 31% 27% 6.1<br />
Mississippi 26.4 65.5 40% 25% 5.5<br />
Missouri 76.0 135.7 56% 35% 15.8<br />
Montana 19.8 34.9 57% 55% 4.1<br />
Nebraska 23.1 48.0 48% 45% 4.8<br />
26 <strong>America’s</strong> <strong>Dirtiest</strong> <strong>Power</strong> <strong>Plants</strong>
Continued from page 26<br />
Table A-1. <strong>Power</strong> Plant Carbon Dioxide Emissions as a Share of Total State-Level Emissions<br />
(MMT), 2010 108<br />
State<br />
Electric<br />
<strong>Power</strong><br />
Sector<br />
Emissions<br />
Total<br />
Statewide<br />
Energy-<br />
Related<br />
Emissions<br />
Percentage<br />
of<br />
Statewide<br />
Emissions<br />
from <strong>Power</strong><br />
<strong>Plants</strong><br />
Estimated Share<br />
of Statewide<br />
Emissions<br />
Contributed by Top<br />
5 Emitting <strong>Power</strong><br />
<strong>Plants</strong>±<br />
Total <strong>Power</strong><br />
Sector Emissions<br />
Equivalent<br />
in Number<br />
of Passenger<br />
Vehicles<br />
(Millions) 109<br />
Nevada 16.8 38.1 44% 28% 3.5<br />
New Hampshire 5.4 17.0 32% 31% 1.1<br />
New Jersey 17.7 115.4 15% 10% 3.7<br />
New Mexico 29.0 54.8 53% 50% 0.6<br />
New York 38.1 172.8 22% 7% 7.9<br />
North Carolina 72.2 142.9 51% 36% 15<br />
North Dakota 29.5 52.5 56% 52% 6.2<br />
Ohio 120.8 249.1 48% 24% 25.2<br />
Oklahoma 47.4 103.4 46% 32% 9.9<br />
Oregon 9.8 40.3 24% 22% 0.2<br />
Pennsylvania 119.6 256.6 47% 22% 24.9<br />
Rhode Island 3.1 11.0 28% 28% 0.6<br />
South Carolina 40.9 84.0 49% 34% 8.5<br />
South Dakota 3.5 15.1 23% 23% 0.7<br />
Tennessee 43.3 107.1 40% 34% 0.9<br />
Texas 220.4 652.6 34% 10% 45.9<br />
Utah 34.8 64.2 54% 49% 7.2<br />
Vermont 0.0 6.0 0% 0% 0.0<br />
Virginia 34.3 109.8 31% 19% 7.1<br />
Washington 13.1 76.1 17% 15% 2.7<br />
West Virginia 74.3 98.9 75% 52% 15.5<br />
Wisconsin 42.6 99.2 43% 29% 8.9<br />
Wyoming 42.8 64.9 66% 59% 8.9<br />
Total* 2,240.0 5,631.3 40% 24% 466.7<br />
* For the emissions of the United States as a country see, U.S. Energy Information Administration, Monthly Energy Review,<br />
Section 12: Environment, August 2013. Differing methodologies between that data series and the state-by-state data listed<br />
here causes the total for all states to be slightly different from the national-level estimate. The amount varies no more than<br />
0.5 percent. NOTE: The District of Columbia is included in the data tables, but not in the analysis as it is not a state.<br />
± Estimates obtained by multiplying Emissions for Top 5 as a Share of <strong>Power</strong>-Sector Total (2011) by Emissions for <strong>Power</strong>-<br />
Sector as a Share of Statewide Total (2010). U.S. EIA does not have state-by-state data on power-sector emissions from 2011.<br />
See Table A-3.<br />
Appendices 27
Table A-2. The Nation’s 100 Most-Polluting <strong>Power</strong> <strong>Plants</strong>, Carbon Dioxide Emissions Equivalent in<br />
Passenger Vehicles and Primary Fuel Category, 2011<br />
Rank<br />
State<br />
Operator Name<br />
Plant Name<br />
Primary Fuel<br />
Category<br />
Emissions<br />
(Million Metric<br />
Tons) 112<br />
Emissions Equivalent<br />
in Passenger Vehicles<br />
(Millions) 113<br />
1 GA Georgia <strong>Power</strong> Co. Scherer Coal 21.3 4.44<br />
2 AL Alabama <strong>Power</strong> Co. James H. Miller Jr. Coal 20.7 4.3<br />
3 TX Luminant Generation<br />
Company, LLC<br />
Martin Lake Coal 18.8 3.91<br />
4 MO Union Electric Co. (MO) Labadie Coal 18.5 3.85<br />
5 TX NRG Texas <strong>Power</strong>, LLC W. A. Parish Coal 17.8 3.71<br />
6 IN Duke Energy Indiana Inc. Gibson Coal 16.9 3.53<br />
7 OH Ohio <strong>Power</strong> Co. General James M.<br />
Gavin<br />
8 PA FirstEnergy Generation Corp. FirstEnergy Bruce<br />
Mansfield<br />
Coal 16.6 3.46<br />
Coal 16.4 3.41<br />
9 MI Detroit Edison Co. Monroe Coal 16.4 3.41<br />
10 AZ Salt River Project Navajo Coal 15.9 3.32<br />
11 IN Indiana Michigan <strong>Power</strong> Co. Rockport Coal 15.4 3.22<br />
12 KS Westar Energy Inc. Jeffrey Energy<br />
Center<br />
Coal 14.7 3.05<br />
13 GA Georgia <strong>Power</strong> Co. Bowen Coal 14.2 2.97<br />
14 WV Appalachian <strong>Power</strong> Co. John E. Amos Coal 13.9 2.89<br />
15 NM Arizona Public Service Co. Four Corners* Coal 13.8 2.88<br />
16 NC Duke Energy Carolinas, LLC Belews Creek Coal 13.8 2.87<br />
17 TX Luminant Generation<br />
Company, LLC<br />
Monticello Coal 13.7 2.85<br />
18 MT PPL Montana, LLC Colstrip Coal 13.6 2.82<br />
19 TX NRG Texas <strong>Power</strong>, LLC Limestone Coal 13.3 2.77<br />
20 LA Louisiana Generating LLC Big Cajun 2 Coal 13.2 2.75<br />
21 MN Northern States <strong>Power</strong> Co. –<br />
Minnesota<br />
22 SC South Carolina Public Service<br />
Authority<br />
Sherburne<br />
County<br />
Coal 13.1 2.73<br />
Cross Coal 12.9 2.69<br />
23 WY PacifiCorp Jim Bridger Coal 12.9 2.68<br />
24 IL Dynegy Midwest Generation<br />
Inc.<br />
Baldwin Energy<br />
Complex<br />
Coal 12.8 2.67<br />
25 OH Dayton <strong>Power</strong> & Light Co. J. M. Stuart Coal 12.7 2.66<br />
26 KY Kentucky Utilities Co. Ghent Coal 12.7 2.65<br />
27 TN Tennessee Valley Authority Cumberland Coal 12.4 2.57<br />
28 WY Basin Electric <strong>Power</strong> Coop Laramie River<br />
29 UT Los Angeles Department of<br />
Water & <strong>Power</strong><br />
Station<br />
Intermountain<br />
<strong>Power</strong> Project*<br />
Coal 12.2 2.54<br />
Coal 12.0 2.51<br />
30 KY Tennessee Valley Authority Paradise Coal 12.0 2.49<br />
*Indicates that this power plant is scheduled for retirement. 110<br />
28 <strong>America’s</strong> <strong>Dirtiest</strong> <strong>Power</strong> <strong>Plants</strong>
Continued from page 28<br />
Table A-2. The Nation’s 100 Most-Polluting <strong>Power</strong> <strong>Plants</strong>, Carbon Dioxide Emissions Equivalent in<br />
Passenger Vehicles and Primary Fuel Category, 2011<br />
Rank<br />
State<br />
Operator Name<br />
Plant Name<br />
31 IA MidAmerican Energy Co. Walter Scott Jr.<br />
Energy Center*<br />
Primary Fuel<br />
Category<br />
Emissions<br />
(Million Metric<br />
Tons) 112<br />
Emissions Equivalent<br />
in Passenger Vehicles<br />
(Millions) 113<br />
Coal 11.7 2.43<br />
32 NC Progress Energy Carolinas Inc. Roxboro Coal 11.6 2.42<br />
33 NM Public Service Co. of NM San Juan* Coal 11.5 2.4<br />
34 AZ Tucson Electric <strong>Power</strong> Co. Springerville Coal 11.5 2.39<br />
35 AR Entergy Arkansas Inc. Independence Coal 11.1 2.3<br />
36 TX Southwestern Electric <strong>Power</strong><br />
Co.<br />
37 TX Lower Colorado River Authority Fayette <strong>Power</strong><br />
38 TX Oak Grove Management Co.,<br />
LLC<br />
Welsh* Coal 11.0 2.29<br />
Project<br />
39 OH FirstEnergy Generation Corp. FirstEnergy W. H.<br />
40 PA Allegheny Energy Supply Co.,<br />
LLC<br />
41 WV Allegheny Energy Supply Co.,<br />
LLC<br />
Coal 10.9 2.26<br />
Oak Grove Coal 10.8 2.26<br />
Sammis<br />
Hatfields Ferry<br />
<strong>Power</strong> Station*<br />
FirstEnergy<br />
Harrison <strong>Power</strong><br />
Station<br />
Coal 10.6 2.2<br />
Coal 10.5 2.18<br />
Coal 10.4 2.16<br />
42 AR Entergy Arkansas Inc. White Bluff Coal 10.4 2.16<br />
43 AL Alabama <strong>Power</strong> Co. E. C. Gaston Coal 10.3 2.14<br />
44 FL Progress Energy Florida Inc. Crystal River* Coal 10.2 2.13<br />
45 NC Duke Energy Carolinas, LLC Marshall Coal 10.1 2.09<br />
46 IN Indianapolis <strong>Power</strong> & Light Co. AES Petersburg Coal 10.0 2.09<br />
47 PA GenOn Northeast Management<br />
Company<br />
48 PA GenOn Northeast Management<br />
Company<br />
Keystone Coal 10.0 2.08<br />
Conemaugh Coal 9.9 2.06<br />
49 IL Midwest Generations EME, LLC <strong>Power</strong>ton Coal 9.8 2.04<br />
50 NE Nebraska Public <strong>Power</strong> District Gerald Gentleman Coal 9.3 1.94<br />
51 OK Oklahoma Gas & Electric Co. Muskogee Coal 9.2 1.92<br />
52 FL Tampa Electric Co. Big Bend Coal 9.2 1.91<br />
53 KY Louisville Gas & Electric Co. Mill Creek Coal 9.1 1.89<br />
54 PA Midwest Generations EME, LLC Homer City Station Coal 9.0 1.87<br />
55 CO Tri-State G & T Assn., Inc. Craig Coal 9.0 1.87<br />
56 KY East Kentucky <strong>Power</strong> Coop, Inc. H. L. Spurlock Coal 8.9 1.86<br />
57 ND Great River Energy Coal Creek Coal 8.8 1.84<br />
58 NE Omaha Public <strong>Power</strong> District Nebraska City Coal 8.7 1.82<br />
59 PA PPL Brunner Island, LLC PPL Brunner Island Coal 8.6 1.79<br />
60 OK Public Service Co. of Oklahoma Northeastern* Coal 8.6 1.79<br />
*Indicates that this power plant is scheduled for retirement. 110<br />
Appendices 29
Continued from page 29<br />
Table A-2. The Nation’s 100 Most-Polluting <strong>Power</strong> <strong>Plants</strong>, Carbon Dioxide Emissions Equivalent in<br />
Passenger Vehicles and Primary Fuel Category, 2011<br />
Rank<br />
State<br />
Operator Name<br />
Plant Name<br />
Primary Fuel<br />
Category<br />
Emissions<br />
(Million Metric<br />
Tons) 112<br />
Emissions Equivalent<br />
in Passenger Vehicles<br />
(Millions) 113<br />
61 TX Big Brown <strong>Power</strong> Company, LLC Big Brown Coal 8.6 1.79<br />
62 WV Appalachian <strong>Power</strong> Co. Mountaineer Coal 8.5 1.77<br />
63 UT PacifiCorp Hunter Coal 8.4 1.76<br />
64 MO Kansas City <strong>Power</strong> & Light Co. Iatan Coal 8.4 1.75<br />
65 PA PPL Montour, LLC PPL Montour Coal 8.4 1.75<br />
66 WV Ohio <strong>Power</strong> Co. Mitchell Coal 8.4 1.74<br />
67 TX City of San Antonio – (TX) J. K. Spruce Coal 8.3 1.73<br />
68 MO Associated Electric Coop, Inc. Thomas Hill Coal 8.3 1.73<br />
69 KS Kansas City <strong>Power</strong> & Light Co La Cygne Coal 8.2 1.71<br />
70 WV Virginia Electric & <strong>Power</strong> Co. Mt. Storm Coal 8.2 1.7<br />
71 MI Consumers Energy Co. J. H. Campbell Coal 8.2 1.7<br />
72 IN Northern Indiana Pub Serv Co. R. M. Schahfer Coal 8.1 1.7<br />
73 IN Indiana-Kentucky Electric Corp. Clifty Creek Coal 8.1 1.69<br />
74 MI Detroit Edison Co. Belle River Coal 7.9 1.65<br />
75 FL Florida <strong>Power</strong> & Light Co. West County Energy<br />
Center<br />
Natural Gas and<br />
other gases<br />
7.9 1.64<br />
76 FL Seminole Electric Cooperative Inc. Seminole Coal 7.9 1.64<br />
77 MO Union Electric Co. – (MO) Rush Island Coal 7.9 1.64<br />
78 WV Allegheny Energy Supply Co., LLC FirstEnergy Pleasants<br />
<strong>Power</strong> Station<br />
Coal 7.8 1.63<br />
79 KY Tennessee Valley Authority Shawnee Coal 7.8 1.62<br />
80 IL Electric Energy Inc. Joppa Steam Coal 7.8 1.62<br />
81 OH Cardinal Operating Co. Cardinal Coal 7.6 1.58<br />
82 TX Southwestern Public Service Co. Tolk Coal 7.5 1.57<br />
83 IL Ameren Energy Generating Co. Newton Coal 7.5 1.55<br />
84 MN Minnesota <strong>Power</strong> Inc. Clay Boswell Coal 7.4 1.55<br />
85 AZ Arizona Public Service Co. Cholla Coal 7.4 1.55<br />
86 AL Alabama <strong>Power</strong> Co. Barry Natural Gas and<br />
other gases<br />
7.3 1.53<br />
87 TN Tennessee Valley Authority Gallatin Coal 7.3 1.51<br />
88 WI Wisconsin <strong>Power</strong> & Light Co. Columbia Coal 7.2 1.51<br />
89 CO Public Service Co. of Colorado Comanche Coal 7.2 1.5<br />
90 GA Georgia <strong>Power</strong> Co. Wansley Coal 7.2 1.5<br />
91 OK Grand River Dam Authority GRDA Coal 7.2 1.49<br />
92 OH Duke Energy Ohio Inc. Miami Fort* Coal 7.2 1.49<br />
93 MO Associated Electric Coop, Inc. New Madrid Coal 7.1 1.48<br />
94 OH Ohio <strong>Power</strong> Co. Conesville* Coal 7.1 1.47<br />
*Indicates that this power plant is scheduled for retirement. 110<br />
30 <strong>America’s</strong> <strong>Dirtiest</strong> <strong>Power</strong> <strong>Plants</strong>
Continued from page 30<br />
Table A-2. The Nation’s 100 Most-Polluting <strong>Power</strong> <strong>Plants</strong>, Carbon Dioxide Emissions Equivalent in<br />
Passenger Vehicles and Primary Fuel Category, 2011<br />
Rank<br />
State<br />
Operator Name<br />
Plant Name<br />
Primary Fuel<br />
Category<br />
Emissions<br />
(Million Metric<br />
Tons) 112<br />
Emissions Equivalent<br />
in Passenger Vehicles<br />
(Millions) 113<br />
95 LA Entergy Gulf States – LA, LLC R. S. Nelson Coal 7.0 1.46<br />
96 LA Cleco <strong>Power</strong>, LLC Brame Energy<br />
Center<br />
Coal 7.0 1.46<br />
97 OK Oklahoma Gas & Electric Co. Sooner Coal 7.0 1.45<br />
98 KY Louisville Gas & Electric Co. Trimble County Coal 6.9 1.45<br />
99 WV Monongahela <strong>Power</strong> Co. FirstEnergy Fort<br />
Martin <strong>Power</strong> Station<br />
Coal 6.8 1.42<br />
100 IN Hoosier Energy R E C, Inc. Merom Coal 6.7 1.39<br />
*Indicates that this power plant is scheduled for retirement. 110<br />
Appendices 31
Table A-3. The Share of Each State’s Electricity-Sector Carbon Dioxide Pollution Contributed by the Top 5 Most-Polluting <strong>Power</strong> <strong>Plants</strong><br />
State Rank Plant Name Operator Name<br />
Emissions<br />
(Millon<br />
Metric tons<br />
of CO2)<br />
Total<br />
Emissions of<br />
Top 5 <strong>Plants</strong><br />
(MMT of CO2)<br />
Emissions<br />
for Top 5 as<br />
a Share of<br />
<strong>Power</strong>-Sector<br />
Total (2011)<br />
Emissions for<br />
<strong>Power</strong>-Sector<br />
as a Share of<br />
Statewide<br />
Total (2010)<br />
Estimated<br />
Share of<br />
Statewide<br />
Emissions<br />
Contributed by<br />
Top 5±<br />
AK 1 Beluga Chugach Electric Assn. Inc. 1.27<br />
2 George M Sullivan Generation Plant 2 Anchorage Municipal Light and <strong>Power</strong> 0.61<br />
3 Aurora Energy, LLC Chena Aurora Energy, LLC 0.34<br />
2.8 75% 8% 6%<br />
4 North Pole Golden Valley Elec. Assn. Inc. 0.30<br />
5 Healy Golden Valley Elec. Assn. Inc. 0.23<br />
AL 1 James H Miller Jr. Alabama <strong>Power</strong> Co. 20.66<br />
2 E. C. Gaston Alabama <strong>Power</strong> Co. 10.29<br />
3 Barry Alabama <strong>Power</strong> Co. 7.33<br />
48.1 63% 58% 36%<br />
4 Widows Creek* Tennessee Valley Authority 5.06<br />
5 Colbert Tennessee Valley Authority 4.75<br />
AR 1 Independence Entergy Arkansas Inc. 11.06<br />
2 White Bluff Entergy Arkansas Inc. 10.36<br />
3 Plum Point Energy Station Plum Point Energy Associates, LLC 4.00<br />
32.0 92% 49% 45%<br />
4 Flint Creek Southwestern Electric <strong>Power</strong> Co. 3.77<br />
5 Union <strong>Power</strong> Partners, L.P. Union <strong>Power</strong> Partners, L.P. 2.79<br />
AZ 1 Navajo Salt River Project 15.92<br />
2 Springerville Tucson Electric <strong>Power</strong> Co. 11.45<br />
3 Cholla Arizona Public Service Co. 7.45<br />
43.0 81% 57% 46%<br />
4 Coronado Salt River Project 5.66<br />
5 Mesquite Generating Station Mesquite <strong>Power</strong>, LLC 2.50<br />
CA 1 Mountainview Generating Station Southern California Edison Co. 1.85<br />
2 Delta Energy Center Delta Energy Center, LLC 1.64<br />
3 Haynes Los Angeles Department of Water & <strong>Power</strong> 1.49<br />
7.5 19% 12% 2%<br />
4 Cosumnes Sacramento Municipal Util. Dist. 1.26<br />
5 Elk Hills <strong>Power</strong>, LLC Elk Hills <strong>Power</strong>, LLC 1.23<br />
*Indicates that this power plant is scheduled for retirement. 113<br />
± Obtained by multiplying Emissions for Top 5 as a Share of <strong>Power</strong>-Sector Total (2011) by Emissions for <strong>Power</strong>-Sector as a Share of Statewide Total (2010) U.S. EIA does not have state-by-state data for<br />
power-sector emissions for 2011.<br />
32 <strong>America’s</strong> <strong>Dirtiest</strong> <strong>Power</strong> <strong>Plants</strong>
Continued from page 32<br />
Table A-3. The Share of Each State’s Electricity-Sector Carbon Dioxide Pollution Contributed by the Top 5 Most-Polluting <strong>Power</strong> <strong>Plants</strong><br />
State Rank Plant Name Operator Name<br />
Emissions<br />
(Millon<br />
Metric tons<br />
of CO2)<br />
Total<br />
Emissions of<br />
Top 5 <strong>Plants</strong><br />
(MMT of CO2)<br />
Emissions<br />
for Top 5 as<br />
a Share of<br />
<strong>Power</strong>-Sector<br />
Total (2011)<br />
Emissions for<br />
<strong>Power</strong>-Sector<br />
as a Share of<br />
Statewide<br />
Total (2010)<br />
Estimated<br />
Share of<br />
Statewide<br />
Emissions<br />
Contributed by<br />
Top 5±<br />
CO 1 Craig Tri-State G & T Assn., Inc. 8.96 26.2 67% 41% 28%<br />
2 Comanche Public Service Co. of Colorado 7.21<br />
3 Cherokee* Public Service Co. of Colorado 4.01<br />
4 Pawnee Public Service Co. of Colorado 3.05<br />
5 Hayden Public Service Co. of Colorado 2.98<br />
CT 1 Lake Road Generating Plant Lake Road Generating Co., L.P. 2.07 5.9 75% 21% 16%<br />
2 Milford <strong>Power</strong> Project Milford <strong>Power</strong> Co., LLC 1.54<br />
3 Bridgeport Energy Project Bridgeport Energy, LLC 1.08<br />
4 Kleen Energy Systems Project Kleen Energy Systems, LLC 0.70<br />
5 Bridgeport Station PSEG <strong>Power</strong> Connecticut, LLC 0.53<br />
DC 1 Benning Potomac <strong>Power</strong> Resources 0.11 0.2 100% 6% 6%<br />
2 US GSA Heating and Transmission US GSA Heating and Transmission 0.05<br />
3 Buzzard Point Potomac <strong>Power</strong> Resources 0.01<br />
DE 1 Hay Road Calpine Mid-Atlantic Generation, LLC 1.70 3.9 99% 36% 36%<br />
2 Indian River Generating Station* Indian River Operations Inc. 1.57<br />
3 Edge Moor* Calpine Mid-Atlantic Generation, LLC 0.37<br />
4 Delaware City Plant Delaware City Refining Company, LLC 0.18<br />
5 NRG Energy Center Dover NRG Energy Center Dover, LLC 0.11<br />
FL 1 Crystal River* Progress Energy Florida Inc. 10.24 41.7 37% 49% 18%<br />
2 Big Bend Tampa Electric Co. 9.18<br />
3 West County Energy Center Florida <strong>Power</strong> & Light Co. 7.89<br />
4 Seminole Seminole Electric Cooperative Inc. 7.88<br />
5 St. Johns River <strong>Power</strong> Park JEA 6.55<br />
GA 1 Scherer Georgia <strong>Power</strong> Co. 21.32 52.1 76% 46% 34%<br />
2 Bowen Georgia <strong>Power</strong> Co. 14.24<br />
3 Wansley Georgia <strong>Power</strong> Co. 7.19<br />
4 Harllee Branch* Georgia <strong>Power</strong> Co. 5.15<br />
5 Yates* Georgia <strong>Power</strong> Co. 4.16<br />
*Indicates that this power plant is scheduled for retirement. 113<br />
± Obtained by multiplying Emissions for Top 5 as a Share of <strong>Power</strong>-Sector Total (2011) by Emissions for <strong>Power</strong>-Sector as a Share of Statewide Total (2010) U.S. EIA does not have state-by-state data for<br />
power-sector emissions for 2011.<br />
Appendices 33
Continued from page 33<br />
Table A-3. The Share of Each State’s Electricity-Sector Carbon Dioxide Pollution Contributed by the Top 5 Most-Polluting <strong>Power</strong> <strong>Plants</strong><br />
State Rank Plant Name Operator Name<br />
Emissions<br />
(Millon<br />
Metric tons<br />
of CO2)<br />
Total<br />
Emissions of<br />
Top 5 <strong>Plants</strong><br />
(MMT of CO2)<br />
Emissions<br />
for Top 5 as<br />
a Share of<br />
<strong>Power</strong>-Sector<br />
Total (2011)<br />
Emissions for<br />
<strong>Power</strong>-Sector<br />
as a Share of<br />
Statewide<br />
Total (2010)<br />
Estimated<br />
Share of<br />
Statewide<br />
Emissions<br />
Contributed by<br />
Top 5±<br />
HI 1 Kahe Hawaiian Electric Co. Inc. 2.41 5.6 77% 40% 31%<br />
2 AES Hawaii AES Hawaii Inc. 1.31<br />
3 Waiau Hawaiian Electric Co. Inc. 0.87<br />
4 Maalaea Maui Electric Co. Ltd. 0.55<br />
5 Kalaeola Cogen Plant Kalaeloa Partners, L.P. 0.51<br />
IA 1 Walter Scott Jr. Energy Center* MidAmerican Energy Co. 11.67 29.7 75% 46% 34%<br />
2 George Neal North MidAmerican Energy Co. 5.76<br />
3 George Neal South MidAmerican Energy Co. 4.32<br />
4 Louisa MidAmerican Energy Co. 4.30<br />
5 Ottumwa Interstate <strong>Power</strong> and Light Co. 3.65<br />
ID 1 Rathdrum <strong>Power</strong>, LLC Rathdrum Operating Services Co., Inc. 0.31 0.4 91% 4% 4%<br />
2 Evander Andrews <strong>Power</strong> Complex Idaho <strong>Power</strong> Co. 0.05<br />
3 Bennett Mountain Idaho <strong>Power</strong> Co. 0.03<br />
4 Rupert Cogen Project Energy Operations Group 0.03<br />
5 Clearwater Paper IPP Lewiston Clearwater Paper Corporation 0.02<br />
IL 1 Baldwin Energy Complex Dynegy Midwest Generation Inc. 12.83 44.0 46% 41% 19%<br />
2 <strong>Power</strong>ton Midwest Generations EME, LLC 9.80<br />
3 Joppa Steam Electric Energy Inc. 7.76<br />
4 Newton Ameren Energy Generating Co. 7.46<br />
5 Joliet 29 Midwest Generations EME, LLC 6.12<br />
IN 1 Gibson Duke Energy Indiana Inc. 16.95 58.7 52% 52% 27%<br />
2 Rockport Indiana Michigan <strong>Power</strong> Co. 15.44<br />
3 AES Petersburg Indianapolis <strong>Power</strong> & Light Co. 10.05<br />
4 R. M. Schahfer Northern Indiana Pub Serv Co. 8.14<br />
*Indicates that 5 this power Clifty plant Creek is scheduled for retirement. 113<br />
Indiana-Kentucky Electric Corp. 8.09<br />
± Obtained by multiplying Emissions for Top 5 as a Share of <strong>Power</strong>-Sector Total (2011) by Emissions for <strong>Power</strong>-Sector as a Share of Statewide Total (2010) U.S. EIA does not have state-by-state data for<br />
power-sector emissions for 2011.<br />
34 <strong>America’s</strong> <strong>Dirtiest</strong> <strong>Power</strong> <strong>Plants</strong>
Continued from page 34<br />
Table A-3. The Share of Each State’s Electricity-Sector Carbon Dioxide Pollution Contributed by the Top 5 Most-Polluting <strong>Power</strong> <strong>Plants</strong><br />
State Rank Plant Name Operator Name<br />
Emissions<br />
(Millon<br />
Metric tons<br />
of CO2)<br />
Total<br />
Emissions of<br />
Top 5 <strong>Plants</strong><br />
(MMT of CO2)<br />
Emissions<br />
for Top 5 as<br />
a Share of<br />
<strong>Power</strong>-Sector<br />
Total (2011)<br />
Emissions for<br />
<strong>Power</strong>-Sector<br />
as a Share of<br />
Statewide<br />
Total (2010)<br />
Estimated<br />
Share of<br />
Statewide<br />
Emissions<br />
Contributed by<br />
Top 5±<br />
KS 1 Jeffrey Energy Center Westar Energy Inc. 14.66 30.8 88% 47% 41%<br />
2 La Cygne Kansas City <strong>Power</strong> & Light Co. 8.22<br />
3 Lawrence Energy Center Westar Energy Inc. 3.69<br />
4 Holcomb Sunflower Electric <strong>Power</strong> Corp. 2.76<br />
5 Nearman Creek City of Kansas City – (KS) 1.50<br />
KY 1 Ghent Kentucky Utilities Co. 12.72 50.4 54% 63% 34%<br />
2 Paradise Tennessee Valley Authority 11.96<br />
3 Mill Creek Louisville Gas & Electric Co. 9.05<br />
4 H. L. Spurlock East Kentucky <strong>Power</strong> Coop, Inc. 8.91<br />
5 Shawnee Tennessee Valley Authority 7.80<br />
LA 1 Big Cajun 2 Louisiana Generating, LLC 13.22 35.0 61% 19% 12%<br />
2 R. S. Nelson Entergy Gulf States – LA, LLC 7.01<br />
3 Brame Energy Center Cleco <strong>Power</strong>, LLC 7.01<br />
4 Dolet Hills Cleco <strong>Power</strong>, LLC 5.14<br />
5 Nine Mile Point Entergy Louisiana Inc. 2.62<br />
MA 1 Mystic Generating Station Constellation Mystic <strong>Power</strong>, LLC 3.64 10.5 66% 25% 16%<br />
2 Brayton Point Dominion Energy New England, LLC 3.26<br />
3 Fore River Generating Station Constellation Mystic <strong>Power</strong>, LLC 1.86<br />
4 Millennium <strong>Power</strong> Millennium <strong>Power</strong> Partners, L.P. 0.92<br />
5 ANP Blackstone Energy Project ANP Blackstone Energy Company, LLC 0.82<br />
MD 1 Brandon Shores Raven <strong>Power</strong> Holdings, LLC 6.02 18.6 80% 35% 28%<br />
2 Morgantown Generating Plant GenOn Mid-Atlantic, LLC 5.84<br />
3 Chalk Point, LLC GenOn Chalk Point, LLC 3.79<br />
4 Herbert A. Wagner Raven <strong>Power</strong> Holdings, LLC 1.54<br />
5 Dickerson GenOn Mid-Atlantic, LLC 1.37<br />
*Indicates that this power plant is scheduled for retirement. 113<br />
± Obtained by multiplying Emissions for Top 5 as a Share of <strong>Power</strong>-Sector Total (2011) by Emissions for <strong>Power</strong>-Sector as a Share of Statewide Total (2010) U.S. EIA does not have state-by-state data for<br />
power-sector emissions for 2011.<br />
Appendices 35
Continued from page 35<br />
Table A-3. The Share of Each State’s Electricity-Sector Carbon Dioxide Pollution Contributed by the Top 5 Most-Polluting <strong>Power</strong> <strong>Plants</strong><br />
State Rank Plant Name Operator Name<br />
Emissions<br />
(Millon<br />
Metric tons<br />
of CO2)<br />
Total<br />
Emissions of<br />
Top 5 <strong>Plants</strong><br />
(MMT of CO2)<br />
Emissions<br />
for Top 5 as<br />
a Share of<br />
<strong>Power</strong>-Sector<br />
Total (2011)<br />
Emissions for<br />
<strong>Power</strong>-Sector<br />
as a Share of<br />
Statewide<br />
Total (2010)<br />
Estimated<br />
Share of<br />
Statewide<br />
Emissions<br />
Contributed by<br />
Top 5±<br />
ME 1 Westbrook Energy Center <strong>Power</strong> Plant Westbrook Energy Center 1.01 2.8 82% 14% 11%<br />
2 Verso Paper Verso Bucksport, LLC 0.73<br />
3 Maine Independence Station Casco Bay Energy Co., LLC 0.69<br />
4 Rumford <strong>Power</strong> Associates Rumford <strong>Power</strong> 0.17<br />
5 Androscoggin Energy Center Verso Paper Androscoggin, LLC 0.15<br />
MI 1 Monroe Detroit Edison Co. 16.39 42.8 64% 42% 27%<br />
2 J. H. Campbell Consumers Energy Co. 8.16<br />
3 Belle River Detroit Edison Co. 7.91<br />
4 St. Clair Detroit Edison Co. 6.54<br />
5 Trenton Channel Detroit Edison Co. 3.76<br />
MN 1 Sherburne County Northern States <strong>Power</strong> Co. – Minnesota 13.11 26.3 85% 31% 27%<br />
2 Clay Boswell Minnesota <strong>Power</strong> Inc. 7.45<br />
3 Allen S. King Northern States <strong>Power</strong> Co. – Minnesota 3.18<br />
4 Black Dog* Northern States <strong>Power</strong> Co. – Minnesota 1.39<br />
5 Taconite Harbor Energy Center Minnesota <strong>Power</strong> Inc. 1.20<br />
MO 1 Labadie Union Electric Co. – (MO) 18.50 50.1 62% 56% 35%<br />
2 Iatan Kansas City <strong>Power</strong> & Light Co. 8.41<br />
3 Thomas Hill Associated Electric Coop, Inc. 8.29<br />
4 Rush Island Union Electric Co. – (MO) 7.85<br />
5 New Madrid Associated Electric Coop, Inc. 7.09<br />
MS 1 Victor J. Daniel Jr. Mississippi <strong>Power</strong> Co. 5.28 14.1 61% 40% 25%<br />
2 Red Hills Generating Facility Choctaw Generating, L.P. 2.74<br />
3 Jack Watson Mississippi <strong>Power</strong> Co. 2.73<br />
4 Baxter Wilson Entergy Mississippi Inc. 1.76<br />
5 R. D. Morrow South Mississippi El Pwr. Assn. 1.55<br />
*Indicates that this power plant is scheduled for retirement. 113<br />
± Obtained by multiplying Emissions for Top 5 as a Share of <strong>Power</strong>-Sector Total (2011) by Emissions for <strong>Power</strong>-Sector as a Share of Statewide Total (2010) U.S. EIA does not have state-by-state data for<br />
power-sector emissions for 2011.<br />
36 <strong>America’s</strong> <strong>Dirtiest</strong> <strong>Power</strong> <strong>Plants</strong>
Continued from page 36<br />
Table A-3. The Share of Each State’s Electricity-Sector Carbon Dioxide Pollution Contributed by the Top 5 Most-Polluting <strong>Power</strong> <strong>Plants</strong><br />
State Rank Plant Name Operator Name<br />
Emissions<br />
(Millon<br />
Metric tons<br />
of CO2)<br />
Total<br />
Emissions of<br />
Top 5 <strong>Plants</strong><br />
(MMT of CO2)<br />
Emissions<br />
for Top 5 as<br />
a Share of<br />
<strong>Power</strong>-Sector<br />
Total (2011)<br />
Emissions for<br />
<strong>Power</strong>-Sector<br />
as a Share of<br />
Statewide<br />
Total (2010)<br />
Estimated<br />
Share of<br />
Statewide<br />
Emissions<br />
Contributed by<br />
Top 5±<br />
MT 1 Colstrip PPL Montana, LLC 13.55 16.1 96% 57% 55%<br />
2 J. E. Corette Plant PPL Montana, LLC 0.90<br />
3 Hardin Generator Project Rocky Mountain <strong>Power</strong> Inc. 0.77<br />
4 Yellowstone Energy, L.P. Yellowstone Energy, L.P. 0.50<br />
5 Lewis & Clark Montana-Dakota Utilities Co. 0.37<br />
NC 1 Belews Creek Duke Energy Carolinas, LLC 13.76 43.0 71% 51% 36%<br />
2 Roxboro Progress Energy Carolinas Inc. 11.60<br />
3 Marshall Duke Energy Carolinas, LLC 10.05<br />
4 G. G. Allen Duke Energy Carolinas, LLC 4.00<br />
5 Mayo Progress Energy Carolinas Inc. 3.56<br />
ND 1 Coal Creek Great River Energy 8.82 27.1 93% 56% 52%<br />
2 Antelope Valley Basin Electric <strong>Power</strong> Coop 5.79<br />
3 Milton R. Young Minnkota <strong>Power</strong> Coop, Inc 5.56<br />
4 Leland Olds Basin Electric <strong>Power</strong> Coop 3.60<br />
5 Coyote Otter Tail <strong>Power</strong> Co. 3.29<br />
NE 1 Gerald Gentleman Nebraska Public <strong>Power</strong> District 9.29 24.7 93% 48% 45%<br />
2 Nebraska City Omaha Public <strong>Power</strong> District 8.75<br />
3 North Omaha Omaha Public <strong>Power</strong> District 3.58<br />
4 Sheldon Nebraska Public <strong>Power</strong> District 1.58<br />
5 Whelan Energy Center City of Hasting – (NE) 1.53<br />
NH 1 Merrimack Public Service Co. of NH 2.00 4.9 97% 32% 31%<br />
2 Granite Ridge Granite Ridge Energy, LLC 1.47<br />
3 EP Newington Energy, LLC EP Newington Energy, LLC 1.05<br />
4 Schiller Public Service Co. of NH 0.30<br />
5 Newington Public Service Co. of NH 0.11<br />
*Indicates that this power plant is scheduled for retirement. 113<br />
± Obtained by multiplying Emissions for Top 5 as a Share of <strong>Power</strong>-Sector Total (2011) by Emissions for <strong>Power</strong>-Sector as a Share of Statewide Total (2010) U.S. EIA does not have state-by-state data for<br />
power-sector emissions for 2011.<br />
Appendices 37
Continued from page 37<br />
Table A-3. The Share of Each State’s Electricity-Sector Carbon Dioxide Pollution Contributed by the Top 5 Most-Polluting <strong>Power</strong> <strong>Plants</strong><br />
State Rank Plant Name Operator Name<br />
Emissions<br />
(Millon<br />
Metric tons<br />
of CO2)<br />
Total<br />
Emissions of<br />
Top 5 <strong>Plants</strong><br />
(MMT of CO2)<br />
Emissions<br />
for Top 5 as<br />
a Share of<br />
<strong>Power</strong>-Sector<br />
Total (2011)<br />
Emissions for<br />
<strong>Power</strong>-Sector<br />
as a Share of<br />
Statewide<br />
Total (2010)<br />
Estimated<br />
Share of<br />
Statewide<br />
Emissions<br />
Contributed by<br />
Top 5±<br />
NJ 1 Bergen Generating Station PSEG Fossil, LLC 2.46 9.9 64% 15% 10%<br />
2 PSEG Linden Generating Station PSEG Fossil, LLC 2.13<br />
3 Red Oak <strong>Power</strong>, LLC Red Oak <strong>Power</strong>, LLC 1.93<br />
4 PSEG Hudson Generating Station PSEG Fossil, LLC 1.76<br />
5 Linden Cogen Plant Cogen Technologies Linden Vent 1.60<br />
NM 1 Four Corners* Arizona Public Service Co. 13.85 29.1 94% 53% 50%<br />
2 San Juan* Public Service Co. of NM 11.52<br />
3 Escalante Tri-State G & T Assn., Inc. 1.78<br />
4 Hobbs Generating Station CAMS NM, LLC 1.24<br />
5 Luna Energy Facility Public Service Co. of NM 0.70<br />
NV 1 Reid Gardner* Nevada <strong>Power</strong> Co. 2.48 9.3 64% 44% 28%<br />
2 Chuck Lenzie Generating Station Nevada <strong>Power</strong> Co. 2.30<br />
3 North Valmy Sierra Pacific <strong>Power</strong> Co. 1.98<br />
4 Tracy Sierra Pacific <strong>Power</strong> Co. 1.29<br />
5 TS <strong>Power</strong> Plant* Newmont Nevada Energy Investment, LLC 1.28<br />
NY 1 AES Somerset, LLC AES Somerset, LLC 3.51 11.0 32% 22% 7%<br />
2 Northport National Grid Generation, LLC 2.06<br />
3 Dunkirk Generating Plant Dunkirk <strong>Power</strong>, LLC 2.05<br />
4 Ravenswood TC Ravenswood, LLC 1.74<br />
5 East River Consolidated Edison Co. NY Inc. 1.68<br />
OH 1 General James M. Gavin Ohio <strong>Power</strong> Co. 16.59 54.7 50% 48% 24%<br />
2 J. M. Stuart Dayton <strong>Power</strong> & Light Co. 12.75<br />
3 FirstEnergy W. H. Sammis FirstEnergy Generation Corp. 10.55<br />
4 Cardinal Cardinal Operating Co. 7.60<br />
5 Miami Fort* Duke Energy Ohio Inc. 7.15<br />
*Indicates that this power plant is scheduled for retirement. 113<br />
± Obtained by multiplying Emissions for Top 5 as a Share of <strong>Power</strong>-Sector Total (2011) by Emissions for <strong>Power</strong>-Sector as a Share of Statewide Total (2010) U.S. EIA does not have state-by-state data for<br />
power-sector emissions for 2011.<br />
38 <strong>America’s</strong> <strong>Dirtiest</strong> <strong>Power</strong> <strong>Plants</strong>
Continued from page 38<br />
Table A-3. The Share of Each State’s Electricity-Sector Carbon Dioxide Pollution Contributed by the Top 5 Most-Polluting <strong>Power</strong> <strong>Plants</strong><br />
State Rank Plant Name Operator Name<br />
Emissions<br />
(Millon<br />
Metric tons<br />
of CO2)<br />
Total<br />
Emissions of<br />
Top 5 <strong>Plants</strong><br />
(MMT of CO2)<br />
Emissions<br />
for Top 5 as<br />
a Share of<br />
<strong>Power</strong>-Sector<br />
Total (2011)<br />
Emissions for<br />
<strong>Power</strong>-Sector<br />
as a Share of<br />
Statewide<br />
Total (2010)<br />
Estimated<br />
Share of<br />
Statewide<br />
Emissions<br />
Contributed by<br />
Top 5±<br />
OK 1 Muskogee Oklahoma Gas & Electric Co. 9.20 35.0 69% 46% 32%<br />
2 Northeastern* Public Service Co. of Oklahoma 8.60<br />
3 GRDA Grand River Dam Authority 7.17<br />
4 Sooner Oklahoma Gas & Electric Co. 6.96<br />
5 Hugo Western Farmers Elec Coop, Inc. 3.06<br />
OR 1 Boardman* Portland General Electric Co. 3.24 5.9 89% 24% 22%<br />
2 Hermiston Generating Plant Hermiston Generating Co., L.P. 0.92<br />
3 Klamath Cogeneration Plant Pacific Klamath Energy Inc. 0.74<br />
4 Port Westward Portland General Electric Co. 0.51<br />
5 Hermiston <strong>Power</strong> Partnership Hermiston <strong>Power</strong> Partnership 0.45<br />
PA 1 FirstEnergy Bruce Mansfield FirstEnergy Generation Corp. 16.39 55.7 48% 47% 22%<br />
2 Hatfields Ferry <strong>Power</strong> Station* Allegheny Energy Supply Co., LLC 10.46<br />
3 Keystone GenOn Northeast Management Company 10.00<br />
4 Conemaugh GenOn Northeast Management Company 9.88<br />
5 Homer City Station Midwest Generations EME, LLC 8.97<br />
RI 1 Entergy Rhode Island State Energy, L.P. Entergy RISE 1.17 3.5 99% 28% 28%<br />
2 Manchester Street Dominion Energy New England, LLC 1.01<br />
3 Tiverton <strong>Power</strong> Plant Tiverton <strong>Power</strong> Inc. 0.61<br />
4 Ocean State <strong>Power</strong> II Ocean State <strong>Power</strong> II 0.35<br />
5 Ocean State <strong>Power</strong> Ocean State <strong>Power</strong> Co. 0.32<br />
SC 1 Cross South Carolina Public Service Authority 12.89 26.3 70% 49% 34%<br />
2 Winyah South Carolina Public Service Authority 5.03<br />
3 Wateree South Carolina Electric & Gas Co. 3.76<br />
4 Williams South Carolina Genertg Co, Inc. 2.46<br />
5 Jasper South Carolina Electric & Gas Co. 2.16<br />
*Indicates that this power plant is scheduled for retirement. 113<br />
± Obtained by multiplying Emissions for Top 5 as a Share of <strong>Power</strong>-Sector Total (2011) by Emissions for <strong>Power</strong>-Sector as a Share of Statewide Total (2010) U.S. EIA does not have state-by-state data for<br />
power-sector emissions for 2011.<br />
Appendices 39
Continued from page 39<br />
Table A-3. The Share of Each State’s Electricity-Sector Carbon Dioxide Pollution Contributed by the Top 5 Most-Polluting <strong>Power</strong> <strong>Plants</strong><br />
State Rank Plant Name Operator Name<br />
Emissions<br />
(Millon<br />
Metric tons<br />
of CO2)<br />
Total<br />
Emissions of<br />
Top 5 <strong>Plants</strong><br />
(MMT of CO2)<br />
Emissions<br />
for Top 5 as<br />
a Share of<br />
<strong>Power</strong>-Sector<br />
Total (2011)<br />
Emissions for<br />
<strong>Power</strong>-Sector<br />
as a Share of<br />
Statewide<br />
Total (2010)<br />
Estimated<br />
Share of<br />
Statewide<br />
Emissions<br />
Contributed by<br />
Top 5±<br />
SD 1 Big Stone Otter Tail <strong>Power</strong> Co. 2.63 2.9 100% 23% 23%<br />
2 Ben French* Black Hills <strong>Power</strong> Inc. 0.19<br />
3 Groton Generating Station Basin Electric <strong>Power</strong> Coop 0.04<br />
4 Angus Anson Northern States <strong>Power</strong> Co. – Minnesota 0.04<br />
5 Lange Gas Turbines Black Hills <strong>Power</strong> Inc. 0.00<br />
TN 1 Cumberland Tennessee Valley Authority 12.36 34.4 83% 40% 34%<br />
2 Gallatin Tennessee Valley Authority 7.25<br />
3 Johnsonville* Tennessee Valley Authority 5.49<br />
4 Allen Steam Plant Tennessee Valley Authority 4.73<br />
5 Kingston Tennessee Valley Authority 4.59<br />
TX 1 Martin Lake Luminant Generation Company, LLC 18.76 74.6 30% 34% 10%<br />
2 W. A. Parish NRG Texas <strong>Power</strong>, LLC 17.81<br />
3 Monticello Luminant Generation Company, LLC 13.69<br />
4 Limestone NRG Texas <strong>Power</strong>, LLC 13.30<br />
5 Welsh* Southwestern Electric <strong>Power</strong> Co. 11.01<br />
UT 1 Intermountain <strong>Power</strong> Project* Los Angeles Department of Water & <strong>Power</strong> 12.05 30.6 90% 54% 49%<br />
2 Hunter PacifiCorp 8.43<br />
3 Huntington PacifiCorp 5.54<br />
4 Bonanza Deseret Generation & Tran Coop 3.22<br />
5 Carbon* PacifiCorp 1.38<br />
VA 1 Chesterfield Virginia Electric & <strong>Power</strong> Co. 6.11 16.8 60% 31% 19%<br />
2 Clover Virginia Electric & <strong>Power</strong> Co. 4.92<br />
3 Chesapeake* Virginia Electric & <strong>Power</strong> Co. 2.73<br />
4 Tenaska Virginia Generating Station Tenaska Virginia Partners, L.P. 1.73<br />
5 Clinch River* Appalachian <strong>Power</strong> Co. 1.32<br />
*Indicates that this power plant is scheduled for retirement. 113<br />
± Obtained by multiplying Emissions for Top 5 as a Share of <strong>Power</strong>-Sector Total (2011) by Emissions for <strong>Power</strong>-Sector as a Share of Statewide Total (2010) U.S. EIA does not have state-by-state data for<br />
power-sector emissions for 2011.<br />
40 <strong>America’s</strong> <strong>Dirtiest</strong> <strong>Power</strong> <strong>Plants</strong>
Continued from page 40<br />
Table A-3. The Share of Each State’s Electricity-Sector Carbon Dioxide Pollution Contributed by the Top 5 Most-Polluting <strong>Power</strong> <strong>Plants</strong><br />
State Rank Plant Name Operator Name<br />
Emissions<br />
(Millon<br />
Metric tons<br />
of CO2)<br />
Total<br />
Emissions of<br />
Top 5 <strong>Plants</strong><br />
(MMT of CO2)<br />
Emissions<br />
for Top 5 as<br />
a Share of<br />
<strong>Power</strong>-Sector<br />
Total (2011)<br />
Emissions for<br />
<strong>Power</strong>-Sector<br />
as a Share of<br />
Statewide<br />
Total (2010)<br />
Estimated<br />
Share of<br />
Statewide<br />
Emissions<br />
Contributed by<br />
Top 5±<br />
VT 1 Middlebury College Middlebury College Biomass 0.01 0.0 96% 0% 0%<br />
2 Berlin 5 Green Mountain <strong>Power</strong> Corp. 0.01<br />
3 J. C. McNeil City of Burlington Electric (VT) 0.00<br />
4 Colchester 16 Green Mountain <strong>Power</strong> Corp. 0.00<br />
5 Rutland Central Vermont Pub Serv. Corp. 0.00<br />
WA 1 Transalta Centralia Generation TransAlta Centralia Gen, LLC 5.36 6.7 88% 17% 15%<br />
2 River Road Gen Plant PUD No 1 of Clark County (WA) 0.39<br />
3 March Point Cogeneration March Point Cogeneration Co. 0.36<br />
4 Mint Farm Generating Station Puget Sound Energy Inc. 0.27<br />
5 Chehalis Generating Facility PacifiCorp 0.27<br />
WI 1 Columbia Wisconsin <strong>Power</strong> & Light Co. 7.24 29.1 67% 43% 29%<br />
2 Pleasant Prairie Wisconsin Electric <strong>Power</strong> Co. 6.65<br />
3 Weston Wisconsin Public Service Corp. 5.82<br />
4 South Oak Creek Wisconsin Electric <strong>Power</strong> Co. 4.96<br />
5 Edgewater* Wisconsin <strong>Power</strong> & Light Co. 4.42<br />
WV 1 John E. Amos Appalachian <strong>Power</strong> Co. 13.88 49.3 69% 75% 52%<br />
2 FirstEnergy Harrison <strong>Power</strong> Station Allegheny Energy Supply Co., LLC 10.37<br />
3 Mountaineer Appalachian <strong>Power</strong> Co. 8.50<br />
4 Mitchell Ohio <strong>Power</strong> Co. 8.37<br />
5 Mt. Storm Virginia Electric & <strong>Power</strong> Co. 8.18<br />
WY 1 Jim Bridger PacifiCorp 12.87 38.1 89% 66% 59%<br />
2 Laramie River Station Basin Electric <strong>Power</strong> Coop 12.21<br />
3 Dave Johnston PacifiCorp 5.50<br />
4 Naughton PacifiCorp 5.34<br />
5 Wyodak PacifiCorp 2.20<br />
*Indicates that this power plant is scheduled for retirement. 113<br />
± Obtained by multiplying Emissions for Top 5 as a Share of <strong>Power</strong>-Sector Total (2011) by Emissions for <strong>Power</strong>-Sector as a Share of Statewide Total (2010) U.S. EIA does not have state-by-state data for<br />
power-sector emissions for 2011.<br />
Appendices 41
Notes<br />
1. Intergovernmental Panel on Climate Change, “Summary<br />
for Policy Makers” in C.B. Field, et al. (eds.),<br />
Intergovernmental Panel on Climate Change, Special<br />
Report on Managing the Risks of Extreme Events and<br />
,<br />
2011.<br />
2. Tony Dutzik, Elizabeth Ridlington and Tom Van<br />
ment<br />
America Research & Policy Center, In the Path<br />
of the Storm: Global Warming, Extreme Weather<br />
and the Impacts of Weather-Related Disasters in the<br />
United States from 2007 to 2012<br />
<br />
<br />
-<br />
<br />
<br />
<br />
-<br />
Summer 2012 Drought Update<br />
-<br />
<br />
<br />
<br />
Center<br />
July 2012<br />
<br />
4. See note 2.<br />
5. tary,<br />
<br />
, <br />
Standards<br />
of Performance for Greenhouse Gas Emissions<br />
-<br />
<br />
<br />
.<br />
6. <br />
Climate Change, Climate Change 2007: The Physical<br />
<br />
Fourth Assessment Report of the Intergovernmental<br />
Panel on Climate Change, 2007;<br />
<br />
<br />
Council, Advancing the Science of Climate Change,<br />
<br />
<br />
Agency, Inventory of U.S. Greenhouse Gas Emissions<br />
and Sinks: 1990-2011<br />
, Inventory of<br />
U.S. Greenhouse Gas Emissions and Sinks: 1990-2011,<br />
<br />
<br />
<br />
<br />
<br />
<br />
<br />
Form EIA-923 detailed<br />
data<br />
<br />
9. State-Level<br />
Energy-Related Carbon Dioxide Emissions, 2000-2010,<br />
<br />
10. <br />
<br />
lands<br />
Environmental Assessment Agency, Emission<br />
Database for Global Atmospheric Research (EDGAR)<br />
<br />
<br />
methodology.<br />
11. See note 10.<br />
12. <br />
<br />
-<br />
<br />
<br />
<br />
<br />
2 <br />
-<br />
2 Emissions, data for<br />
<br />
42 <strong>America’s</strong> <strong>Dirtiest</strong> <strong>Power</strong> <strong>Plants</strong>
-<br />
<br />
<br />
<br />
<br />
ence<br />
case” , released 15<br />
<br />
See note 10.<br />
14. Ibid.<br />
15. Ibid.<br />
16. See note 9.<br />
<br />
<br />
<br />
<br />
<br />
<br />
Electric Sales, Revenue, and Average<br />
e 2. Sales to Bundled and Unbundled Consumers<br />
by Sector, Census Division, and State, released<br />
<br />
eGRID<br />
2 <br />
Agency, eGRID2012 Version 1.0<br />
<br />
<br />
2 in 2011.<br />
<br />
19. <br />
<br />
.<br />
20. <br />
21. See note 9.<br />
22. <br />
<br />
Calculated using an annual eGRID 2 emissions<br />
2 <br />
<br />
<br />
<br />
Electric Sales, Revenue, and Average Price—Table 2.<br />
Sales to Bundled and Unbundled Consumers by Sector,<br />
Census Division, and State-<br />
<br />
<br />
<br />
24. <br />
25. <br />
<br />
<br />
<br />
reduced.<br />
26. <br />
<br />
<br />
gen.cfm.<br />
<br />
<br />
<br />
The Case for Closing <strong>America’s</strong> Costliest Coal <strong>Plants</strong>,<br />
<br />
Ibid.<br />
29. <br />
<br />
<br />
<br />
<br />
Ibid.<br />
See methodology.<br />
<br />
<br />
<br />
-<br />
<br />
<br />
-<br />
<br />
<br />
-<br />
<br />
sector emissions from 2011.<br />
See notes 1 and 2.<br />
See note 2.<br />
<br />
<br />
<br />
<br />
<br />
<br />
vent<br />
dangerous climate change, based both on the<br />
<br />
-<br />
<br />
<br />
<br />
Notes 43
Philosophical Transac-<br />
<br />
rsta.2010.0290, 2011.<br />
<br />
Intergovernmental Panel on Climate Change, Cli-<br />
<br />
Working Groups I, II and III to the Fourth Assessment<br />
Report of the Intergovernmental Panel on Climate<br />
Change<br />
<br />
<br />
40. <br />
, 12<br />
January 2011.<br />
41. 2010 in Top Three<br />
<br />
<br />
42. See note 40.<br />
<br />
44. Ibid.<br />
See note 6, Intergovernmental Panel on Climate<br />
Change.<br />
45. See note 6, Intergovernmental Panel on Climate<br />
<br />
<br />
<br />
(category 4 and 5) increases by nearly one-third.<br />
James Elsner et al., “The Increasing Intensity of the<br />
Nature 455, 92-95, 4<br />
<br />
46. See note 6, Intergovernmental Panel on Climate<br />
Change.<br />
<br />
<br />
nology,<br />
Joint Program on the Science and Policy<br />
st<br />
-<br />
<br />
Journal of Climate<br />
<br />
<br />
ture,”<br />
<br />
Tony Dutzik et al., see note 2.<br />
<br />
<br />
Change due to Carbon Emissions,” Proceedings of the<br />
<br />
February 2009.<br />
49. <br />
Warmer World Must be Avoided<br />
-<br />
<br />
50. Ibid.<br />
51. Ibid.<br />
52. Ibid.<br />
<br />
Ibid.<br />
54. Ibid.<br />
55. <br />
<br />
56. <br />
<br />
-<br />
, June 2011.<br />
<br />
<br />
<br />
<br />
of Climate Change<br />
<br />
<br />
-<br />
<br />
Global Climate Change Impacts in the United States,<br />
2009.<br />
59. cil,<br />
Killer Summer Heat: Projected Death Toll from Rising<br />
Temperatures in America Due to Climate Change,<br />
May 2012.<br />
60. Ibid.<br />
61. <br />
62. Rising Tide of Ill-<br />
<br />
of Waterborne Diseases, July 2010.<br />
<br />
<br />
44 <strong>America’s</strong> <strong>Dirtiest</strong> <strong>Power</strong> <strong>Plants</strong>
64. Ibid.<br />
65. <br />
Environment America Research & Policy Center,<br />
-<br />
<br />
Health<br />
66. -<br />
The<br />
Lancet<br />
<br />
<br />
<br />
<br />
<br />
Sulfur Dioxide:<br />
Health-<br />
<br />
<br />
<br />
<br />
<br />
<br />
Presi-<br />
-<br />
, <br />
Standards<br />
of Performance for Greenhouse Gas Emissions<br />
-<br />
<br />
<br />
.<br />
Ibid.<br />
<br />
<br />
<br />
and methodology. <br />
<br />
69. Acid Rain,<br />
<br />
<br />
<br />
<br />
<br />
<br />
<br />
<br />
<br />
<br />
<br />
, 21 July 2009.<br />
<br />
-<br />
Climate<br />
, <br />
Group III to the Fourth Assessment Report of the<br />
Intergovernmental Panel on Climate Change<br />
<br />
<br />
<br />
<br />
Environment America Research & Policy Center, The<br />
<br />
-<br />
ing<br />
a Clean Energy Path to Address Global Warming,<br />
<br />
<br />
Plan <br />
<br />
<br />
<br />
<br />
<br />
<br />
<br />
Statement of Joseph Mendelson, Legal Director,<br />
<br />
November 1999<br />
<br />
Ibid.<br />
Ibid.<br />
Ibid.<br />
<br />
<br />
90. Ibid.<br />
-<br />
,<br />
<br />
<br />
Back-<br />
<br />
<br />
<br />
on EPA GHG Regulatory and Policy Proposals, 19 July<br />
2011.<br />
What are Federal Agencies<br />
<br />
<br />
<br />
Reducing Greenhouse Gas Emissions in the<br />
<br />
, July 2010.<br />
<br />
Ibid.<br />
Notes 45
91. Proposed Carbon<br />
(fact sheet),<br />
<br />
<br />
92. <br />
<br />
<br />
94. Annual En-<br />
<br />
95. <br />
Air Markets Program<br />
Data <br />
<br />
96. This fuel category includes anthracite culm, bitumi-<br />
<br />
<br />
<br />
<br />
<br />
Emission Factors for Greenhouse<br />
Gas Inventories<br />
Ibid.<br />
Benchmarking Air<br />
ers<br />
in the United States<br />
<br />
99. <br />
oils.<br />
100. <br />
101. <br />
number 6.<br />
102. <br />
<br />
<br />
<br />
<br />
-<br />
<br />
<br />
<br />
104. <br />
-<br />
<br />
105. -<br />
<br />
106. <br />
<br />
note 96.<br />
<br />
<br />
note 96.<br />
See note 9.<br />
109. -<br />
<br />
Agency’s Greenhouse Gas Equivalencies Calculator<br />
<br />
110. <br />
<br />
<br />
<br />
111. <br />
<br />
112. See note 109.<br />
See note 110.<br />
46 <strong>America’s</strong> <strong>Dirtiest</strong> <strong>Power</strong> <strong>Plants</strong>