America’s Dirtiest Power Plants
America's Dirtiest Power Plants - Environment Minnesota
America's Dirtiest Power Plants - Environment Minnesota
- No tags were found...

Create successful ePaper yourself
Turn your PDF publications into a flip-book with our unique Google optimized e-Paper software.
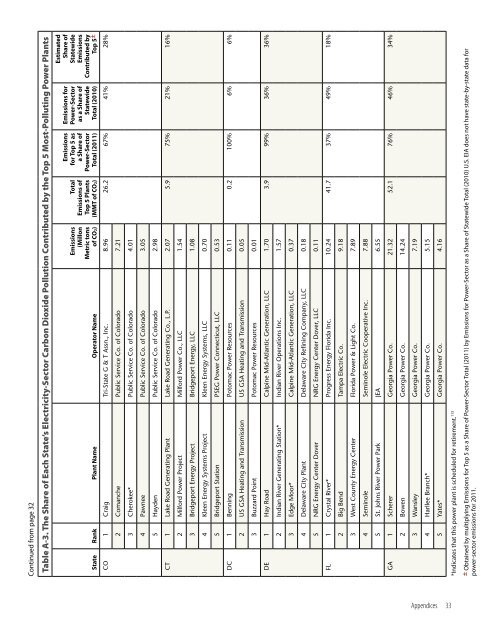
Continued from page 32<br />
Table A-3. The Share of Each State’s Electricity-Sector Carbon Dioxide Pollution Contributed by the Top 5 Most-Polluting <strong>Power</strong> <strong>Plants</strong><br />
State Rank Plant Name Operator Name<br />
Emissions<br />
(Millon<br />
Metric tons<br />
of CO2)<br />
Total<br />
Emissions of<br />
Top 5 <strong>Plants</strong><br />
(MMT of CO2)<br />
Emissions<br />
for Top 5 as<br />
a Share of<br />
<strong>Power</strong>-Sector<br />
Total (2011)<br />
Emissions for<br />
<strong>Power</strong>-Sector<br />
as a Share of<br />
Statewide<br />
Total (2010)<br />
Estimated<br />
Share of<br />
Statewide<br />
Emissions<br />
Contributed by<br />
Top 5±<br />
CO 1 Craig Tri-State G & T Assn., Inc. 8.96 26.2 67% 41% 28%<br />
2 Comanche Public Service Co. of Colorado 7.21<br />
3 Cherokee* Public Service Co. of Colorado 4.01<br />
4 Pawnee Public Service Co. of Colorado 3.05<br />
5 Hayden Public Service Co. of Colorado 2.98<br />
CT 1 Lake Road Generating Plant Lake Road Generating Co., L.P. 2.07 5.9 75% 21% 16%<br />
2 Milford <strong>Power</strong> Project Milford <strong>Power</strong> Co., LLC 1.54<br />
3 Bridgeport Energy Project Bridgeport Energy, LLC 1.08<br />
4 Kleen Energy Systems Project Kleen Energy Systems, LLC 0.70<br />
5 Bridgeport Station PSEG <strong>Power</strong> Connecticut, LLC 0.53<br />
DC 1 Benning Potomac <strong>Power</strong> Resources 0.11 0.2 100% 6% 6%<br />
2 US GSA Heating and Transmission US GSA Heating and Transmission 0.05<br />
3 Buzzard Point Potomac <strong>Power</strong> Resources 0.01<br />
DE 1 Hay Road Calpine Mid-Atlantic Generation, LLC 1.70 3.9 99% 36% 36%<br />
2 Indian River Generating Station* Indian River Operations Inc. 1.57<br />
3 Edge Moor* Calpine Mid-Atlantic Generation, LLC 0.37<br />
4 Delaware City Plant Delaware City Refining Company, LLC 0.18<br />
5 NRG Energy Center Dover NRG Energy Center Dover, LLC 0.11<br />
FL 1 Crystal River* Progress Energy Florida Inc. 10.24 41.7 37% 49% 18%<br />
2 Big Bend Tampa Electric Co. 9.18<br />
3 West County Energy Center Florida <strong>Power</strong> & Light Co. 7.89<br />
4 Seminole Seminole Electric Cooperative Inc. 7.88<br />
5 St. Johns River <strong>Power</strong> Park JEA 6.55<br />
GA 1 Scherer Georgia <strong>Power</strong> Co. 21.32 52.1 76% 46% 34%<br />
2 Bowen Georgia <strong>Power</strong> Co. 14.24<br />
3 Wansley Georgia <strong>Power</strong> Co. 7.19<br />
4 Harllee Branch* Georgia <strong>Power</strong> Co. 5.15<br />
5 Yates* Georgia <strong>Power</strong> Co. 4.16<br />
*Indicates that this power plant is scheduled for retirement. 113<br />
± Obtained by multiplying Emissions for Top 5 as a Share of <strong>Power</strong>-Sector Total (2011) by Emissions for <strong>Power</strong>-Sector as a Share of Statewide Total (2010) U.S. EIA does not have state-by-state data for<br />
power-sector emissions for 2011.<br />
Appendices 33