America’s Dirtiest Power Plants
America's Dirtiest Power Plants - Environment Minnesota
America's Dirtiest Power Plants - Environment Minnesota
- No tags were found...

You also want an ePaper? Increase the reach of your titles
YUMPU automatically turns print PDFs into web optimized ePapers that Google loves.
Continued from page 35<br />
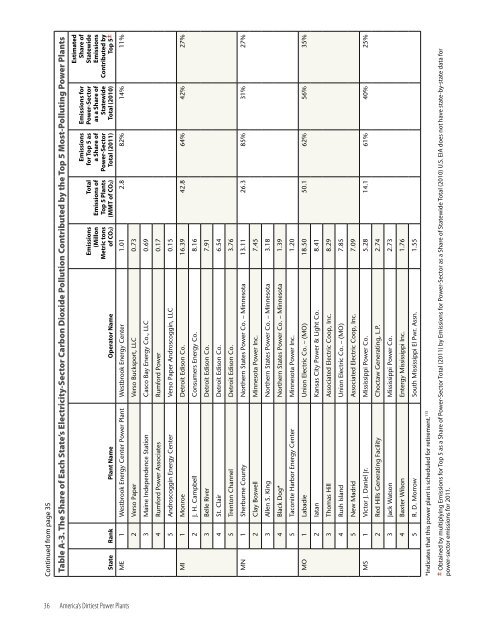
Table A-3. The Share of Each State’s Electricity-Sector Carbon Dioxide Pollution Contributed by the Top 5 Most-Polluting <strong>Power</strong> <strong>Plants</strong><br />
State Rank Plant Name Operator Name<br />
Emissions<br />
(Millon<br />
Metric tons<br />
of CO2)<br />
Total<br />
Emissions of<br />
Top 5 <strong>Plants</strong><br />
(MMT of CO2)<br />
Emissions<br />
for Top 5 as<br />
a Share of<br />
<strong>Power</strong>-Sector<br />
Total (2011)<br />
Emissions for<br />
<strong>Power</strong>-Sector<br />
as a Share of<br />
Statewide<br />
Total (2010)<br />
Estimated<br />
Share of<br />
Statewide<br />
Emissions<br />
Contributed by<br />
Top 5±<br />
ME 1 Westbrook Energy Center <strong>Power</strong> Plant Westbrook Energy Center 1.01 2.8 82% 14% 11%<br />
2 Verso Paper Verso Bucksport, LLC 0.73<br />
3 Maine Independence Station Casco Bay Energy Co., LLC 0.69<br />
4 Rumford <strong>Power</strong> Associates Rumford <strong>Power</strong> 0.17<br />
5 Androscoggin Energy Center Verso Paper Androscoggin, LLC 0.15<br />
MI 1 Monroe Detroit Edison Co. 16.39 42.8 64% 42% 27%<br />
2 J. H. Campbell Consumers Energy Co. 8.16<br />
3 Belle River Detroit Edison Co. 7.91<br />
4 St. Clair Detroit Edison Co. 6.54<br />
5 Trenton Channel Detroit Edison Co. 3.76<br />
MN 1 Sherburne County Northern States <strong>Power</strong> Co. – Minnesota 13.11 26.3 85% 31% 27%<br />
2 Clay Boswell Minnesota <strong>Power</strong> Inc. 7.45<br />
3 Allen S. King Northern States <strong>Power</strong> Co. – Minnesota 3.18<br />
4 Black Dog* Northern States <strong>Power</strong> Co. – Minnesota 1.39<br />
5 Taconite Harbor Energy Center Minnesota <strong>Power</strong> Inc. 1.20<br />
MO 1 Labadie Union Electric Co. – (MO) 18.50 50.1 62% 56% 35%<br />
2 Iatan Kansas City <strong>Power</strong> & Light Co. 8.41<br />
3 Thomas Hill Associated Electric Coop, Inc. 8.29<br />
4 Rush Island Union Electric Co. – (MO) 7.85<br />
5 New Madrid Associated Electric Coop, Inc. 7.09<br />
MS 1 Victor J. Daniel Jr. Mississippi <strong>Power</strong> Co. 5.28 14.1 61% 40% 25%<br />
2 Red Hills Generating Facility Choctaw Generating, L.P. 2.74<br />
3 Jack Watson Mississippi <strong>Power</strong> Co. 2.73<br />
4 Baxter Wilson Entergy Mississippi Inc. 1.76<br />
5 R. D. Morrow South Mississippi El Pwr. Assn. 1.55<br />
*Indicates that this power plant is scheduled for retirement. 113<br />
± Obtained by multiplying Emissions for Top 5 as a Share of <strong>Power</strong>-Sector Total (2011) by Emissions for <strong>Power</strong>-Sector as a Share of Statewide Total (2010) U.S. EIA does not have state-by-state data for<br />
power-sector emissions for 2011.<br />
36 <strong>America’s</strong> <strong>Dirtiest</strong> <strong>Power</strong> <strong>Plants</strong>