America’s Dirtiest Power Plants
America's Dirtiest Power Plants - Environment Minnesota
America's Dirtiest Power Plants - Environment Minnesota
- No tags were found...

Create successful ePaper yourself
Turn your PDF publications into a flip-book with our unique Google optimized e-Paper software.
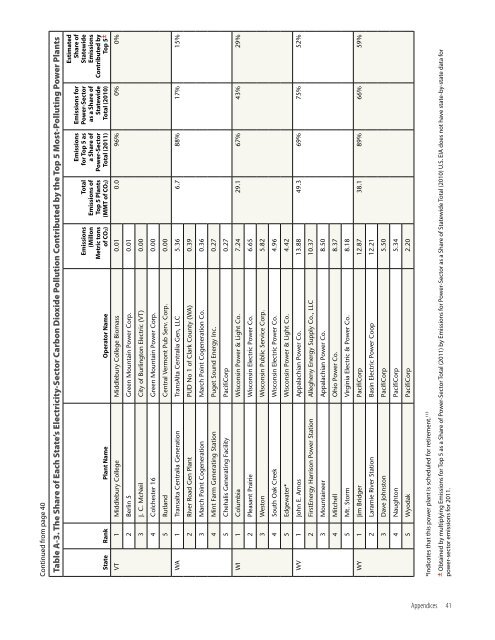
Continued from page 40<br />
Table A-3. The Share of Each State’s Electricity-Sector Carbon Dioxide Pollution Contributed by the Top 5 Most-Polluting <strong>Power</strong> <strong>Plants</strong><br />
State Rank Plant Name Operator Name<br />
Emissions<br />
(Millon<br />
Metric tons<br />
of CO2)<br />
Total<br />
Emissions of<br />
Top 5 <strong>Plants</strong><br />
(MMT of CO2)<br />
Emissions<br />
for Top 5 as<br />
a Share of<br />
<strong>Power</strong>-Sector<br />
Total (2011)<br />
Emissions for<br />
<strong>Power</strong>-Sector<br />
as a Share of<br />
Statewide<br />
Total (2010)<br />
Estimated<br />
Share of<br />
Statewide<br />
Emissions<br />
Contributed by<br />
Top 5±<br />
VT 1 Middlebury College Middlebury College Biomass 0.01 0.0 96% 0% 0%<br />
2 Berlin 5 Green Mountain <strong>Power</strong> Corp. 0.01<br />
3 J. C. McNeil City of Burlington Electric (VT) 0.00<br />
4 Colchester 16 Green Mountain <strong>Power</strong> Corp. 0.00<br />
5 Rutland Central Vermont Pub Serv. Corp. 0.00<br />
WA 1 Transalta Centralia Generation TransAlta Centralia Gen, LLC 5.36 6.7 88% 17% 15%<br />
2 River Road Gen Plant PUD No 1 of Clark County (WA) 0.39<br />
3 March Point Cogeneration March Point Cogeneration Co. 0.36<br />
4 Mint Farm Generating Station Puget Sound Energy Inc. 0.27<br />
5 Chehalis Generating Facility PacifiCorp 0.27<br />
WI 1 Columbia Wisconsin <strong>Power</strong> & Light Co. 7.24 29.1 67% 43% 29%<br />
2 Pleasant Prairie Wisconsin Electric <strong>Power</strong> Co. 6.65<br />
3 Weston Wisconsin Public Service Corp. 5.82<br />
4 South Oak Creek Wisconsin Electric <strong>Power</strong> Co. 4.96<br />
5 Edgewater* Wisconsin <strong>Power</strong> & Light Co. 4.42<br />
WV 1 John E. Amos Appalachian <strong>Power</strong> Co. 13.88 49.3 69% 75% 52%<br />
2 FirstEnergy Harrison <strong>Power</strong> Station Allegheny Energy Supply Co., LLC 10.37<br />
3 Mountaineer Appalachian <strong>Power</strong> Co. 8.50<br />
4 Mitchell Ohio <strong>Power</strong> Co. 8.37<br />
5 Mt. Storm Virginia Electric & <strong>Power</strong> Co. 8.18<br />
WY 1 Jim Bridger PacifiCorp 12.87 38.1 89% 66% 59%<br />
2 Laramie River Station Basin Electric <strong>Power</strong> Coop 12.21<br />
3 Dave Johnston PacifiCorp 5.50<br />
4 Naughton PacifiCorp 5.34<br />
5 Wyodak PacifiCorp 2.20<br />
*Indicates that this power plant is scheduled for retirement. 113<br />
± Obtained by multiplying Emissions for Top 5 as a Share of <strong>Power</strong>-Sector Total (2011) by Emissions for <strong>Power</strong>-Sector as a Share of Statewide Total (2010) U.S. EIA does not have state-by-state data for<br />
power-sector emissions for 2011.<br />
Appendices 41