America’s Dirtiest Power Plants
America's Dirtiest Power Plants - Environment Minnesota
America's Dirtiest Power Plants - Environment Minnesota
- No tags were found...

Create successful ePaper yourself
Turn your PDF publications into a flip-book with our unique Google optimized e-Paper software.
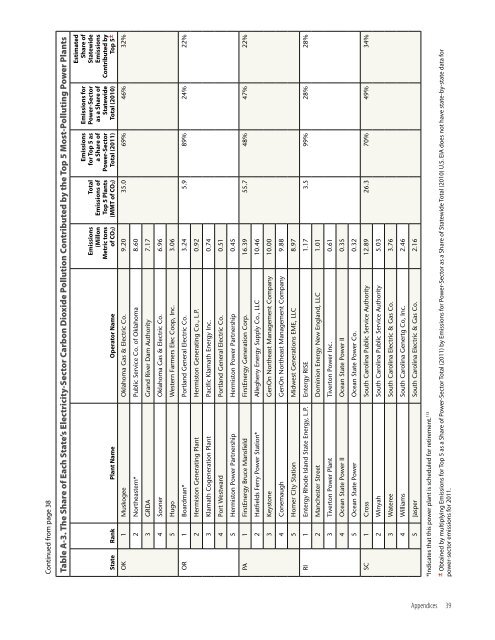
Continued from page 38<br />
Table A-3. The Share of Each State’s Electricity-Sector Carbon Dioxide Pollution Contributed by the Top 5 Most-Polluting <strong>Power</strong> <strong>Plants</strong><br />
State Rank Plant Name Operator Name<br />
Emissions<br />
(Millon<br />
Metric tons<br />
of CO2)<br />
Total<br />
Emissions of<br />
Top 5 <strong>Plants</strong><br />
(MMT of CO2)<br />
Emissions<br />
for Top 5 as<br />
a Share of<br />
<strong>Power</strong>-Sector<br />
Total (2011)<br />
Emissions for<br />
<strong>Power</strong>-Sector<br />
as a Share of<br />
Statewide<br />
Total (2010)<br />
Estimated<br />
Share of<br />
Statewide<br />
Emissions<br />
Contributed by<br />
Top 5±<br />
OK 1 Muskogee Oklahoma Gas & Electric Co. 9.20 35.0 69% 46% 32%<br />
2 Northeastern* Public Service Co. of Oklahoma 8.60<br />
3 GRDA Grand River Dam Authority 7.17<br />
4 Sooner Oklahoma Gas & Electric Co. 6.96<br />
5 Hugo Western Farmers Elec Coop, Inc. 3.06<br />
OR 1 Boardman* Portland General Electric Co. 3.24 5.9 89% 24% 22%<br />
2 Hermiston Generating Plant Hermiston Generating Co., L.P. 0.92<br />
3 Klamath Cogeneration Plant Pacific Klamath Energy Inc. 0.74<br />
4 Port Westward Portland General Electric Co. 0.51<br />
5 Hermiston <strong>Power</strong> Partnership Hermiston <strong>Power</strong> Partnership 0.45<br />
PA 1 FirstEnergy Bruce Mansfield FirstEnergy Generation Corp. 16.39 55.7 48% 47% 22%<br />
2 Hatfields Ferry <strong>Power</strong> Station* Allegheny Energy Supply Co., LLC 10.46<br />
3 Keystone GenOn Northeast Management Company 10.00<br />
4 Conemaugh GenOn Northeast Management Company 9.88<br />
5 Homer City Station Midwest Generations EME, LLC 8.97<br />
RI 1 Entergy Rhode Island State Energy, L.P. Entergy RISE 1.17 3.5 99% 28% 28%<br />
2 Manchester Street Dominion Energy New England, LLC 1.01<br />
3 Tiverton <strong>Power</strong> Plant Tiverton <strong>Power</strong> Inc. 0.61<br />
4 Ocean State <strong>Power</strong> II Ocean State <strong>Power</strong> II 0.35<br />
5 Ocean State <strong>Power</strong> Ocean State <strong>Power</strong> Co. 0.32<br />
SC 1 Cross South Carolina Public Service Authority 12.89 26.3 70% 49% 34%<br />
2 Winyah South Carolina Public Service Authority 5.03<br />
3 Wateree South Carolina Electric & Gas Co. 3.76<br />
4 Williams South Carolina Genertg Co, Inc. 2.46<br />
5 Jasper South Carolina Electric & Gas Co. 2.16<br />
*Indicates that this power plant is scheduled for retirement. 113<br />
± Obtained by multiplying Emissions for Top 5 as a Share of <strong>Power</strong>-Sector Total (2011) by Emissions for <strong>Power</strong>-Sector as a Share of Statewide Total (2010) U.S. EIA does not have state-by-state data for<br />
power-sector emissions for 2011.<br />
Appendices 39