America’s Dirtiest Power Plants
America's Dirtiest Power Plants - Environment Minnesota
America's Dirtiest Power Plants - Environment Minnesota
- No tags were found...

You also want an ePaper? Increase the reach of your titles
YUMPU automatically turns print PDFs into web optimized ePapers that Google loves.
Continued from page 26<br />
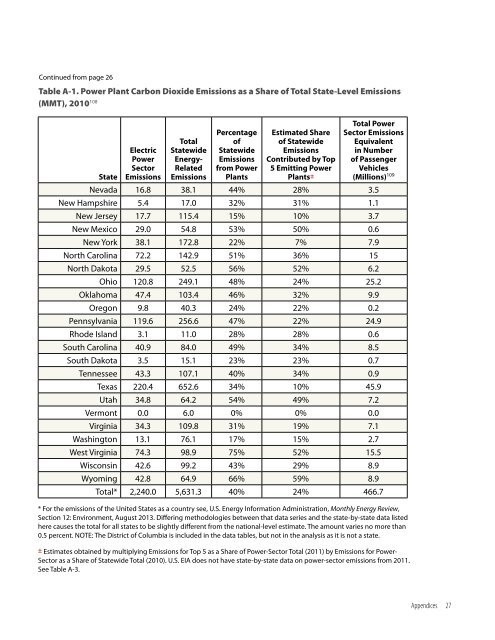
Table A-1. <strong>Power</strong> Plant Carbon Dioxide Emissions as a Share of Total State-Level Emissions<br />
(MMT), 2010 108<br />
State<br />
Electric<br />
<strong>Power</strong><br />
Sector<br />
Emissions<br />
Total<br />
Statewide<br />
Energy-<br />
Related<br />
Emissions<br />
Percentage<br />
of<br />
Statewide<br />
Emissions<br />
from <strong>Power</strong><br />
<strong>Plants</strong><br />
Estimated Share<br />
of Statewide<br />
Emissions<br />
Contributed by Top<br />
5 Emitting <strong>Power</strong><br />
<strong>Plants</strong>±<br />
Total <strong>Power</strong><br />
Sector Emissions<br />
Equivalent<br />
in Number<br />
of Passenger<br />
Vehicles<br />
(Millions) 109<br />
Nevada 16.8 38.1 44% 28% 3.5<br />
New Hampshire 5.4 17.0 32% 31% 1.1<br />
New Jersey 17.7 115.4 15% 10% 3.7<br />
New Mexico 29.0 54.8 53% 50% 0.6<br />
New York 38.1 172.8 22% 7% 7.9<br />
North Carolina 72.2 142.9 51% 36% 15<br />
North Dakota 29.5 52.5 56% 52% 6.2<br />
Ohio 120.8 249.1 48% 24% 25.2<br />
Oklahoma 47.4 103.4 46% 32% 9.9<br />
Oregon 9.8 40.3 24% 22% 0.2<br />
Pennsylvania 119.6 256.6 47% 22% 24.9<br />
Rhode Island 3.1 11.0 28% 28% 0.6<br />
South Carolina 40.9 84.0 49% 34% 8.5<br />
South Dakota 3.5 15.1 23% 23% 0.7<br />
Tennessee 43.3 107.1 40% 34% 0.9<br />
Texas 220.4 652.6 34% 10% 45.9<br />
Utah 34.8 64.2 54% 49% 7.2<br />
Vermont 0.0 6.0 0% 0% 0.0<br />
Virginia 34.3 109.8 31% 19% 7.1<br />
Washington 13.1 76.1 17% 15% 2.7<br />
West Virginia 74.3 98.9 75% 52% 15.5<br />
Wisconsin 42.6 99.2 43% 29% 8.9<br />
Wyoming 42.8 64.9 66% 59% 8.9<br />
Total* 2,240.0 5,631.3 40% 24% 466.7<br />
* For the emissions of the United States as a country see, U.S. Energy Information Administration, Monthly Energy Review,<br />
Section 12: Environment, August 2013. Differing methodologies between that data series and the state-by-state data listed<br />
here causes the total for all states to be slightly different from the national-level estimate. The amount varies no more than<br />
0.5 percent. NOTE: The District of Columbia is included in the data tables, but not in the analysis as it is not a state.<br />
± Estimates obtained by multiplying Emissions for Top 5 as a Share of <strong>Power</strong>-Sector Total (2011) by Emissions for <strong>Power</strong>-<br />
Sector as a Share of Statewide Total (2010). U.S. EIA does not have state-by-state data on power-sector emissions from 2011.<br />
See Table A-3.<br />
Appendices 27