America’s Dirtiest Power Plants
America's Dirtiest Power Plants - Environment Minnesota
America's Dirtiest Power Plants - Environment Minnesota
- No tags were found...

You also want an ePaper? Increase the reach of your titles
YUMPU automatically turns print PDFs into web optimized ePapers that Google loves.
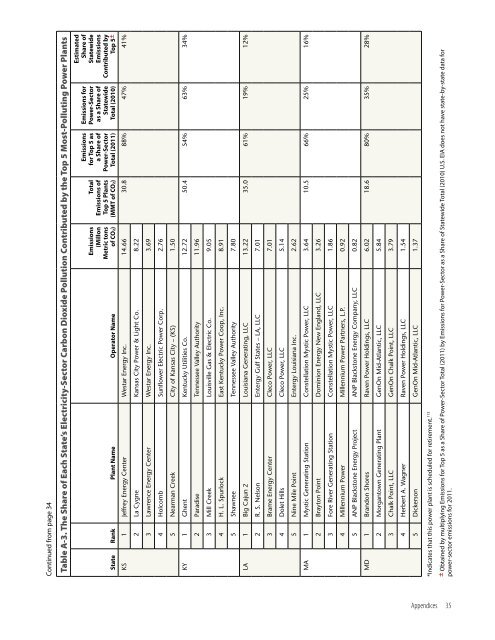
Continued from page 34<br />
Table A-3. The Share of Each State’s Electricity-Sector Carbon Dioxide Pollution Contributed by the Top 5 Most-Polluting <strong>Power</strong> <strong>Plants</strong><br />
State Rank Plant Name Operator Name<br />
Emissions<br />
(Millon<br />
Metric tons<br />
of CO2)<br />
Total<br />
Emissions of<br />
Top 5 <strong>Plants</strong><br />
(MMT of CO2)<br />
Emissions<br />
for Top 5 as<br />
a Share of<br />
<strong>Power</strong>-Sector<br />
Total (2011)<br />
Emissions for<br />
<strong>Power</strong>-Sector<br />
as a Share of<br />
Statewide<br />
Total (2010)<br />
Estimated<br />
Share of<br />
Statewide<br />
Emissions<br />
Contributed by<br />
Top 5±<br />
KS 1 Jeffrey Energy Center Westar Energy Inc. 14.66 30.8 88% 47% 41%<br />
2 La Cygne Kansas City <strong>Power</strong> & Light Co. 8.22<br />
3 Lawrence Energy Center Westar Energy Inc. 3.69<br />
4 Holcomb Sunflower Electric <strong>Power</strong> Corp. 2.76<br />
5 Nearman Creek City of Kansas City – (KS) 1.50<br />
KY 1 Ghent Kentucky Utilities Co. 12.72 50.4 54% 63% 34%<br />
2 Paradise Tennessee Valley Authority 11.96<br />
3 Mill Creek Louisville Gas & Electric Co. 9.05<br />
4 H. L. Spurlock East Kentucky <strong>Power</strong> Coop, Inc. 8.91<br />
5 Shawnee Tennessee Valley Authority 7.80<br />
LA 1 Big Cajun 2 Louisiana Generating, LLC 13.22 35.0 61% 19% 12%<br />
2 R. S. Nelson Entergy Gulf States – LA, LLC 7.01<br />
3 Brame Energy Center Cleco <strong>Power</strong>, LLC 7.01<br />
4 Dolet Hills Cleco <strong>Power</strong>, LLC 5.14<br />
5 Nine Mile Point Entergy Louisiana Inc. 2.62<br />
MA 1 Mystic Generating Station Constellation Mystic <strong>Power</strong>, LLC 3.64 10.5 66% 25% 16%<br />
2 Brayton Point Dominion Energy New England, LLC 3.26<br />
3 Fore River Generating Station Constellation Mystic <strong>Power</strong>, LLC 1.86<br />
4 Millennium <strong>Power</strong> Millennium <strong>Power</strong> Partners, L.P. 0.92<br />
5 ANP Blackstone Energy Project ANP Blackstone Energy Company, LLC 0.82<br />
MD 1 Brandon Shores Raven <strong>Power</strong> Holdings, LLC 6.02 18.6 80% 35% 28%<br />
2 Morgantown Generating Plant GenOn Mid-Atlantic, LLC 5.84<br />
3 Chalk Point, LLC GenOn Chalk Point, LLC 3.79<br />
4 Herbert A. Wagner Raven <strong>Power</strong> Holdings, LLC 1.54<br />
5 Dickerson GenOn Mid-Atlantic, LLC 1.37<br />
*Indicates that this power plant is scheduled for retirement. 113<br />
± Obtained by multiplying Emissions for Top 5 as a Share of <strong>Power</strong>-Sector Total (2011) by Emissions for <strong>Power</strong>-Sector as a Share of Statewide Total (2010) U.S. EIA does not have state-by-state data for<br />
power-sector emissions for 2011.<br />
Appendices 35